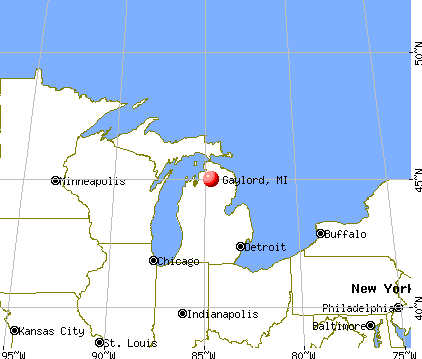
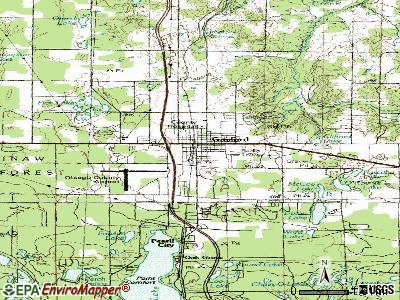
Gaylord, Michigan
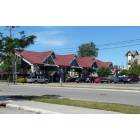
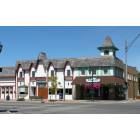
Gaylord: Unusual Street Pavilion
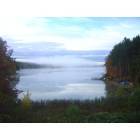
Gaylord: Foggy morning on Dixon Lake
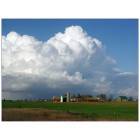
Gaylord: Beautiful farm just North of Gaylord as seen from I-75
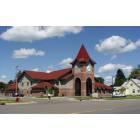
Gaylord: Gaylord's New City Hall
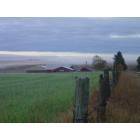
Gaylord: Gaylord farm (October 2006)
Gaylord: Downtown Area - Looking North across M-32
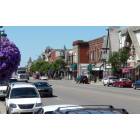
Gaylord: Downtown Area - Looking West and Slightly North down M-32
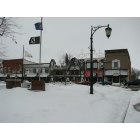
Gaylord: Shops with snow
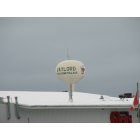
Gaylord: Gaylord's Water Tower
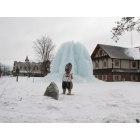
Gaylord: Ice Sculpture

Gaylord: Best kept secret in northern Michigan :)
- see
13
more - add
your
Submit your own pictures of this city and show them to the world
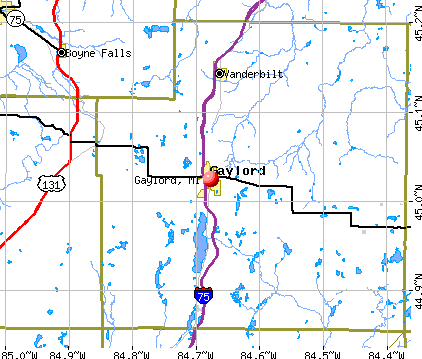
- OSM Map
- General Map
- Google Map
- MSN Map
Population change since 2000: +18.3%
 |
| Males: 1,991 | |
| Females: 2,365 |
| Median resident age: | 40.5 years |
| Michigan median age: | 40.3 years |
Zip codes: 49735.
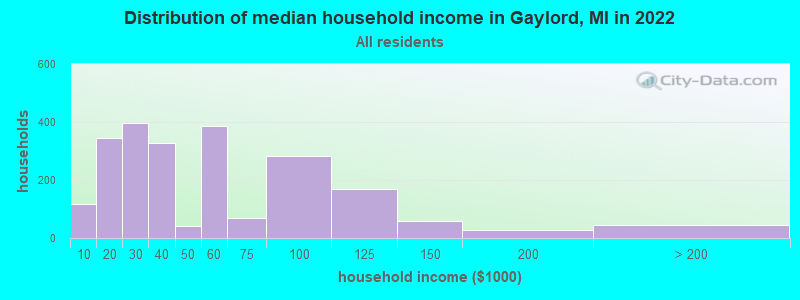
| Gaylord: | $37,839 |
| MI: | $66,986 |
Estimated per capita income in 2022: $28,864 (it was $17,313 in 2000)
Gaylord city income, earnings, and wages data
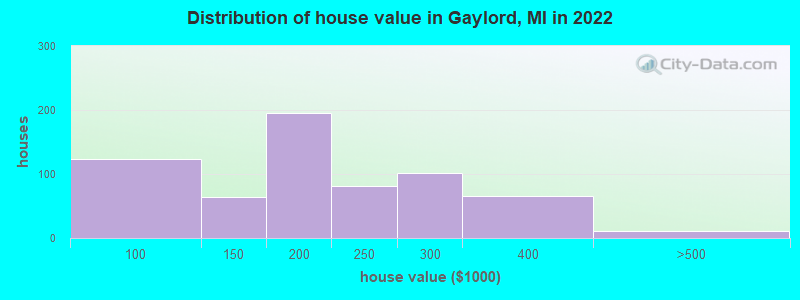
Estimated median house or condo value in 2022: $183,783 (it was $88,200 in 2000)
| Gaylord: | $183,783 |
| MI: | $224,400 |
Mean prices in 2022: all housing units: $153,426; detached houses: $167,709; mobile homes: $39,530
Median gross rent in 2022: $829.
(10.6% for White Non-Hispanic residents, 31.8% for Black residents, 72.3% for Hispanic or Latino residents, 100.0% for American Indian residents, 19.1% for two or more races residents)
Detailed information about poverty and poor residents in Gaylord, MI

Compare current foreclosures near Gaylord, MI:
| Photo | Address | Area | Beds / Baths | Price | Details |
|---|---|---|---|---|---|

|
#1
Kassuba Rd
Gaylord, MI 49735
|
- sq. feet
|
- baths - beds |
show details | |

|
#2
Silver Pine Cir, Apt 13
Gaylord, MI 49735
|
- sq. feet
|
- baths - beds |
show details | |

|
#3
Club House Trl
Gaylord, MI 49735
|
- sq. feet
|
- baths - beds |
show details | |

|
#4
Randolph St
Gaylord, MI 49735
|
- sq. feet
|
- baths - beds |
show details | |

|
#5
Sparr Rd # 1
Gaylord, MI 49735
|
- sq. feet
|
- baths - beds |
show details | |

|
#6
N Hazel Ave
Gaylord, MI 49735
|
- sq. feet
|
- baths - beds |
show details | |

|
#7
Murner Rd Apt 16
Gaylord, MI 49735
|
- sq. feet
|
- baths - beds |
show details | |

|
#8
E Sheldon St
Gaylord, MI 49735
|
- sq. feet
|
- baths - beds |
show details | |

|
#9
Hickorywood Dr
Gaylord, MI 49735
|
- sq. feet
|
- baths - beds |
show details | |

|
#10
E 4th St
Gaylord, MI 49735
|
- sq. feet
|
- baths - beds |
show details |
| Photo | Address | Area | Beds / Baths | Price | Details |
|---|---|---|---|---|---|

|
#11
Deer Trl
Gaylord, MI 49735
|
- sq. feet
|
- baths - beds |
show details | |

|
#12
Coppins Rd
Gaylord, MI 49735
|
- sq. feet
|
- baths - beds |
show details | |

|
#13
S Lucy Dr
Gaylord, MI 49735
|
- sq. feet
|
- baths - beds |
show details | |

|
#14
S Alpine Ct
Gaylord, MI 49735
|
- sq. feet
|
- baths - beds |
show details | |

|
#15
N Wisconsin Ave
Gaylord, MI 49735
|
- sq. feet
|
- baths - beds |
show details | |

|
#16
Estelle Rd
Gaylord, MI 49735
|
- sq. feet
|
- baths - beds |
show details | |

|
#17
S Vail Ln
Gaylord, MI 49735
|
- sq. feet
|
- baths - beds |
show details | |

|
#18
Enola Ln
Gaylord, MI 49735
|
- sq. feet
|
- baths - beds |
show details | |

|
#19
Murner Rd
Gaylord, MI 49735
|
- sq. feet
|
- baths - beds |
show details | |

|
#20
Sunflower Dr
Gaylord, MI 49735
|
- sq. feet
|
- baths - beds |
show details |
| Photo | Address | Area | Beds / Baths | Price | Details |
|---|---|---|---|---|---|

|
#21
Laming Cir
Elmira, MI 49730
|
1,956 sq. feet
|
2 baths 3 beds |
show details | |

|
#22
Fox
Frederic, MI 49733
|
- sq. feet
|
- baths - beds |
show details | |

|
#23
Hillview Dr
Elmira, MI 49730
|
- sq. feet
|
- baths - beds |
show details | |

|
#24
Mancelona Rd
Mancelona, MI 49659
|
- sq. feet
|
- baths - beds |
show details | |

|
#25
Airport Rd
Vanderbilt, MI 49795
|
- sq. feet
|
- baths - beds |
show details | |

|
#26
Shire Rd
Vanderbilt, MI 49795
|
- sq. feet
|
- baths - beds |
show details | |

|
#27
Us Highway 131 S
Boyne Falls, MI 49713
|
- sq. feet
|
- baths - beds |
show details | |

|
#28
Old 27 Hwy N
Vanderbilt, MI 49795
|
- sq. feet
|
- baths - beds |
show details | |

|
#29
Shire Rd
Wolverine, MI 49799
|
- sq. feet
|
- baths - beds |
show details | |

|
Check over 1 million property listings on Foreclosure.com!
|
browse all offers | |||


- 3,77988.9%White alone
- 1994.7%Two or more races
- 1513.6%Hispanic
- 852.0%Black alone
- 150.4%Asian alone
- 110.3%American Indian alone
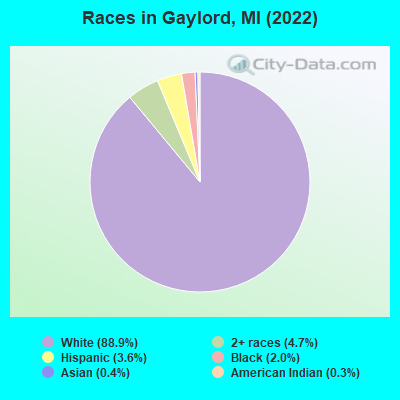
Races in Gaylord detailed stats: ancestries, foreign born residents, place of birth
According to our research of Michigan and other state lists, there were 108 registered sex offenders living in Gaylord, Michigan as of April 27, 2024.
The ratio of all residents to sex offenders in Gaylord is 34 to 1.
Type |
2009 |
2010 |
2011 |
2012 |
2013 |
2014 |
2015 |
2016 |
2017 |
2018 |
2019 |
2020 |
2021 |
2022 |
|---|---|---|---|---|---|---|---|---|---|---|---|---|---|---|
| Murders (per 100,000) | 0 (0.0) | 1 (27.4) | 0 (0.0) | 0 (0.0) | 0 (0.0) | 0 (0.0) | 0 (0.0) | 0 (0.0) | 0 (0.0) | 0 (0.0) | 0 (0.0) | 0 (0.0) | 0 (0.0) | 0 (0.0) |
| Rapes (per 100,000) | 3 (83.8) | 5 (137.2) | 4 (109.8) | 3 (82.5) | 4 (110.7) | 6 (165.1) | 6 (164.5) | 7 (191.2) | 2 (54.1) | 8 (216.6) | 2 (53.9) | 5 (135.4) | 12 (326.8) | 8 (184.3) |
| Robberies (per 100,000) | 1 (27.9) | 3 (82.3) | 0 (0.0) | 2 (55.0) | 0 (0.0) | 1 (27.5) | 0 (0.0) | 1 (27.3) | 0 (0.0) | 0 (0.0) | 0 (0.0) | 2 (54.2) | 1 (27.2) | 0 (0.0) |
| Assaults (per 100,000) | 7 (195.5) | 0 (0.0) | 4 (109.8) | 11 (302.6) | 4 (110.7) | 4 (110.0) | 7 (191.9) | 6 (163.8) | 12 (324.6) | 15 (406.2) | 12 (323.5) | 18 (487.5) | 20 (544.7) | 14 (322.6) |
| Burglaries (per 100,000) | 41 (1,145) | 20 (548.7) | 36 (988.5) | 45 (1,238) | 38 (1,051) | 22 (605.2) | 18 (493.4) | 8 (218.5) | 25 (676.2) | 7 (189.5) | 10 (269.6) | 5 (135.4) | 7 (190.6) | 6 (138.2) |
| Thefts (per 100,000) | 206 (5,754) | 235 (6,447) | 188 (5,162) | 237 (6,520) | 213 (5,892) | 187 (5,144) | 184 (5,044) | 247 (6,745) | 292 (7,898) | 248 (6,715) | 170 (4,583) | 165 (4,469) | 142 (3,867) | 140 (3,226) |
| Auto thefts (per 100,000) | 3 (83.8) | 11 (301.8) | 8 (219.7) | 9 (247.6) | 8 (221.3) | 6 (165.1) | 10 (274.1) | 2 (54.6) | 6 (162.3) | 6 (162.5) | 6 (161.8) | 9 (243.8) | 8 (217.9) | 3 (69.1) |
| Arson (per 100,000) | 0 (0.0) | 0 (0.0) | 0 (0.0) | 0 (0.0) | 0 (0.0) | 0 (0.0) | 0 (0.0) | 2 (54.6) | 1 (27.0) | 1 (27.1) | 0 (0.0) | 1 (27.1) | 3 (81.7) | 1 (23.0) |
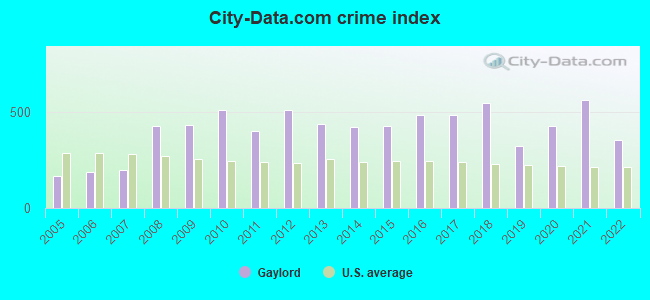
| City-Data.com crime index | 431.6 | 509.7 | 403.1 | 510.3 | 437.6 | 423.7 | 428.2 | 483.3 | 484.4 | 549.4 | 323.0 | 429.8 | 564.0 | 356.2 |
The City-Data.com crime index weighs serious crimes and violent crimes more heavily. Higher means more crime, U.S. average is 246.1. It adjusts for the number of visitors and daily workers commuting into cities.
Crime rate in Gaylord detailed stats: murders, rapes, robberies, assaults, burglaries, thefts, arson
Full-time law enforcement employees in 2021, including police officers: 12 (11 officers - 11 male; 0 female).
| Officers per 1,000 residents here: | 3.00 |
| Michigan average: | 1.86 |
 Recent articles from our blog. Our writers, many of them Ph.D. graduates or candidates, create easy-to-read articles on a wide variety of topics.

 | Moving to Gaylord Michigan...please help. (31 replies) |
| Which one! Moving to Midland or Gaylord with young family? (20 replies) |
| Upper Peninsula Trip (60 replies) |
| Need Some Advice For Moving From Idaho (5 replies) |
| how do you pronounce Gaylord (11 replies) |
| Central and Western North LP. (20 replies) |
Latest news from Gaylord, MI collected exclusively by city-data.com from local newspapers, TV, and radio stations
Ancestries: Polish (23.7%), Irish (15.9%), German (14.5%), English (5.3%), Czechoslovakian (3.9%), Italian (3.5%).
Current Local Time: EST time zone
Elevation: 1349 feet
Land area: 3.95 square miles.
Population density: 1,104 people per square mile (low).
50 residents are foreign born
| This city: | 1.2% |
| Michigan: | 6.9% |
Median real estate property taxes paid for housing units with mortgages in 2022: $2,710 (1.6%)
Median real estate property taxes paid for housing units with no mortgage in 2022: $3,420 (1.2%)
Nearest city with pop. 50,000+: Saginaw, MI  (116.6 miles , pop. 61,799).
Nearest city with pop. 200,000+: Detroit, MI (198.7 miles , pop. 951,270).
Nearest city with pop. 1,000,000+: Chicago, IL (266.9 miles , pop. 2,896,016).
Nearest cities:
), ), ), ), )Latitude: 45.02 N, Longitude: 84.68 W
Daytime population change due to commuting: +7,690 (+180.9%)
Workers who live and work in this city: 1,569 (83.6%)
Area code: 989

Gaylord, Michigan accommodation & food services, waste management - Economy and Business Data
| Here: | 4.4% |
| Michigan: | 3.5% |
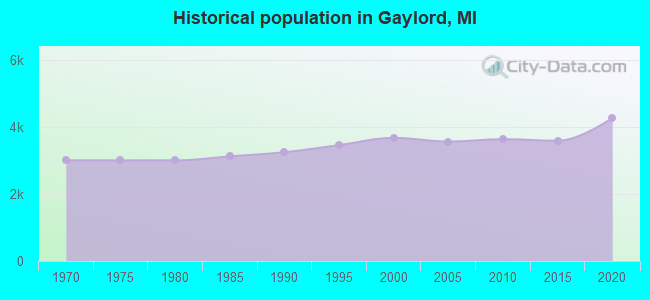
Population change in the 1990s: +278 (+8.2%).
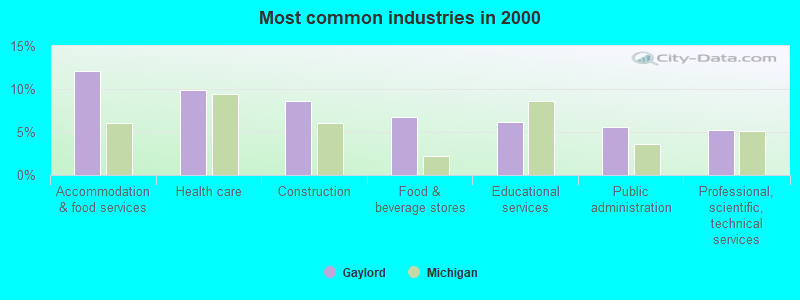
- Accommodation & food services (12.0%)
- Health care (9.8%)
- Construction (8.6%)
- Food & beverage stores (6.8%)
- Educational services (6.2%)
- Public administration (5.6%)
- Professional, scientific, technical services (5.2%)
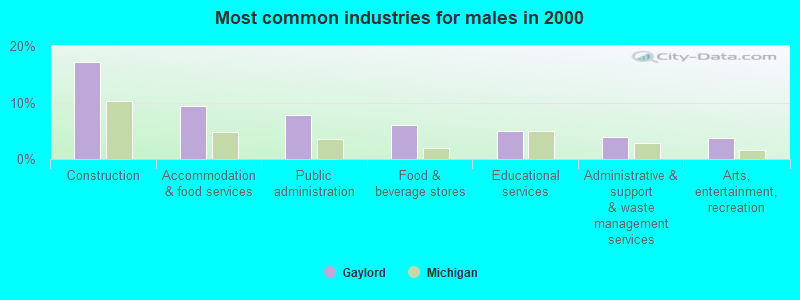
- Construction (17.2%)
- Accommodation & food services (9.4%)
- Public administration (7.8%)
- Food & beverage stores (5.9%)
- Educational services (4.9%)
- Administrative & support & waste management services (3.9%)
- Arts, entertainment, recreation (3.8%)
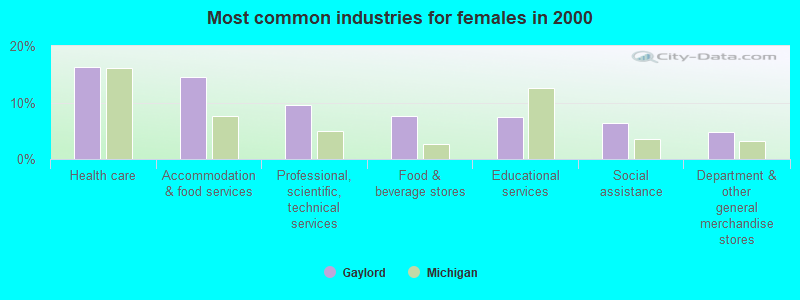
- Health care (16.4%)
- Accommodation & food services (14.6%)
- Professional, scientific, technical services (9.6%)
- Food & beverage stores (7.6%)
- Educational services (7.3%)
- Social assistance (6.4%)
- Department & other general merchandise stores (4.7%)
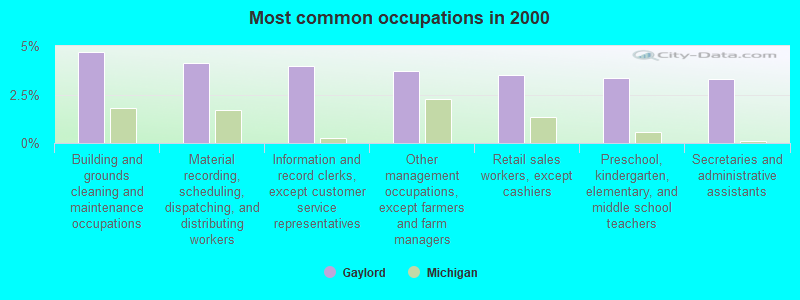
- Building and grounds cleaning and maintenance occupations (4.7%)
- Material recording, scheduling, dispatching, and distributing workers (4.1%)
- Information and record clerks, except customer service representatives (4.0%)
- Other management occupations, except farmers and farm managers (3.7%)
- Retail sales workers, except cashiers (3.5%)
- Preschool, kindergarten, elementary, and middle school teachers (3.4%)
- Secretaries and administrative assistants (3.3%)
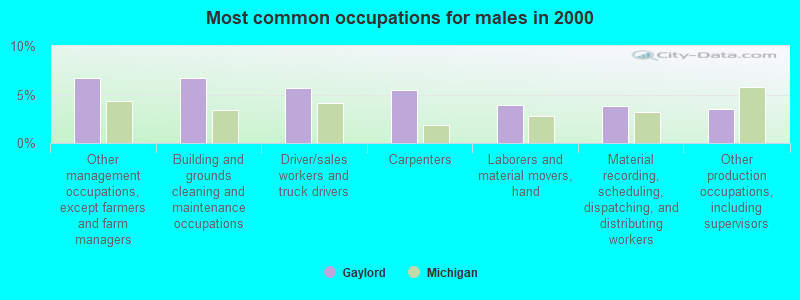
- Other management occupations, except farmers and farm managers (6.7%)
- Building and grounds cleaning and maintenance occupations (6.7%)
- Driver/sales workers and truck drivers (5.7%)
- Carpenters (5.4%)
- Laborers and material movers, hand (3.9%)
- Material recording, scheduling, dispatching, and distributing workers (3.8%)
- Other production occupations, including supervisors (3.5%)
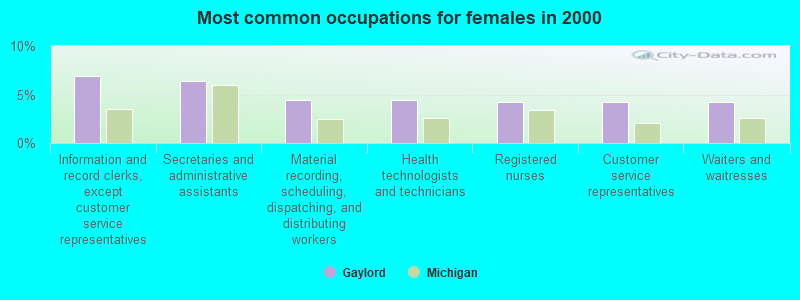
- Information and record clerks, except customer service representatives (6.9%)
- Secretaries and administrative assistants (6.4%)
- Material recording, scheduling, dispatching, and distributing workers (4.4%)
- Health technologists and technicians (4.4%)
- Registered nurses (4.3%)
- Customer service representatives (4.3%)
- Waiters and waitresses (4.3%)
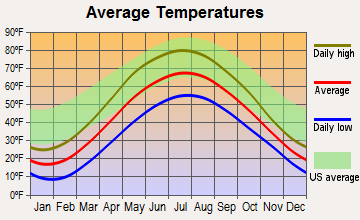
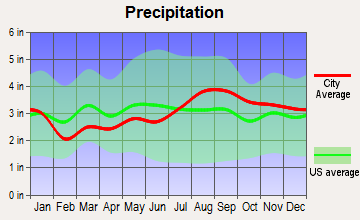
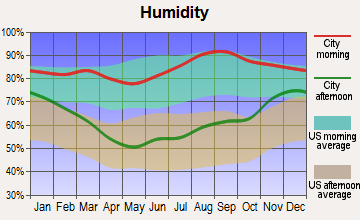
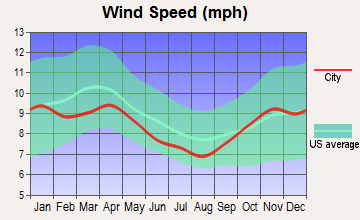
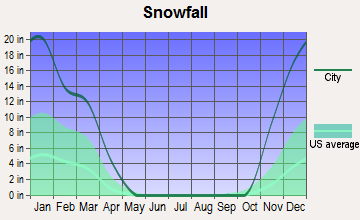
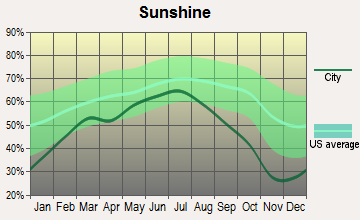
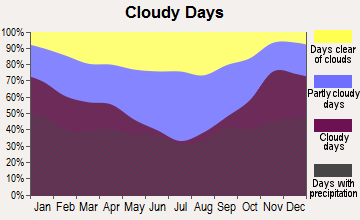
Average climate in Gaylord, Michigan
Based on data reported by over 4,000 weather stations
|
|

Tornado activity:
Gaylord-area historical tornado activity is significantly below Michigan state average. It is 63% smaller than the overall U.S. average.
On 7/3/1974, a category F3 (max. wind speeds 158-206 mph) tornado 6.3 miles away from the Gaylord city center injured 2 people and caused between $50,000 and $500,000 in damages.
On 4/3/1956, a category F4 (max. wind speeds 207-260 mph) tornado 45.3 miles away from the city center killed 2 people and injured 24 people and caused between $50,000 and $500,000 in damages.
Earthquake activity:
Gaylord-area historical earthquake activity is near Michigan state average. It is 90% smaller than the overall U.S. average.On 9/25/1998 at 19:52:52, a magnitude 5.2 (4.8 MB, 4.3 MS, 5.2 LG, 4.5 MW, Depth: 3.1 mi, Class: Moderate, Intensity: VI - VII) earthquake occurred 325.8 miles away from Gaylord center
On 1/31/1986 at 16:46:43, a magnitude 5.0 (5.0 MB) earthquake occurred 295.5 miles away from Gaylord center
On 5/2/2015 at 16:23:07, a magnitude 4.2 (4.2 MW, Depth: 2.8 mi, Class: Light, Intensity: IV - V) earthquake occurred 196.5 miles away from the city center
On 7/12/1986 at 08:19:37, a magnitude 4.5 (4.5 MB) earthquake occurred 310.8 miles away from the city center
On 9/2/1994 at 21:23:06, a magnitude 3.5 (3.4 LG, 3.5 LG, Depth: 3.1 mi, Class: Light, Intensity: II - III) earthquake occurred 154.1 miles away from the city center
On 6/10/2019 at 14:50:45, a magnitude 4.0 (4.0 MB, Depth: 1.2 mi) earthquake occurred 282.4 miles away from the city center
Magnitude types: regional Lg-wave magnitude (LG), body-wave magnitude (MB), surface-wave magnitude (MS), moment magnitude (MW)
Natural disasters:
The number of natural disasters in Otsego County (5) is a lot smaller than the US average (15).Emergencies Declared: 4
Causes of natural disasters: Blizzard: 1, Drought: 1, Hurricane: 1, Snowstorm: 1, Winter Storm: 1, Other: 1 (Note: some incidents may be assigned to more than one category).
Hospitals and medical centers in Gaylord:
Airports located in Gaylord:
- Gaylord Regional Airport (GLR) (Runways: 2, Itinerant Ops: 8,000, Local Ops: 2,000)
- Lakes Of The North Airport (4Y4) (Runways: 1, Itinerant Ops: 1,000, Local Ops: 1,000)
Colleges/universities with over 2000 students nearest to Gaylord:
- Northwestern Michigan College (about 48 miles; Traverse City, MI; Full-time enrollment: 3,276)
- Mid Michigan Community College (about 74 miles; Harrison, MI; FT enrollment: 3,653)
- Northwood University-Michigan (about 99 miles; Midland, MI; FT enrollment: 2,763)
- Central Michigan University (about 100 miles; Mount Pleasant, MI; FT enrollment: 22,758)
- Ferris State University (about 101 miles; Big Rapids, MI; FT enrollment: 11,238)
- Lake Superior State University (about 103 miles; Sault Ste Marie, MI; FT enrollment: 2,242)
- Delta College (about 107 miles; University Center, MI; FT enrollment: 7,480)
Public high schools in Gaylord:
- GAYLORD HIGH SCHOOL/VOC. BLDG. (Students: 1,131, Location: 90 LIVINGSTON BLVD, Grades: 7-12)
- GAYLORD VIRTUAL INSTRUCTION PROGRAM (Location: 615 S ELM AVE, Grades: 6-12)
Private high schools in Gaylord:
- ST MARY CATHEDRAL SCHOOL (Students: 319, Location: 321 N OTSEGO AVE, Grades: PK-12)
- OTSEGO CHRISTIAN SCHOOL (Students: 125, Location: 1377 E M 32, Grades: PK-12)
Public elementary/middle schools in Gaylord:
- GAYLORD INTERMEDIATE SCHOOL (Students: 726, Location: 240 EAST 4TH ST, Grades: 3-6)
- GAYLORD MIDDLE SCHOOL (Students: 499, Location: 600 EAST 5TH ST, Grades: 6-8)
- SOUTH MAPLE ELEMENTARY SCHOOL (Students: 473, Location: 650 EAST 5TH ST, Grades: PK-3)
- NORTH OHIO ELEMENTARY SCHOOL (Students: 462, Location: 912 NORTH OHIO AVE, Grades: PK-3)
Points of interest:
Notable locations in Gaylord: Gaylord Station (A), Otsego Club's The Classic Course (B), Edelweiss Shopping Plaza (C), Otsego County Fairgrounds (D), Hidden Valley Club (E), Alpine Court Cabins (F), Sky Crest Cabins (G), Otsego County Fire Department (H), Otsego County Library (I), Otsego County Sheriff's Office (J), Gaylord Police Department (K), Otsego County Historical Society Museum (L), Otsego County-City Building (M). Display/hide their locations on the map
Shopping Centers: Pineridge Plaza Shopping Center (1), Alpine Plaza Shopping Center (2), Plaza Shopping Center (3). Display/hide their locations on the map
Churches in Gaylord include: Gaylord Family Fellowship Church (A), Our Savior Evangelical Church (B), Gaylord Seventh Day Adventist Church (C), Calvary Baptist Church (D), First Congregational Church (E), Church of Christ (F), Trinity Lutheran Church (G), Community of Christ Church (H), First United Methodist Church (I). Display/hide their locations on the map
Cemeteries: Fairview Cemetery (1), Saint Marys Cemetery (2), Bagley Cemetery (3). Display/hide their locations on the map
Parks in Gaylord include: Freel Park (1), Hale Park (2), Doumas Park (3), Aspen Park (4), First Congregational Church Historical Marker (5), Otsego County Historical Marker (6), Frank and Rae Kramer House Historical Marker (7), Saint Mary's Catholic Church Historical Marker (8). Display/hide their locations on the map
Tourist attractions: Hicks Apartments (Cultural Attractions- Events- & Facilities; 4977 Sparr Rd), Chamber of Commerce Gaylord Otsego County - Administrative Offices (101 West Main Street), Jimmy Jukebox Family Center (610 South Wisconsin Avenue).
Hotels: Hampton Inn (230 Dickerson Road), Days Inn Of Gaylord (1201 W. Main), Chippewa Hotel (26 Hayes Road), Hampton Inn Gaylord (230 Dickerson Road), Gaylord Inn (833 West Main St), Gaylord Travel Inn (1042 W. Main), Econo Lodge Gaylord (2880 South Otsego Avenue), Cedars Motel (701 North Center Avenue), Best Western Royal Crest (803 S Otsego Ave).
Courts: Otsego County - Motor Pool (1185 Van Tyle), Otsego County - Court System- Parole Probation (225 West Main Street), Otsego County - Court System- Domestic Scheduling (800 Livingston Boulevard), Otsego County - Court System- Tickets (800 Livingston Boulevard), Otsego County - Court System- Juvenile (800 Livingston Boulevard), Crawford County - Friend Of The Court- Grayling Office (225 West Main Street), Otsego County - Court System- Probate (800 Livingston Boulevard), Otsego County - Circuit Court 46th District- Probation Parole (209 West 1st), Otsego County - Court System- Circuit Scheduling (225 West Main Street).
Drinking water stations with addresses in Gaylord and their reported violations in the past:
THE LAKES AT LOON GOLF RESORT (Population served: 150, Groundwater):Past health violations:THE LOON GOLF RESORT (Population served: 150, Groundwater):Past monitoring violations:
- MCL, Monthly (TCR) - In JUL-2010, Contaminant: Coliform. Follow-up actions: St Public Notif issued (JUL-29-2010), St Tech Assistance Visit (JUL-30-2010), St Public Notif received (JUL-30-2010), St Compliance achieved (AUG-03-2010)
- One routine major monitoring violation
- One minor monitoring violation
Past health violations:JOHNSON OIL (Population served: 125, Groundwater):
- MCL, Monthly (TCR) - In SEP-2010, Contaminant: Coliform. Follow-up actions: St Compliance achieved (SEP-23-2010), St Tech Assistance Visit (SEP-23-2010), St Public Notif requested (SEP-24-2010), St Public Notif issued (SEP-24-2010)
- MCL, Monthly (TCR) - In SEP-2009, Contaminant: Coliform. Follow-up actions: St Public Notif issued (OCT-01-2009), St Unresolved (OCT-23-2009), St Compliance achieved (MAR-23-2010)
Past monitoring violations:THE NATURAL (Population served: 100, Groundwater):
- One routine major monitoring violation
- One regular monitoring violation
Past health violations:WILDERNESS VALLEY (Population served: 100, Groundwater):Past monitoring violations:
- MCL, Monthly (TCR) - In MAY-2006, Contaminant: Coliform. Follow-up actions: St Public Notif received (MAY-11-2006), St Public Notif issued (MAY-11-2006), St Compliance achieved (MAY-15-2006)
- One routine major monitoring violation
- One regular monitoring violation
Past health violations:MONTMORENCY MEDICAL CENTER (Population served: 60, Groundwater):Past monitoring violations:
- MCL, Monthly (TCR) - In JUL-2007, Contaminant: Coliform. Follow-up actions: St Tech Assistance Visit (JUL-12-2007), St Public Notif requested (JUL-12-2007), St Public Notif received (JUL-16-2007), St Compliance achieved (JUL-17-2007)
- One routine major monitoring violation
- One regular monitoring violation
Past monitoring violations:MDOT - LAKE MICHIGAN SHORES,P315 (Population served: 50, Groundwater):
- One routine major monitoring violation
Past monitoring violations:MARSH RIDGE BERGEN (Population served: 45, Groundwater):
- 2 regular monitoring violations
Past health violations:
- MCL, Monthly (TCR) - In AUG-2008, Contaminant: Coliform. Follow-up actions: St Public Notif issued (AUG-15-2008), St Violation/Reminder Notice (AUG-15-2008), St Public Notif received (AUG-17-2008), St Compliance achieved (AUG-25-2008)
- MCL, Monthly (TCR) - In SEP-2007, Contaminant: Coliform. Follow-up actions: St Violation/Reminder Notice (SEP-10-2007), St Public Notif received (SEP-10-2007), St Tech Assistance Visit (SEP-12-2007), St Compliance achieved (SEP-17-2007)
Drinking water stations with addresses in Gaylord that have no violations reported:
- GAYLORD, CITY OF (Population served: 3,681, Primary Water Source Type: Groundwater)
- MICHAYWE PRO SHOP/GRILLE (Population served: 150, Primary Water Source Type: Groundwater)
- KINGDOM HALL OF JEHOVAHS (Population served: 150, Primary Water Source Type: Groundwater)
- BEAVER CREEK RESORT (Population served: 84, Primary Water Source Type: Groundwater)
- MICHAYWE INN THE WOODS (Population served: 80, Primary Water Source Type: Groundwater)
- MOUNT HOPE CHURCH (Population served: 70, Primary Water Source Type: Groundwater)
- LAKE ARROWHEAD PROPERTY OWNERS (Population served: 55, Primary Water Source Type: Groundwater)
- STONY HILL MARKET (Population served: 50, Primary Water Source Type: Groundwater)
- OMH BOYNE VALLEY CLINIC (Population served: 50, Primary Water Source Type: Groundwater)
- FAIRWAY LAKE CONDOMINIUMS (Population served: 46, Primary Water Source Type: Groundwater)
| This city: | 2.1 people |
| Michigan: | 2.5 people |
| This city: | 51.3% |
| Whole state: | 66.0% |
| This city: | 6.8% |
| Whole state: | 6.4% |
Likely homosexual households (counted as self-reported same-sex unmarried-partner households)
- Lesbian couples: 0.1% of all households
- Gay men: 0.1% of all households
People in group quarters in Gaylord in 2010:
- 100 people in nursing facilities/skilled-nursing facilities
- 33 people in local jails and other municipal confinement facilities
- 29 people in mental (psychiatric) hospitals and psychiatric units in other hospitals
- 29 people in college/university student housing
- 4 people in group homes intended for adults
People in group quarters in Gaylord in 2000:
- 86 people in nursing homes
- 40 people in other group homes
- 36 people in local jails and other confinement facilities (including police lockups)
- 4 people in homes for the mentally retarded
Banks with branches in Gaylord (2011 data):
- Fifth Third Bank: Gaylord Drive Thru at 2005 South Old U.S. 27, branch established on 1974/10/07; Gaylord Main Office Branch at 123 West Main Street, branch established on 1893/03/04. Info updated 2009/10/05: Bank assets: $114,540.4 mil, Deposits: $89,689.1 mil, headquarters in Cincinnati, OH, positive income, Commercial Lending Specialization, 1378 total offices, Holding Company: Fifth Third Bancorp
- Northwestern Bank: Gaylord Branch at 711 West Main Street, branch established on 1998/03/02; 2091 South Otsego Ave. Branch at 2091 South Otsego Ave., branch established on 2003/02/10. Info updated 2006/11/03: Bank assets: $867.7 mil, Deposits: $784.0 mil, headquarters in Traverse City, MI, positive income, Commercial Lending Specialization, 27 total offices
- Independent Bank: Aspen Park Branch at 1157 South Otsego, branch established on 1982/09/22; Gaylord Main at 521 West Main Street, branch established on 1975/07/01. Info updated 2010/10/20: Bank assets: $2,304.7 mil, Deposits: $2,092.2 mil, headquarters in Ionia, MI, negative income in the last year, Commercial Lending Specialization, 107 total offices, Holding Company: Independent Bank Corporation
- Citizens Bank: Gaylord Downtown at 100 East Main Street, branch established on 1995/02/13. Info updated 2011/08/01: Bank assets: $9,212.3 mil, Deposits: $7,452.0 mil, headquarters in Flint, MI, positive income, Commercial Lending Specialization, 220 total offices, Holding Company: Citizens Republic Bancorp, Inc.
- First Federal of Northern Michigan: Gaylord Branch at 1000 S Wisconsin Ave, branch established on 2001/06/04. Info updated 2011/07/21: Bank assets: $216.9 mil, Deposits: $151.7 mil, headquarters in Alpena, MI, positive income, Commercial Lending Specialization, 8 total offices
- mBank: Gaylord Branch at 1955 South Otsego Avenue, branch established on 1998/04/03. Info updated 2006/11/03: Bank assets: $498.3 mil, Deposits: $410.0 mil, headquarters in Manistique, MI, positive income, Commercial Lending Specialization, 12 total offices, Holding Company: Mackinac Financial Corporation
For population 15 years and over in Gaylord:
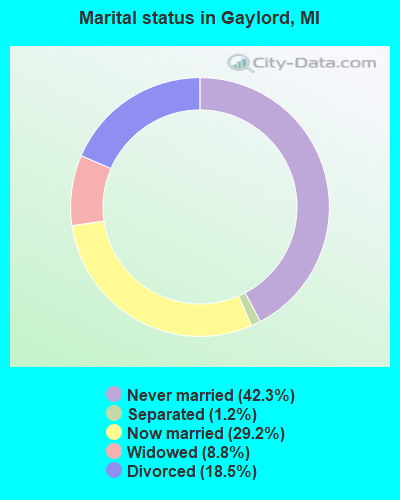
- Never married: 42.3%
- Now married: 29.2%
- Separated: 1.2%
- Widowed: 8.8%
- Divorced: 18.5%
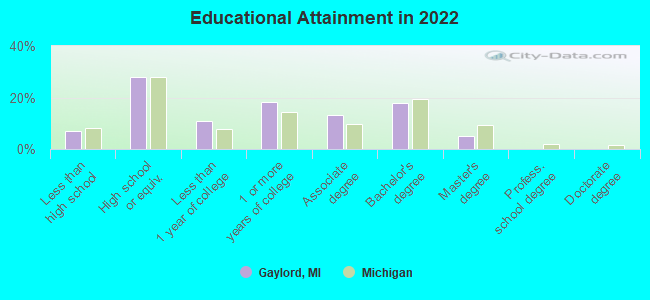
For population 25 years and over in Gaylord:
- High school or higher: 92.4%
- Bachelor's degree or higher: 21.9%
- Graduate or professional degree: 4.8%
- Unemployed: 7.0%
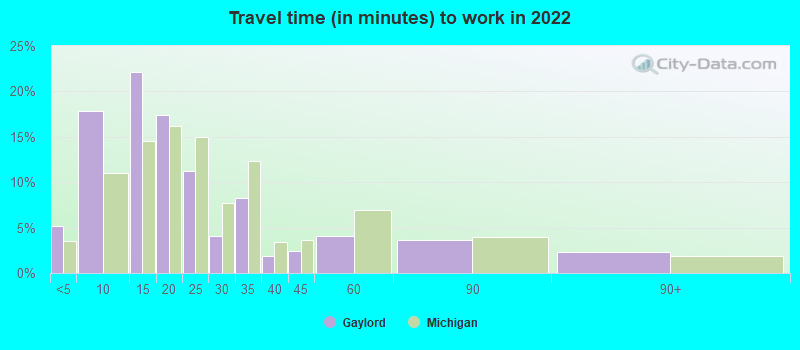
- Mean travel time to work (commute): 11.4 minutes
| Here: | 8.3 |
| Michigan average: | 11.0 |
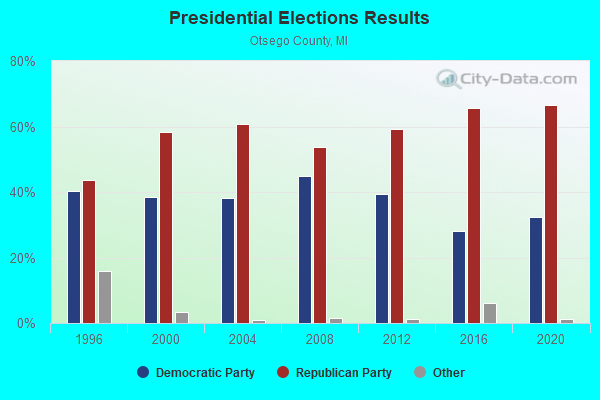
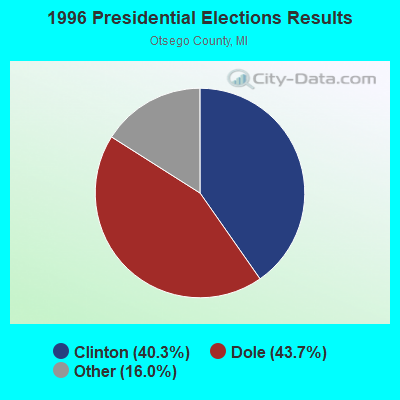
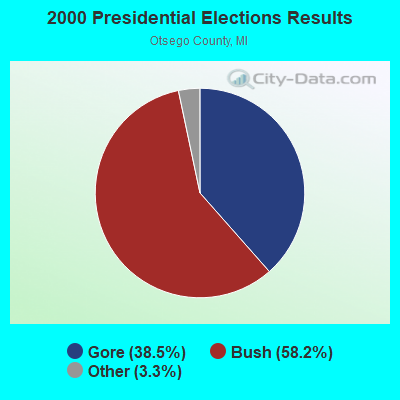
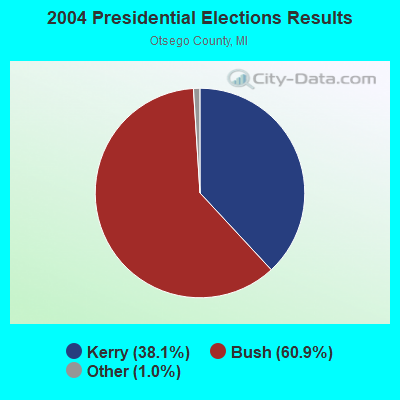
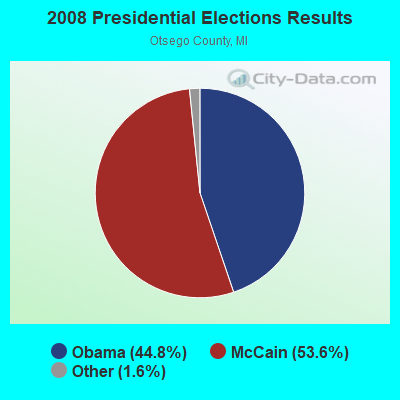
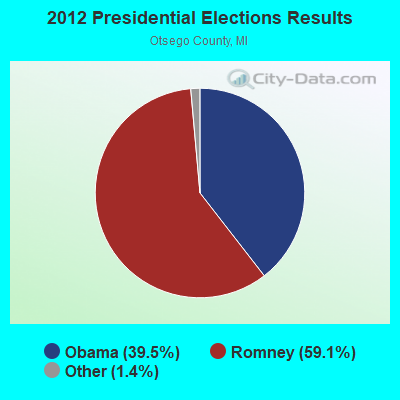
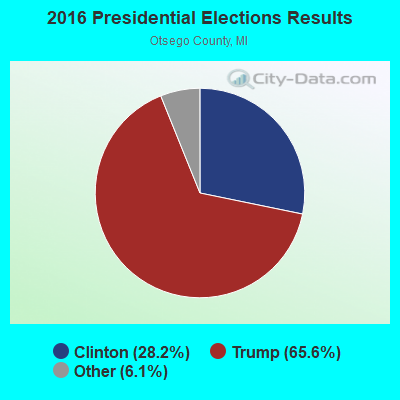
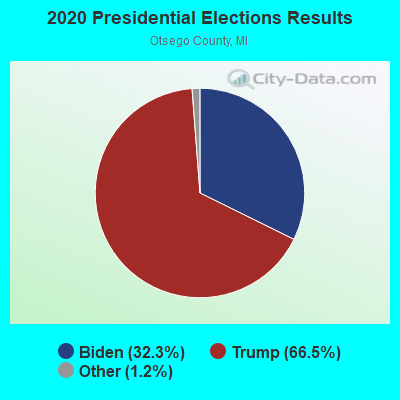
Graphs represent county-level data. Detailed 2008 Election Results
Religion statistics for Gaylord, MI (based on Otsego County data)
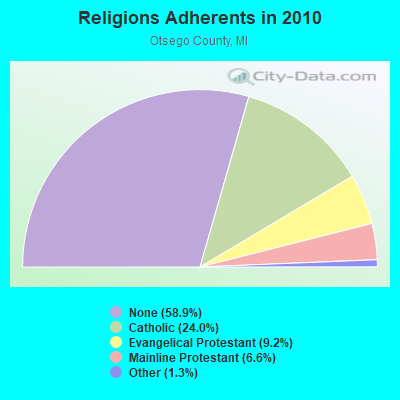

| Religion | Adherents | Congregations |
|---|---|---|
| Catholic | 5,800 | 2 |
| Evangelical Protestant | 2,224 | 17 |
| Mainline Protestant | 1,603 | 5 |
| Other | 305 | 5 |
| None | 14,232 | - |
Food Environment Statistics:
| Otsego County: | 2.48 / 10,000 pop. |
| Michigan: | 2.34 / 10,000 pop. |
| This county: | 1.66 / 10,000 pop. |
| Michigan: | 1.52 / 10,000 pop. |
| Otsego County: | 9.11 / 10,000 pop. |
| State: | 2.99 / 10,000 pop. |
| This county: | 11.59 / 10,000 pop. |
| Michigan: | 6.80 / 10,000 pop. |
| Otsego County: | 9.1% |
| Michigan: | 9.7% |
| Otsego County: | 29.5% |
| State: | 29.7% |
| This county: | 10.7% |
| Michigan: | 13.4% |
Health and Nutrition:
| Gaylord: | 49.8% |
| State: | 50.3% |
| Here: | 46.4% |
| Michigan: | 47.9% |
| Here: | 28.4 |
| State: | 28.7 |
| Gaylord: | 18.9% |
| Michigan: | 20.6% |
| Gaylord: | 9.6% |
| State: | 10.4% |
| Gaylord: | 6.8 |
| Michigan: | 6.8 |
| Gaylord: | 35.0% |
| State: | 34.1% |
| Gaylord: | 55.8% |
| Michigan: | 57.0% |
| This city: | 77.5% |
| Michigan: | 79.6% |
More about Health and Nutrition of Gaylord, MI Residents
| Local government employment and payroll (March 2022) | |||||
| Function | Full-time employees | Monthly full-time payroll | Average yearly full-time wage | Part-time employees | Monthly part-time payroll |
|---|---|---|---|---|---|
| Police Protection - Officers | 12 | $71,938 | $71,938 | 0 | $0 |
| Streets and Highways | 9 | $47,510 | $63,347 | 0 | $0 |
| Sewerage | 5 | $24,982 | $59,957 | 0 | $0 |
| Other Government Administration | 4 | $21,246 | $63,738 | 17 | $11,330 |
| Water Supply | 2 | $9,628 | $57,768 | 0 | $0 |
| Financial Administration | 2 | $10,179 | $61,074 | 0 | $0 |
| Police - Other | 1 | $3,370 | $40,440 | 0 | $0 |
| Totals for Government | 35 | $188,852 | $64,749 | 17 | $11,330 |
Gaylord government finances - Expenditure in 2017 (per resident):
- Current Operations - Sewerage: $2,645,000 ($607.21)
Regular Highways: $1,243,000 ($285.35)
Police Protection: $1,195,000 ($274.33)
General - Other: $700,000 ($160.70)
Parks and Recreation: $265,000 ($60.84)
Central Staff Services: $158,000 ($36.27)
Financial Administration: $106,000 ($24.33)
General Public Buildings: $45,000 ($10.33)
Judicial and Legal Services: $26,000 ($5.97)
- General - Interest on Debt: $306,000 ($70.25)
- Intergovernmental to Local - Other - Local Fire Protection: $63,000 ($14.46)
- Other Capital Outlay - Regular Highways: $1,429,000 ($328.05)
Sewerage: $46,000 ($10.56)
Water Utilities: $22,000 ($5.05)
- Total Salaries and Wages: $1,734,000 ($398.07)
Gaylord government finances - Revenue in 2017 (per resident):
- Charges - Sewerage: $1,544,000 ($354.45)
Other: $62,000 ($14.23)
- Local Intergovernmental - Other: $539,000 ($123.74)
- Miscellaneous - Donations From Private Sources: $207,000 ($47.52)
General Revenue - Other: $179,000 ($41.09)
Special Assessments: $59,000 ($13.54)
Interest Earnings: $7,000 ($1.61)
- Revenue - Water Utilities: $683,000 ($156.80)
- State Intergovernmental - Highways: $509,000 ($116.85)
General Local Government Support: $495,000 ($113.64)
Other: $309,000 ($70.94)
- Tax - Property: $4,009,000 ($920.34)
Gaylord government finances - Debt in 2017 (per resident):
- Long Term Debt - Beginning Outstanding - Unspecified Public Purpose: $7,653,000 ($1756.89)
Outstanding Unspecified Public Purpose: $6,784,000 ($1557.39)
Retired Unspecified Public Purpose: $868,000 ($199.27)
Gaylord government finances - Cash and Securities in 2017 (per resident):
- Other Funds - Cash and Securities: $4,090,000 ($938.93)
| Businesses in Gaylord, MI | ||||
| Name | Count | Name | Count | |
|---|---|---|---|---|
| 7-Eleven | 1 | Kohl's | 1 | |
| AT&T | 1 | La-Z-Boy | 1 | |
| Ace Hardware | 1 | Little Caesars Pizza | 1 | |
| Advance Auto Parts | 1 | Lowe's | 1 | |
| Applebee's | 1 | MasterBrand Cabinets | 5 | |
| Arby's | 1 | Maurices | 1 | |
| AutoZone | 1 | McDonald's | 1 | |
| Bath & Body Works | 1 | Meijer | 1 | |
| Baymont Inn | 1 | New Balance | 1 | |
| Burger King | 2 | Nike | 5 | |
| Chevrolet | 1 | OfficeMax | 1 | |
| Cold Stone Creamery | 1 | Payless | 1 | |
| Dairy Queen | 1 | Penske | 1 | |
| DressBarn | 1 | Quality | 1 | |
| Dressbarn | 1 | RadioShack | 1 | |
| Econo Lodge | 1 | Rite Aid | 1 | |
| FedEx | 6 | Ruby Tuesday | 1 | |
| Ford | 1 | SAS Shoes | 1 | |
| GNC | 1 | Sears | 1 | |
| GameStop | 1 | Starbucks | 1 | |
| H&R Block | 1 | Taco Bell | 1 | |
| Hilton | 1 | Tim Hortons | 1 | |
| Hobby Lobby | 1 | U-Haul | 2 | |
| Holiday Inn | 1 | UPS | 9 | |
| Home Depot | 1 | Verizon Wireless | 1 | |
| Jones New York | 1 | Walgreens | 1 | |
| KFC | 1 | Walmart | 1 | |
| Kincaid | 1 | Wendy's | 1 | |
| Kmart | 1 | |||
Strongest AM radio stations in Gaylord:
- WTCM (580 AM; 35 kW; TRAVERSE CITY, MI; Owner: WTCM RADIO, INC.)
- WJML (1110 AM; 10 kW; PETOSKEY, MI)
- WLDR (1210 AM; daytime; 50 kW; KINGSLEY, MI; Owner: FORT BEND BROADCASTING COMPANY)
- WCCW (1310 AM; 15 kW; TRAVERSE CITY, MI; Owner: WCCW RADIO, INC.)
- WMKT (1270 AM; 5 kW; CHARLEVOIX, MI; Owner: MACDONALD GARBER BROADCASTING, INC)
- WHAK (960 AM; 5 kW; ROGERS CITY, MI)
- WOAP (1080 AM; 50 kW; OWOSSO, MI)
- WWKK (750 AM; 1 kW; PETOSKEY, MI; Owner: STONE COMMUNICATIONS, INC.)
- WIDG (940 AM; 5 kW; ST. IGNACE, MI; Owner: NORTHERN STAR BROADCASTING, L.L.C.)
- WJR (760 AM; 50 kW; DETROIT, MI; Owner: ABC, INC.)
- WTMJ (620 AM; 50 kW; MILWAUKEE, WI; Owner: JOURNAL BROADCAST CORPORATION)
- WWJ (950 AM; 50 kW; DETROIT, MI; Owner: INFINITY BROADCASTING OPERATIONS, INC.)
- WFDF (910 AM; 50 kW; FLINT, MI; Owner: ABC, INC.)
Strongest FM radio stations in Gaylord:
- WMJZ-FM (95.3 FM; GAYLORD, MI; Owner: DARBY ADVERTISING, INC.)
- WKPK (106.7 FM; GAYLORD, MI; Owner: NORTHERN RADIO OF GAYLORD, INC.)
- WTLI (89.3 FM; BEAR CREEK TOWNSHIP, MI; Owner: SUPERIOR COMMUNICATIONS)
- WBLW (88.1 FM; GAYLORD, MI; Owner: GRACE BAPTIST CHURCH)
- WFDX (92.5 FM; ATLANTA, MI; Owner: NORTHERN MICHIGAN RADIO, INC.)
- WKHQ-FM (105.9 FM; CHARLEVOIX, MI; Owner: MACDONALD GARBER BROADCASTING, INC)
- WLXT (96.3 FM; PETOSKEY, MI; Owner: MACDONALD GARBER BROADCASTING, INC)
- WCML-FM (91.7 FM; ALPENA, MI; Owner: CENTRAL MICHIGAN UNIVERSITY)
- WBCM (93.5 FM; BOYNE CITY, MI; Owner: WBCM RADIO, INC.)
- WPHN (90.5 FM; GAYLORD, MI; Owner: NORTHERN CHRISTIAN RADIO, INC.)
- WKLZ-FM (98.9 FM; PETOSKEY, MI; Owner: NORTHERN RADIO OF PETOSKEY, INC.)
- WMKC (102.9 FM; ST. IGNACE, MI; Owner: NORTHERN STAR BROADCASTING, L.L.C.)
- WCMW-FM (103.9 FM; HARBOR SPRINGS, MI; Owner: CENTRAL MICHIGAN UNIVERSITY)
- WICV (100.9 FM; EAST JORDAN, MI; Owner: INTERLOCHEN CENTER FOR THE ARTS)
- WJZQ (92.9 FM; CADILLAC, MI; Owner: WKJF RADIO, INC.)
- WGFM (105.1 FM; CHEBOYGAN, MI; Owner: NORTHERN STAR BROADCASTING, L.L.C.)
- WKLT (97.5 FM; KALKASKA, MI; Owner: NORTHERN RADIO OF MICHIGAN, INC.)
- WAVC (93.9 FM; MIO, MI; Owner: NORTHERN STAR BROADCASTING, L.L.C.)
- WGRY-FM (100.3 FM; GRAYLING, MI; Owner: GANNON BROADCASTING SYSTEM'S, INC.)
TV broadcast stations around Gaylord:
- WFUP (Channel 45; VANDERBILT, MI; Owner: ROCKFLEET BROADCASTING II, LLC)
- WCML (Channel 6; ALPENA, MI; Owner: CENTRAL MICHIGAN UNIVERSITY)
- WGTU (Channel 29; TRAVERSE CITY, MI; Owner: SCANLAN COMMUNICATIONS, INC.)
- WCMV (Channel 27; CADILLAC, MI; Owner: CENTRAL MICHIGAN UNIVERSITY)
- W55CL (Channel 55; PETOSKEY, MI; Owner: MS COMMUNICATIONS, LLC)
- W34CR (Channel 34; PETOSKEY, MI; Owner: FRANK J. CATZ, LIVING TRUST)
- W41CK (Channel 41; PETOSKEY, MI; Owner: FRANK J. CATZ, LIVING TRUST)
- W39CB (Channel 39; PETOSKEY, MI; Owner: MS COMMUNICATIONS, LLC)
- W62CR (Channel 62; PETOSKEY, MI; Owner: MS COMMUNICATIONS, LLC)
- W36CD (Channel 36; PETOSKEY, MI; Owner: MS COMMUNICATIONS, LLC)
- W66CY (Channel 66; PETOSKEY, MI; Owner: MS COMMUNICATIONS, LLC)
- National Bridge Inventory (NBI) Statistics
- 21Number of bridges
- 161ft / 49.4mTotal length
- 141,518Total average daily traffic
- 9,521Total average daily truck traffic
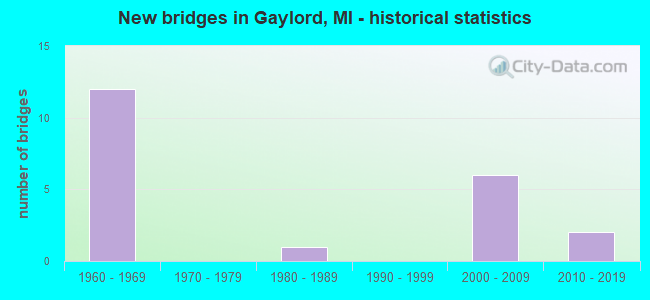
- New bridges - historical statistics
- 121960-1969
- 11980-1989
- 62000-2009
- 22010-2019
FCC Registered Antenna Towers: 219 (See the full list of FCC Registered Antenna Towers)
FCC Registered Commercial Land Mobile Towers: 1 (See the full list of FCC Registered Commercial Land Mobile Towers in Gaylord, MI)
FCC Registered Private Land Mobile Towers: 3 (See the full list of FCC Registered Private Land Mobile Towers)
FCC Registered Broadcast Land Mobile Towers: 19 (See the full list of FCC Registered Broadcast Land Mobile Towers)
FCC Registered Microwave Towers: 29 (See the full list of FCC Registered Microwave Towers in this town)
FCC Registered Paging Towers: 2 (See the full list of FCC Registered Paging Towers)
FCC Registered Maritime Coast & Aviation Ground Towers: 2 (See the full list of FCC Registered Maritime Coast & Aviation Ground Towers)
FCC Registered Amateur Radio Licenses: 193 (See the full list of FCC Registered Amateur Radio Licenses in Gaylord)
FAA Registered Aircraft: 34 (See the full list of FAA Registered Aircraft in Gaylord)
2002 - 2018 National Fire Incident Reporting System (NFIRS) incidents
- Fire incident types reported to NFIRS in Gaylord, MI
- 51245.6%Structure Fires
- 37333.2%Outside Fires
- 21419.0%Mobile Property/Vehicle Fires
- 252.2%Other
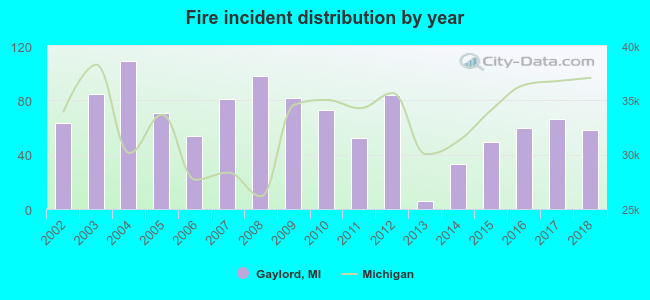 Based on the data from the years 2002 - 2018 the average number of fire incidents per year is 66. The highest number of reported fires - 109 took place in 2004, and the least - 6 in 2013. The data has a decreasing trend.
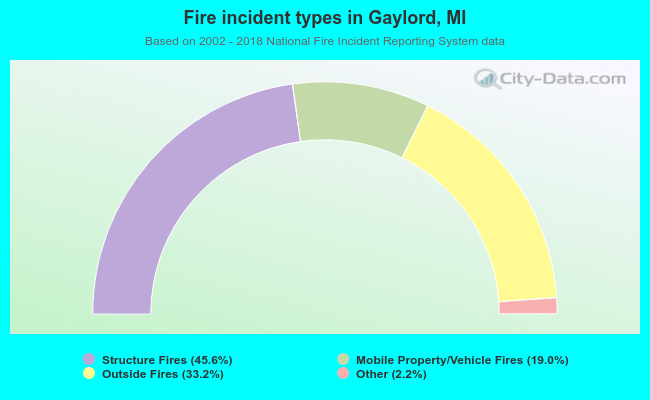 When looking into fire subcategories, the most incidents belonged to: Structure Fires (45.6%), and Outside Fires (33.2%).
Fire-safe hotels and motels in Gaylord, Michigan:
- Quality Inn, 137 West St, Gaylord, Michigan 49735 , Phone: (989) 732-7541, Fax: (989) 732-0930
- Best Western Alpine Lodge, 833 W Main St, Gaylord, Michigan 49735 , Phone: (989) 732-2431, Fax: (989) 732-9640
- Best Western Gaylord, 1201 W Main, Gaylord, Michigan 49735 , Phone: (989) 732-2200
- Treetops Resort, 3962 Wilkinson Rd, Gaylord, Michigan 49735 , Phone: (888) 873-3867, Fax: (989) 732-6595
- Baymont Inn & Suites, 510 S Wisconsin Ave, Gaylord, Michigan 49735 , Phone: (989) 731-6331, Fax: (989) 731-0190
- Royal Crest Lodge, 803 S Otsego Ave, Gaylord, Michigan 49735 , Phone: (989) 732-6451, Fax: (989) 732-7634
- Americas Best Value Inn, 2880 S Otsego Ave, Gaylord, Michigan 49735 , Phone: (989) 732-5133, Fax: (989) 732-4101
- Fairfield Inn and Suites, 826 Carpenter St, Gaylord, Michigan 49735 , Phone: (989) 448-2967, Fax: (989) 448-2968
- 2 other hotels and motels
| Most common first names in Gaylord, MI among deceased individuals | ||
| Name | Count | Lived (average) |
|---|---|---|
| John | 115 | 75.2 years |
| Mary | 96 | 78.3 years |
| William | 78 | 75.8 years |
| Robert | 77 | 69.8 years |
| Joseph | 65 | 76.7 years |
| Charles | 64 | 72.9 years |
| Frank | 59 | 77.3 years |
| Helen | 56 | 83.0 years |
| James | 56 | 68.8 years |
| George | 50 | 76.7 years |
| Most common last names in Gaylord, MI among deceased individuals | ||
| Last name | Count | Lived (average) |
|---|---|---|
| Smith | 37 | 76.4 years |
| Johnson | 32 | 77.3 years |
| Miller | 21 | 71.1 years |
| Borowiak | 21 | 77.9 years |
| Campbell | 18 | 80.7 years |
| Brown | 17 | 78.0 years |
| Koronka | 15 | 77.4 years |
| Fox | 14 | 78.8 years |
| Kucharek | 14 | 71.0 years |
| Robinson | 14 | 75.4 years |
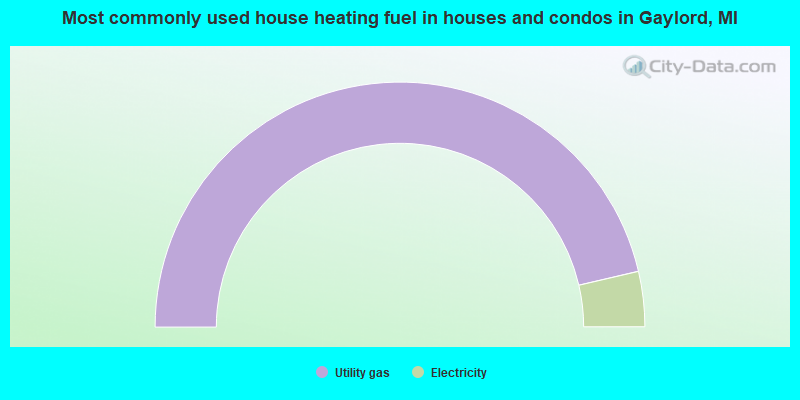
- 92.7%Utility gas
- 7.3%Electricity
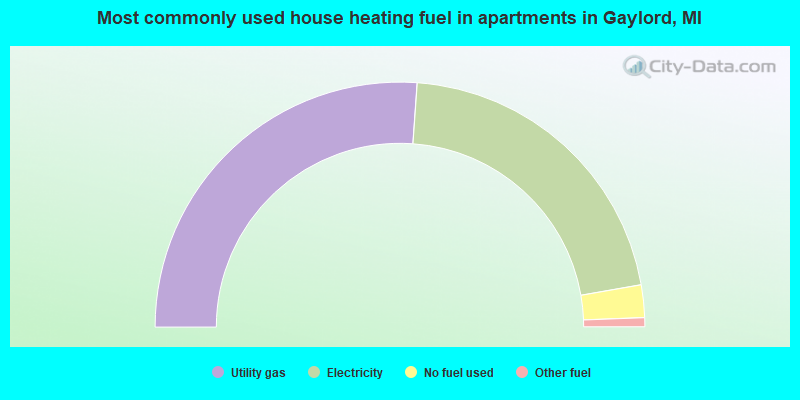
- 52.3%Utility gas
- 42.3%Electricity
- 4.3%No fuel used
- 1.2%Other fuel
Gaylord compared to Michigan state average:
- Median household income below state average.
- Unemployed percentage below state average.
- Black race population percentage significantly below state average.
- Foreign-born population percentage significantly below state average.
- Renting percentage above state average.
- Number of rooms per house below state average.
- Institutionalized population percentage above state average.
Gaylord on our top lists:
- #96 on the list of "Top 101 cities with the largest percentage of people in other group homes (population 1,000+)"

|
|
Total of 26 patent applications in 2008-2024.