Estimated zip code population in 2022: 43,892 Zip code population in 2010: 42,031 Zip code population in 2000: 38,681
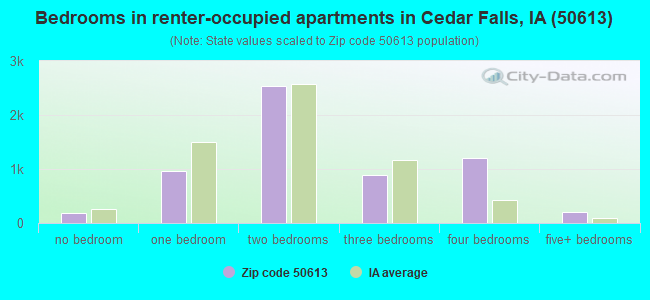
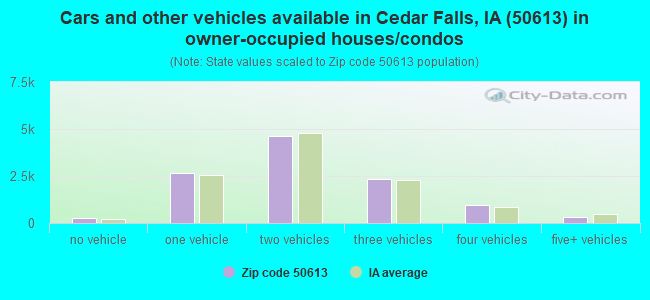
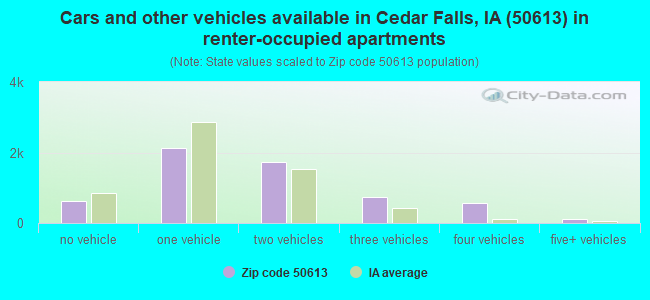
Houses and condos: 18,057 Renter-occupied apartments: 5,935
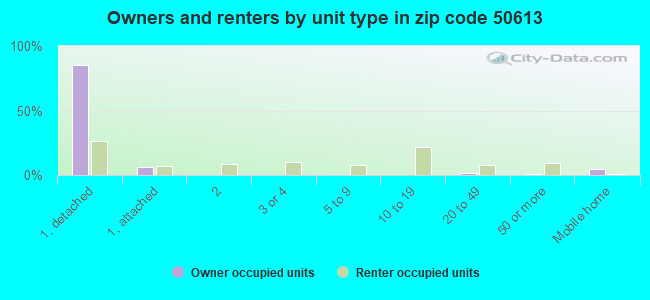
% of renters here:
35%
State:
28%
March 2022 cost of living index in zip code 50613: 86.4 (less than average, U.S. average is 100)
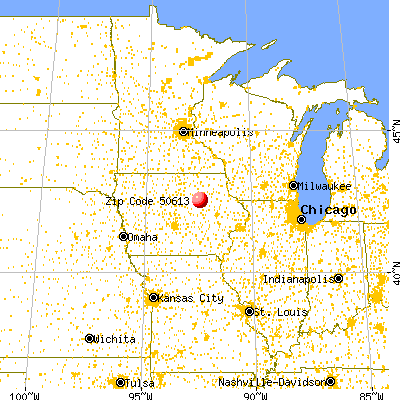
Land area: 125.8 sq. mi. Water area: 1.6 sq. mi.
Population density: 349 people per square mile
(very low).
OSM Map
General Map
Google Map
MSN Map
OSM Map
General Map
Google Map
MSN Map
OSM Map
General Map
Google Map
MSN Map
OSM Map
General Map
Google Map
MSN Map
Please wait while loading the map...
Real estate property taxes paid for housing units in 2022:
This zip code:
1.4% ($3,685)
Iowa:
1.4% ($2,724)
Median real estate property taxes paid for housing units with mortgages in 2022: $3,755 (1.4%) Median real estate property taxes paid for housing units with no mortgage in 2022: $3,587 (1.5%)
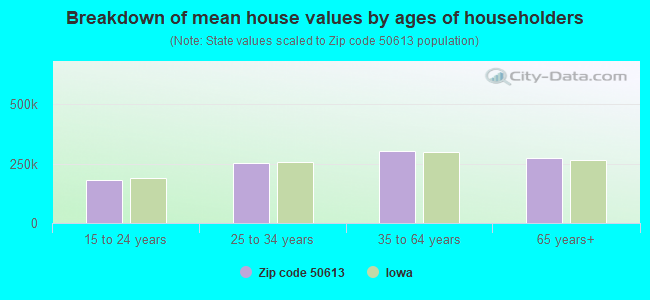
Estimated median house/condo value in 2022: $267,896
50613:
$267,896
Iowa:
$194,600
According to our research of Iowa and other state lists, there were 19 registered sex offenders living in 50613 zip code as of April 27, 2024. The ratio of all residents to sex offenders in zip code 50613 is 2,345 to 1. The ratio of registered sex offenders to all residents in this zip code is much lower than the state average.
Median resident age:
This zip code:
29.3 years
Iowa median age:
38.9 years
Average household size:
This zip code:
2.4 people
Iowa:
2.3 people
Averages for the 2020 tax year for zip code 50613, filed in 2021:
Average Adjusted Gross Income (AGI) in 2020: $88,007 (Individual Income Tax Returns)
Here:
$88,007
State:
$71,087
Salary/wage: $67,250 (reported on 81.5% of returns)
Here:
$67,250
State:
$57,361
(% of AGI for various income ranges: 1183.4% for AGIs below $25k, 3398.5% for AGIs $25k-50k, 6133.0% for AGIs $50k-75k, 8984.9% for AGIs $75k-100k, 16801.3% for AGIs $100k-200k, 77332.9% for AGIs over 200k)
Taxable interest for individuals: $2,121 (reported on 47.2% of returns)
This zip code:
$2,121
Iowa:
$1,633
(% of AGI for various income ranges: 23.9% for AGIs below $25k, 47.7% for AGIs $25k-50k, 91.8% for AGIs $50k-75k, 123.6% for AGIs $75k-100k, 229.6% for AGIs $100k-200k, 2142.6% for AGIs over 200k)
Ordinary dividends: $6,367 (reported on 29.3% of returns)
Here:
$6,367
State:
$5,432
(% of AGI for various income ranges: 31.7% for AGIs below $25k, 56.0% for AGIs $25k-50k, 147.3% for AGIs $50k-75k, 246.8% for AGIs $75k-100k, 472.6% for AGIs $100k-200k, 4206.3% for AGIs over 200k)
Net capital gain/loss in AGI: +$22,015 (reported on 26.0% of returns)
Here:
+$22,015
State:
+$15,243
(% of AGI for various income ranges: 11.3% for AGIs below $25k, 40.6% for AGIs $25k-50k, 135.5% for AGIs $50k-75k, 275.3% for AGIs $75k-100k, 661.6% for AGIs $100k-200k, 22057.9% for AGIs over 200k)
Profit/loss from business: +$16,406 (reported on 13.6% of returns)
Here:
+$16,406
State:
+$11,763
(% of AGI for various income ranges: 49.6% for AGIs below $25k, 115.3% for AGIs $25k-50k, 239.9% for AGIs $50k-75k, 335.1% for AGIs $75k-100k, 580.1% for AGIs $100k-200k, 4014.5% for AGIs over 200k)
Taxable individual retirement arrangement distribution: $20,953 (reported on 14.1% of returns)
50613:
$20,953
Iowa:
$17,324
(% of AGI for various income ranges: 73.2% for AGIs below $25k, 134.8% for AGIs $25k-50k, 333.8% for AGIs $50k-75k, 540.5% for AGIs $75k-100k, 1053.3% for AGIs $100k-200k, 3451.6% for AGIs over 200k)
Self-employed (Keogh) retirement plans: $22,842 (reported on 0.7% of returns)
50613:
$22,842
Iowa:
$22,144
(% of AGI for various income ranges: 13.7% for AGIs $50k-75k, 38.1% for AGIs $100k-200k, 455.0% for AGIs over 200k)
Total itemized deductions: $39,941 (reported on 9.6% of returns)
Here:
$39,941
State:
$33,775
(% of AGI for various income ranges: 62.3% for AGIs below $25k, 154.7% for AGIs $25k-50k, 367.8% for AGIs $50k-75k, 456.6% for AGIs $75k-100k, 879.2% for AGIs $100k-200k, 8624.5% for AGIs over 200k)
Charity contributions: $16,383 (reported on 7.9% of returns)
Here:
$16,383
State:
$13,075
(% of AGI for various income ranges: 4.0% for AGIs below $25k, 16.5% for AGIs $25k-50k, 61.3% for AGIs $50k-75k, 111.6% for AGIs $75k-100k, 262.5% for AGIs $100k-200k, 3976.6% for AGIs over 200k)
Taxes paid: $7,937 (reported on 9.5% of returns)
50613:
$7,937
State:
$7,704
(% of AGI for various income ranges: 6.9% for AGIs below $25k, 21.0% for AGIs $25k-50k, 84.6% for AGIs $50k-75k, 126.2% for AGIs $75k-100k, 247.8% for AGIs $100k-200k, 1260.8% for AGIs over 200k)
Earned income credit: $2,050 (reported on 8.0% of returns)
Here:
$2,050
State:
$2,195
(% of AGI for various income ranges: 48.9% for AGIs below $25k, 38.7% for AGIs $25k-50k, 1.1% for AGIs $50k-75k)
Percentage of individuals using paid preparers for their 2020 taxes: 94.9%
Here:
95%
State:
95%
(% for various income ranges: 94.1% for AGIs below $25k, 95.3% for AGIs $25k-50k, 94.9% for AGIs $50k-75k, 94.9% for AGIs $75k-100k, 95.3% for AGIs $100k-200k, 95.1% for AGIs over 200k)
Averages for the 2012 tax year for zip code 50613, filed in 2013:
Average Adjusted Gross Income (AGI) in 2012: $71,081 (Individual Income Tax Returns)
Here:
$71,081
State:
$58,860
Salary/wage: $56,281 (reported on 84.8% of returns)
Here:
$56,281
State:
$46,659
(% of AGI for various income ranges: 77.0% for AGIs below $25k, 75.5% for AGIs $25k-50k, 72.4% for AGIs $50k-75k, 72.1% for AGIs $75k-100k, 74.1% for AGIs $100k-200k, 50.8% for AGIs over 200k)
Taxable interest for individuals: $1,562 (reported on 53.5% of returns)
This zip code:
$1,562
Iowa:
$1,537
(% of AGI for various income ranges: 1.9% for AGIs below $25k, 1.2% for AGIs $25k-50k, 1.1% for AGIs $50k-75k, 1.1% for AGIs $75k-100k, 0.9% for AGIs $100k-200k, 1.4% for AGIs over 200k)
Ordinary dividends: $5,544 (reported on 29.7% of returns)
Here:
$5,544
State:
$4,542
(% of AGI for various income ranges: 2.0% for AGIs below $25k, 1.4% for AGIs $25k-50k, 1.8% for AGIs $50k-75k, 1.6% for AGIs $75k-100k, 2.0% for AGIs $100k-200k, 3.6% for AGIs over 200k)
Net capital gain/loss in AGI: +$15,313 (reported on 23.4% of returns)
Here:
+$15,313
State:
+$11,802
(% of AGI for various income ranges: 0.4% for AGIs $25k-50k, 0.6% for AGIs $50k-75k, 1.3% for AGIs $75k-100k, 1.7% for AGIs $100k-200k, 14.6% for AGIs over 200k)
Profit/loss from business: +$14,872 (reported on 13.8% of returns)
Here:
+$14,872
State:
+$10,509
(% of AGI for various income ranges: 3.1% for AGIs below $25k, 2.4% for AGIs $25k-50k, 2.3% for AGIs $50k-75k, 2.1% for AGIs $75k-100k, 2.6% for AGIs $100k-200k, 3.9% for AGIs over 200k)
Taxable individual retirement arrangement distribution: $13,011 (reported on 13.3% of returns)
50613:
$13,011
Iowa:
$11,773
(% of AGI for various income ranges: 3.4% for AGIs below $25k, 2.9% for AGIs $25k-50k, 2.8% for AGIs $50k-75k, 2.9% for AGIs $75k-100k, 2.7% for AGIs $100k-200k, 1.4% for AGIs over 200k)
Self-employment retirement plans: $17,941 (reported on 1.0% of returns)
50613:
$17,941
Iowa:
$18,614
(% of AGI for various income ranges: 0.2% for AGIs $50k-75k, 0.3% for AGIs $100k-200k, 0.5% for AGIs over 200k)
Total itemized deductions: $23,367 (18% of AGI, reported on 38.6% of returns)
Here:
$23,367
State:
$21,278
Here:
17.8% of AGI
State:
18.9% of AGI
(% of AGI for various income ranges: 9.3% for AGIs below $25k, 8.9% for AGIs $25k-50k, 11.6% for AGIs $50k-75k, 13.8% for AGIs $75k-100k, 15.2% for AGIs $100k-200k, 12.2% for AGIs over 200k)
Charity contributions: $4,933 (reported on 32.7% of returns)
Here:
$4,933
State:
$4,044
(% of AGI for various income ranges: 0.7% for AGIs below $25k, 1.1% for AGIs $25k-50k, 1.8% for AGIs $50k-75k, 2.2% for AGIs $75k-100k, 2.8% for AGIs $100k-200k, 2.7% for AGIs over 200k)
Taxes paid: $10,350 (reported on 38.5% of returns)
50613:
$10,350
State:
$8,846
(% of AGI for various income ranges: 1.6% for AGIs below $25k, 2.4% for AGIs $25k-50k, 4.0% for AGIs $50k-75k, 5.4% for AGIs $75k-100k, 7.1% for AGIs $100k-200k, 6.8% for AGIs over 200k)
Earned income credit: $1,770 (reported on 8.9% of returns)
Here:
$1,770
State:
$2,098
(% of AGI for various income ranges: 2.9% for AGIs below $25k, 0.5% for AGIs $25k-50k)
Percentage of individuals using paid preparers for their 2012 taxes: 59.3%
Here:
59%
State:
65%
(% for various income ranges: 48.5% for AGIs below $25k, 58.0% for AGIs $25k-50k, 66.2% for AGIs $50k-75k, 66.7% for AGIs $75k-100k, 67.4% for AGIs $100k-200k, 80.8% for AGIs over 200k)
Averages for the 2004 tax year for zip code 50613, filed in 2005:
Average Adjusted Gross Income (AGI) in 2004: $51,042 (Individual Income Tax Returns)
Here:
$51,042
State:
$43,875
Salary/wage: $43,222 (reported on 84.5% of returns)
Here:
$43,222
State:
$38,265
(% of AGI for various income ranges: 118.0% for AGIs below $10k, 71.2% for AGIs $10k-25k, 74.3% for AGIs $25k-50k, 75.7% for AGIs $50k-75k, 77.4% for AGIs $75k-100k, 64.8% for AGIs over 100k)
Taxable interest for individuals: $1,529 (reported on 60.7% of returns)
This zip code:
$1,529
Iowa:
$1,768
(% of AGI for various income ranges: 5.3% for AGIs below $10k, 3.6% for AGIs $10k-25k, 2.3% for AGIs $25k-50k, 1.6% for AGIs $50k-75k, 1.3% for AGIs $75k-100k, 1.5% for AGIs over 100k)
Taxable dividends: $3,047 (reported on 34.6% of returns)
Here:
$3,047
State:
$2,510
(% of AGI for various income ranges: 5.7% for AGIs below $10k, 2.2% for AGIs $10k-25k, 1.6% for AGIs $25k-50k, 1.4% for AGIs $50k-75k, 1.2% for AGIs $75k-100k, 2.7% for AGIs over 100k)
Net capital gain/loss: +$6,155 (reported on 27.9% of returns)
Here:
+$6,155
State:
+$6,139
(% of AGI for various income ranges: -0.7% for AGIs below $10k, 0.4% for AGIs $10k-25k, 0.6% for AGIs $25k-50k, 1.1% for AGIs $50k-75k, 1.5% for AGIs $75k-100k, 6.7% for AGIs over 100k)
Profit/loss from business: +$12,527 (reported on 14.4% of returns)
Here:
+$12,527
State:
+$8,574
(% of AGI for various income ranges: 4.2% for AGIs below $10k, 3.1% for AGIs $10k-25k, 2.5% for AGIs $25k-50k, 2.8% for AGIs $50k-75k, 2.7% for AGIs $75k-100k, 4.5% for AGIs over 100k)
IRA payment deduction: $3,063 (reported on 2.5% of returns)
50613:
$3,063
Iowa:
$2,970
(% of AGI for various income ranges: 0.3% for AGIs $10k-25k, 0.3% for AGIs $25k-50k, 0.2% for AGIs $50k-75k, 0.1% for AGIs $75k-100k, 0.1% for AGIs over 100k)
Self-employed pension: $14,246 (reported on 1.2% of returns)
Here:
$14,246
Iowa:
$11,928
(% of AGI for various income ranges: 0.1% for AGIs $25k-50k, 0.1% for AGIs $50k-75k, 0.2% for AGIs $75k-100k, 0.6% for AGIs over 100k)
Total itemized deductions: $18,168 (19% of AGI, reported on 38.7% of returns)
Here:
$18,168
State:
$16,976
Here:
19.3% of AGI
State:
20.8% of AGI
(% of AGI for various income ranges: 14.8% for AGIs below $10k, 11.1% for AGIs $10k-25k, 11.9% for AGIs $25k-50k, 14.2% for AGIs $50k-75k, 15.6% for AGIs $75k-100k, 14.1% for AGIs over 100k)
Charity contributions deductions: $4,025 (4% of AGI, reported on 34.3% of returns)
Here:
$4,025
State:
$3,089
Here:
4.0% of AGI
State:
3.6% of AGI
(% of AGI for various income ranges: 0.7% for AGIs below $10k, 1.4% for AGIs $10k-25k, 1.8% for AGIs $25k-50k, 2.3% for AGIs $50k-75k, 2.7% for AGIs $75k-100k, 3.5% for AGIs over 100k)
Total tax: $8,165 (reported on 78.8% of returns)
50613:
$8,165
State:
$6,177
(% of AGI for various income ranges: 2.6% for AGIs below $10k, 4.2% for AGIs $10k-25k, 7.2% for AGIs $25k-50k, 8.7% for AGIs $50k-75k, 10.5% for AGIs $75k-100k, 18.9% for AGIs over 100k)
Earned income credit: $1,371 (reported on 8.2% of returns)
Here:
$1,371
State:
$1,540
Percentage of individuals using paid preparers for their 2004 taxes: 61.8%
Here:
62%
State:
70%
(% for various income ranges: 48.7% for AGIs below $10k, 60.5% for AGIs $10k-25k, 66.3% for AGIs $25k-50k, 68.5% for AGIs $50k-75k, 65.4% for AGIs $75k-100k, 70.1% for AGIs over 100k)
Household received Food Stamps/SNAP in the past 12 months: 805 Household did not receive Food Stamps/SNAP in the past 12 months: 16,390
Women who had a birth in the past 12 months: 678 (560 now married, 124 unmarried) Women who did not have a birth in the past 12 months: 12,252 (3,582 now married, 8,682 unmarried)
Housing units in zip code 50613 with a mortgage: 6,701 (1,235 second mortgage, 903 both second mortgage and home equity loan) Houses without a mortgage: 445
Median monthly owner costs for units with a mortgage: $1,671 Median monthly owner costs for units without a mortgage: $621
Residents with income below the poverty level in 2022:
This zip code:
16.0%
Whole state:
11.0%
Residents with income below 50% of the poverty level in 2022:
This zip code:
6.2%
Whole state:
5.5%
Median number of rooms in houses and condos:
Here:
7.1
State:
6.8
Median number of rooms in apartments:
Here:
4.4
State:
4.2
Notable locations in this zip code not listed on our city pages
Notable locations in zip code 50613: Cedar Falls (A), Antique Acres Show Grounds (B), Antique Acres Campground (C), Falls Access (D), Washington Park Golf Course (E), Walters Ridge Golf Course (F), Pheasant Ridge Golf Course (G), Beaver Hill Country Club (H), New Hartford (I), Jennings Court (J), Hillside Courts (K), Center for Energy and Environmental Education (L), Industrial Technology Center (M), College Courts (N), Visitor and Information Center (O), Gallagher-Bluedorn Performing Arts Center (P), Shull Hall (Q), Noehren Hall (R), Redeker Center (S), Biology Research Complex (T). Display/hide their locations on the map
Churches in zip code 50613 include: Washington Chapel (A), Zion Church (B), East Janesville Church (C), Immanuel Southern Baptist Church (D), Trinity Wesleyan Church (E), Cedar Falls Church of Christ (F), First Christian Science Church (G), First Church of Christ Scientist (H), First United Methodist Church (I). Display/hide their locations on the map
Cemeteries: Pet Haven Cemetery (1), Benson Cemetery (2), East Janesville Cemetery (3), Saint Paul United Church of Christ Cemetery (4), Washington Chapel Cemetery (5), Cedar Valley Memorial Gardens (6), Fairfield Township Cemetery (7). Display/hide their locations on the map
Parks in zip code 50613 include: Beaver Creek Access Point (1), Black Hawk Park (2), Clay Street Park (3), Historic Cedar Falls State Historical Marker (4), First Settlers in Black Hawk County Historical Marker (5), Sturgis Park (6), Dedication to Peter Melendy Historical Marker (7), Peter Melendy Park (8), Dedication to Zimri Streeter Historical Marker (9). Display/hide their locations on the map
6,318 married couples with children.
1,258 single-parent households (437 men, 821 women).
93.4% of residents of 50613 zip code speak English at home.
2.2% of residents speak Spanish at home (82% very well, 10% well, 2% not well, 6% not at all).
2.7% of residents speak other Indo-European language at home (70% very well, 21% well, 8% not well, 1% not at all).
1.2% of residents speak Asian or Pacific Island language at home (77% very well, 21% well, 2% not well).
0.2% of residents speak other language at home (70% very well, 30% well).
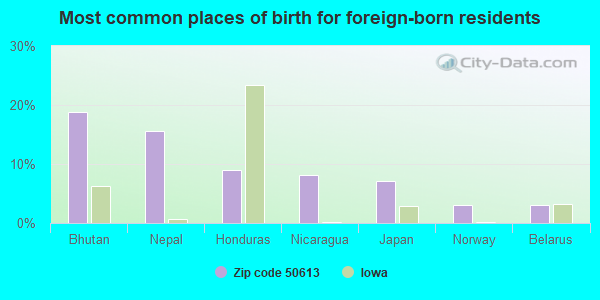
Foreign born population: 2,240 (5.1%) (52.4% of them are naturalized citizens)
This zip code:
5.1%
Whole state:
6.0%
19%Bhutan
16%Nepal
9%Honduras
8%Nicaragua
7%Japan
3%Norway
3%Belarus
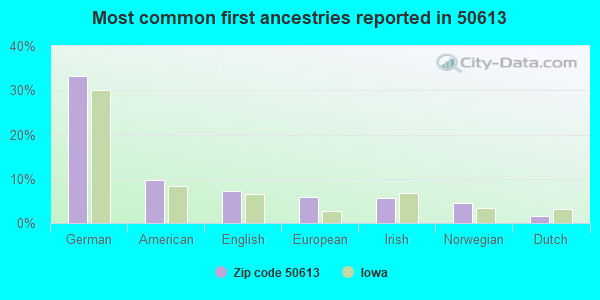
33%German
10%American
7%English
6%European
6%Irish
5%Norwegian
2%Dutch
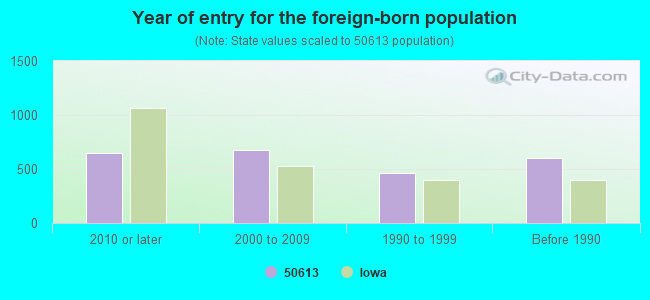
Year of entry for the foreign-born population
6492010 or later
6762000 to 2009
4651990 to 1999
603Before 1990
Major facilities with environmental interests located in this zip code:
CEDAR FALLS UTILITIES STREETER STATION (612 EAST 12TH STREET in CEDAR FALLS, IA)
AIR MAJOR (AIRS/AFS) AIR PROGRAM (Clean Air Markets Division Business System) ENFORCEMENT/COMPLIANCE ACTIVITY (Integrated Compliance Information System) - ICIS-07-2001-0254, FORMAL ENFORCEMENT ACTION (Integrated Compliance Information System) - ICIS-07-2001-0254, FORMAL ENFORCEMENT ACTION COMPLIANCE ACTIVITY (Tracking inspections of insecticide, fungicide, and rodenticide, and toxic substances) CRITERIA AND HAZARDOUS AIR POLLUTANT INVENTORY (Inventory of air pollution sources) National Pollutant Discharge Elimination System NON-MAJOR (Tracking pollutant discharge elimination systems) - permit Conditionally Exempt Small Quantity Generators, less than 100 kg/month of hazardous waste (Resource Conservation and Recovery Act (tracking hazardous waste)) - notification TRI REPORTER (Tracking of toxic chemicals releasing facilities) Business SIC classification: ELECTRIC SERVICES; COMBINATION UTILITIES Organizations: CITY OF CEDAR FALLS (CONTACT/OWNER)
, CEDAR FALLS MUNICIPAL ELECTRIC (OWNER/OPERATOR)
Alternative names: CEDAR FALLS MUNICIPAL ELECTRIC UTILITY
DIETRICK MOBILE HOME PARK (34304 160TH STREET in CEDAR FALLS, IA)
STATE MASTER (Iowa emission factors information) - SDWIS-IA3800600, DRINKING WATER SYSTEM National Pollutant Discharge Elimination System NON-MAJOR (Tracking pollutant discharge elimination systems) - permit COMMUNITY WATER SYSTEM (SDWIS) Business SIC classification: OPERATORS OF RESIDENTIAL MOBILE HOME SITES Organizations: DIETRICK MOBILE HOME PARK, INC (CONTACT/OWNER)
, THOMAS E DIETRICK (LEGALLY RESPONSIBLE ENTITY)
Alternative names: DIETRICK MOBILE HOME PARK (DIKE & FREDVILLE)
CURBMASTER FORMER CMI METRO PAVE (115 EAST 19TH STREET in CEDAR FALLS, IA)
(Resource Conservation and Recovery Act (tracking hazardous waste)) STATE MASTER (Wisconsin database) - RCRAINFO-IAD984599522, LQG Organizations: CURBMASTER USA INC, JOHN F MEYERS (CONTACT/OPERATOR)
, CMI CORP, JIM HOLLAND-PRESIDENT (CONTACT/OWNER)
Alternative names: CMI METRO-PAV INC, CMI METRO-PAV INC - FORMER SITE OF
COMMUNITY MOTOR COMPANY INCORPORATED (4521 UNIVERSITY AVENUE in CEDAR FALLS, IA)
AIR MINOR (AIRS/AFS) (Integrated Compliance Information System) - ICIS-07-1998-0241, FORMAL ENFORCEMENT ACTION Conditionally Exempt Small Quantity Generators, less than 100 kg/month of hazardous waste (Resource Conservation and Recovery Act (tracking hazardous waste)) Business SIC classification: MOTOR VEHICLE DEALERS (NEW AND USED) Business NAICS classification: GENERAL AUTOMOTIVE REPAIR.
CEDAR FALLS OIL CO (305 HORTY ST in CEDAR FALLS, IA)
AIR MINOR (AIRS/AFS) (Integrated Compliance Information System) - ICIS-07-2004-0070, FORMAL ENFORCEMENT ACTION Conditionally Exempt Small Quantity Generators, less than 100 kg/month of hazardous waste (Resource Conservation and Recovery Act (tracking hazardous waste)) Business SIC classification: SCRAP AND WASTE MATERIALS
COFFMAN BODY SHOP (1906 STATE ST in CEDAR FALLS, IA)
(Integrated Compliance Information System) - ICIS-07-1987-0324, FORMAL ENFORCEMENT ACTION Small Quantity Generators, between 100 kg and 1000 kg of hazardous waste/month (Resource Conservation and Recovery Act (tracking hazardous waste)) - notification TSD (Resource Conservation and Recovery Act (tracking hazardous waste)) Business SIC classification: MOTOR VEHICLE DEALERS (USED ONLY); TOP, BODY, AND UPHOLSTERY REPAIR SHOPS AND PAINT SHOPS Organizations: RON COFFMAN (CONTACT/OWNER)
CEDAR FALLS HIGH SCHOOL (1015 DIVISION ST in CEDAR FALLS, IA)
(Geographic Names Information System) (National Center for Education Statistics) - STATE ID-071044 109 Organizations: CEDAR FALLS COMM SCHOOL DISTRICT (SCHOOL DISTRICT)
BIG WOODS AUTO (3305 BIG WOODS RD in CEDAR FALLS, IA)
(Integrated Compliance Information System) - ICIS-07-1987-0233, FORMAL ENFORCEMENT ACTION TSD (Resource Conservation and Recovery Act (tracking hazardous waste)) Business SIC classification: AUTO AND HOME SUPPLY STORES; TOP, BODY, AND UPHOLSTERY REPAIR SHOPS AND PAINT SHOPS Organizations: MELVIN D CUNNINGHAM (CONTACT/OWNER)
UNIVERSITY OF NORTHERN IOWA (1901 CAMPUS STREET in CEDAR FALLS, IA)
(Integrated Compliance Information System) - ICIS-07-2000-0085, FORMAL ENFORCEMENT ACTION COMPLIANCE ACTIVITY (Tracking inspections of insecticide, fungicide, and rodenticide, and toxic substances) Alternative names: MALCOLM PRICE LABORATORY SCHOOL
PEET JUNIOR HIGH SCHOOL (525 E SEERLEY BLVD in CEDAR FALLS, IA)
(Geographic Names Information System) (National Center for Education Statistics) - STATE ID-071044 218 Organizations: CEDAR FALLS COMM SCHOOL DISTRICT (SCHOOL DISTRICT)
SARTORI MEMORIAL HOSPITAL (515 COLLEGE STREET in CEDAR FALLS, IA)
AIR MINOR (AIRS/AFS) COMPLIANCE ACTIVITY (Tracking inspections of insecticide, fungicide, and rodenticide, and toxic substances) Conditionally Exempt Small Quantity Generators, less than 100 kg/month of hazardous waste (Resource Conservation and Recovery Act (tracking hazardous waste)) Business SIC classification: NONCLASSIFIABLE ESTABLISHMENTS Organizations: COVENANT HEALTH SYSTEMS (CONTACT/OPERATOR)
, CITY OF CEDAR FALLS (CONTACT/OWNER)
Alternative names: SARTORI HOSPITAL
ORCHARD HILL ELEMENTARY SCHOOL (3909 ROWND ST in CEDAR FALLS, IA)
(National Center for Education Statistics) - STATE ID-071044 463 Organizations: CEDAR FALLS COMM SCHOOL DISTRICT (SCHOOL DISTRICT)
SOUTHDALE ELEMENTARY SCHOOL (627 ORCHARD DR in CEDAR FALLS, IA)
(National Center for Education Statistics) - STATE ID-071044 472 Organizations: CEDAR FALLS COMM SCHOOL DISTRICT (SCHOOL DISTRICT)
Housing units lacking complete plumbing facilities: 0.6% Housing units lacking complete kitchen facilities: 1.8%
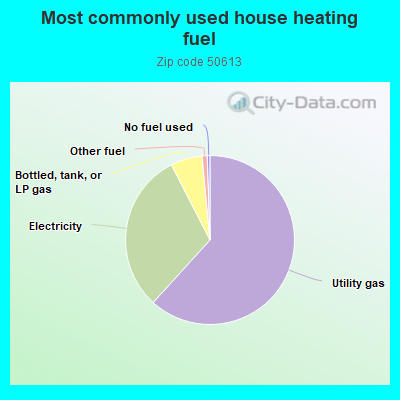
61.5%Utility gas
30.6%Electricity
6.0%Bottled, tank, or LP gas
1.0%Other fuel
0.5%No fuel used
Population in 1990: 36,084. Population change in the 1990s: +2,597 (+7.2%).
Place of birth for U.S.-born residents:
This state: 32,508
Northeast: 593
Midwest: 5,925
South: 1,157
West: 1,205
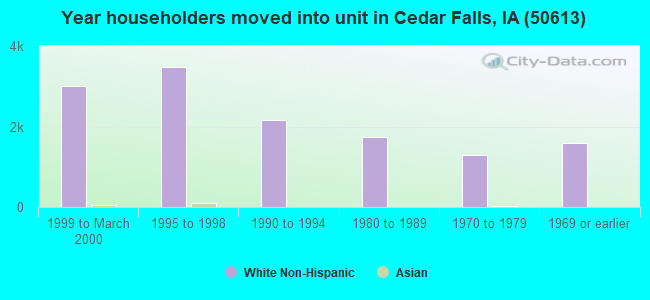
46% of the 50613 zip code residents lived in the same house 5 years ago. Out of people who lived in different houses, 40% lived in this county. Out of people who lived in different counties, 50% lived in Iowa.
88% of the 50613 zip code residents lived in the same house 1 year ago. Out of people who lived in different houses, 59% moved from this county. Out of people who lived in different houses, 28% moved from different county within same state. Out of people who lived in different houses, 10% moved from different state. Out of people who lived in different houses, 2% moved from abroad.
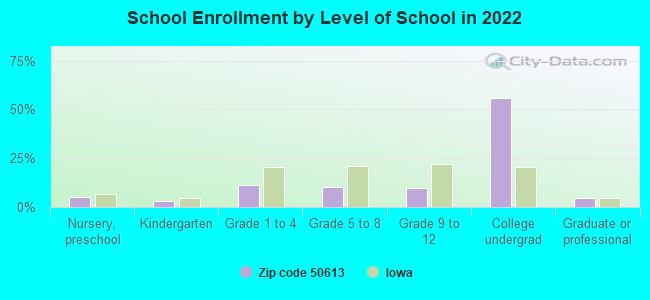
Private vs. public school enrollment:
Students in private schools in grades 1 to 8 (elementary and middle school): 318
Here:
9.7%
Iowa:
10.6%
Students in private schools in grades 9 to 12 (high school): 122
Here:
8.3%
Iowa:
7.9%
Students in private undergraduate colleges: 342
Here:
4.0%
Iowa:
23.9%
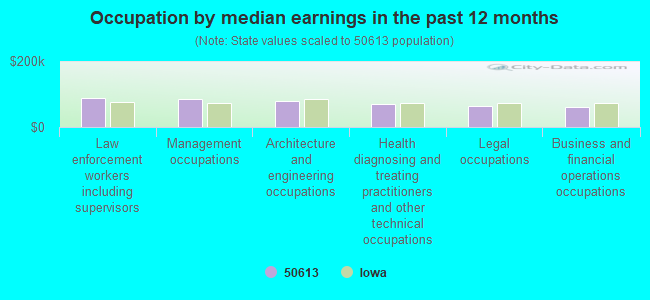
Occupation by median earnings in the past 12 months ($)
89,053Law enforcement workers including supervisors
85,101Management occupations
79,027Architecture and engineering occupations
69,987Health diagnosing and treating practitioners and other technical occupations
65,004Legal occupations
61,289Business and financial operations occupations
Companies with federal contracts located in this zip code (CEDAR FALLS, IA):
CAMP ADVENTURE (1017 OAK PARK BLVD) : $136,550 in 4 contractsin 2004
$54,150 with Air Force for Educational Services. Signed on 2004-05-13. Completion date: 2004-08-21.
$29,750 with Army for Recreational Services. Taking place in GA. Signed on 2004-04-14. Completion date: 2004-08-06.
$29,700 with Air Force for Recreational Services. Taking place in AK. Signed on 2004-07-16. Completion date: 2004-08-19.
$22,950 with Army for Tuition, Registration, and Membership Fees. Taking place in CA. Signed on 2004-04-27. Completion date: 2004-08-21.
HEARTLAND MACHINERY LLC (1110 WEST 2ND STREET; small business) : $128,505 in 3 contractsfrom 2005 to 2006
$84,260 with Army for Grinding Machines. Signed on 2006-05-15. Completion date: 2006-07-10.
$34,000, same as above.Signed on 2005-09-30. Completion date: 2005-11-09.
$10,245 with Army for Accessories for Secondary Metalworking Machinery. Signed on 2005-09-30. Completion date: 2005-10-28.
CEDAR VALLEY LAWN CARE INC (4728 UNIVERSITY AVE STE B; small business) : $37,416 in 9 contractsfrom 2002 to 2005
Contracts for Snow Removal/Salt Service (also spreading aggregate or other snow melting material), Landscaping/Groundskeeping Services by Army Signed by year:2000: $0; 2001: $0; 2002: $5,904; 2003: $10,561; 2004: $9,423; 2005: $11,528; 2006: $0.
Biggest contracts:
$6,899 with Army for Snow Removal/Salt Service (also spreading aggregate or other snow melting material). Signed on 2005-11-30. Completion date: 2006-11-30.
$6,504, same as above.Signed on 2004-12-01. Completion date: 2005-11-30.
$6,198, same as above.Signed on 2003-11-08. Completion date: 2004-11-30.
$5,904, same as above.Signed on 2002-11-19. Completion date: 2003-11-30.
V SOFT COMMUNICATIONS LLC (721 W 1ST ST STE A; small business) : $26,135 in 2 contractsfrom 2003 to 2005
$14,320 with Army for Communications Studies. Signed on 2003-11-07. Completion date: 2004-02-28.
$11,815 with Navy for ADP Software. Signed on 2005-09-10. Completion date: 2005-09-16.
WHITNEY BUILDERS INC (3617 BIG WOODS ROAD; small business) : $21,250 in 4 contractsin 2001
$21,250 with U.S. Army Corps of Engineers - civil program financing only for Maintenance, Repair or Alteration of Real Property -- Other Non-Building Facilities. Signed on 2001-12-05. Completion date: 2001-12-12.
$21,250, same as above.Signed on 2001-11-06. Completion date: 2001-12-12.
$0, same as above.Signed on 2001-12-05. Completion date: 2001-12-12.
-$21,250, same as above.Signed on 2001-11-06. Completion date: 2001-12-12.
GROVOS JANITORIAL AND FLOOR MA (920 W GRESHAM RD; small business) : $15,409 in 3 contractsfrom 2003 to 2004
$8,071 with Army for Custodial Janitorial Services. Signed on 2004-04-20. Completion date: 2004-04-30.
$7,338, same as above.Signed on 2003-05-01. Completion date: 2004-04-30.
$0, same as above.Signed on 2003-05-01. Completion date: 2004-04-30.
THOMAN, JOSEPH L MD (1506 MAIN ST; small business) : $12,800 in 2 contractsin 2004
$8,800 with Army for Dentistry Services. Signed on 2004-02-18. Completion date: 2004-02-19.
$4,000, same as above.Signed on 2004-08-27. Completion date: 2004-09-29.
TENOR MADNESS INC (1911 ORCHARD AVE; small business)
$4,245 with Army for Musical Instruments. Signed on 2004-03-05. Completion date: 2004-04-05.
Top industries in this zip code by the number of employees in 2005:
2002 - 2017 National Fire Incident Reporting System (NFIRS) incidents
According to the data from the years 2002 - 2017 the average number of fires per year is 39. The highest number of reported fire incidents - 100 took place in 2005, and the least - 0 in 2010. The data has a declining trend.
When looking into fire subcategories, the most reports belonged to: Structure Fires (41.3%), and Outside Fires (33.2%).
Fire incident types reported to NFIRS in Zip Code 50613


 Nearest zip codes: 50647, 50660, 50643, 50624, 50701, 50702.


 According to the data from the years 2002 - 2017 the average number of fires per year is 39. The highest number of reported fire incidents - 100 took place in 2005, and the least - 0 in 2010. The data has a declining trend.
 When looking into fire subcategories, the most reports belonged to: Structure Fires (41.3%), and Outside Fires (33.2%).