Estimated zip code population in 2022: 28,123 Zip code population in 2010: 19,225 Zip code population in 2000: 12,778
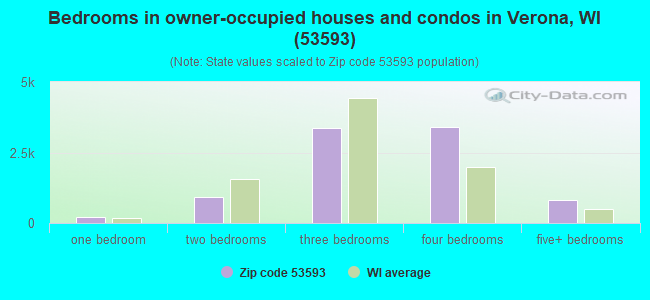
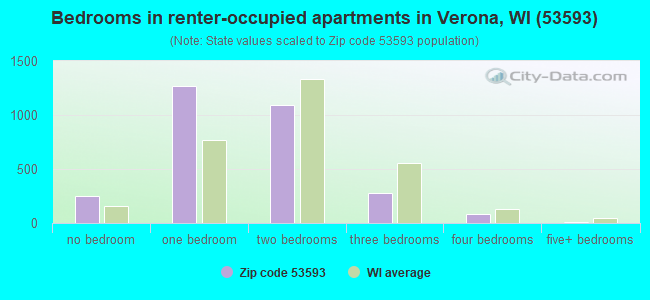
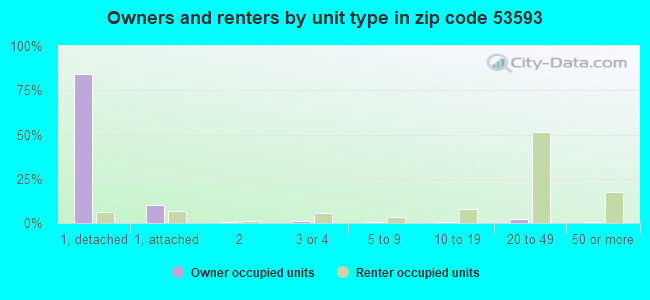
Houses and condos: 12,052 Renter-occupied apartments: 2,950
% of renters here:
26%
State:
32%
March 2022 cost of living index in zip code 53593: 97.4 (near average, U.S. average is 100)
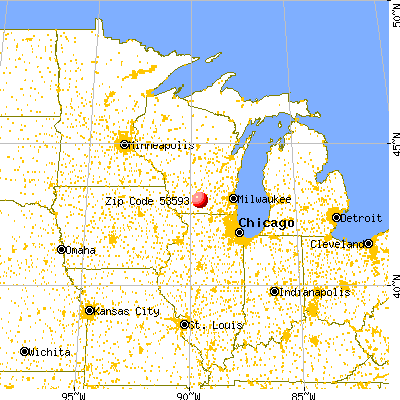
Land area: 71.9 sq. mi. Water area: 0.2 sq. mi.
Population density: 391 people per square mile
(very low).
OSM Map
General Map
Google Map
MSN Map
OSM Map
General Map
Google Map
MSN Map
OSM Map
General Map
Google Map
MSN Map
OSM Map
General Map
Google Map
MSN Map
Please wait while loading the map...
Real estate property taxes paid for housing units in 2022:
This zip code:
1.5% ($7,042)
Wisconsin:
1.4% ($3,497)
Median real estate property taxes paid for housing units with mortgages in 2022: $7,109 (1.5%) Median real estate property taxes paid for housing units with no mortgage in 2022: $6,901 (1.5%)
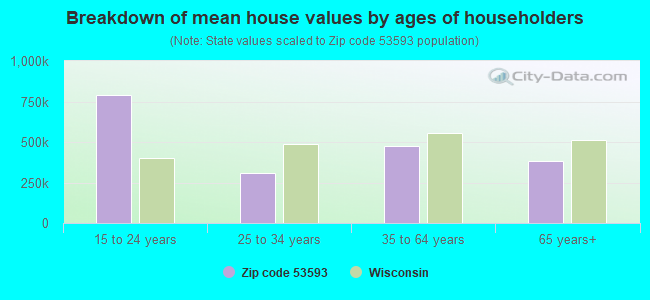
Estimated median house/condo value in 2022: $479,708
53593:
$479,708
Wisconsin:
$252,800
According to our research of Wisconsin and other state lists, there were 26 registered sex offenders living in 53593 zip code as of April 27, 2024. The ratio of all residents to sex offenders in zip code 53593 is 851 to 1. The ratio of registered sex offenders to all residents in this zip code is lower than the state average.
Median resident age:
This zip code:
38.3 years
Wisconsin median age:
40.4 years
Average household size:
This zip code:
2.4 people
Wisconsin:
2.3 people
Averages for the 2020 tax year for zip code 53593, filed in 2021:
Average Adjusted Gross Income (AGI) in 2020: $132,533 (Individual Income Tax Returns)
Here:
$132,533
State:
$72,319
Salary/wage: $108,867 (reported on 85.5% of returns)
Here:
$108,867
State:
$59,242
(% of AGI for various income ranges: 1219.3% for AGIs below $25k, 3977.6% for AGIs $25k-50k, 6599.3% for AGIs $50k-75k, 10126.1% for AGIs $75k-100k, 20328.7% for AGIs $100k-200k, 80603.0% for AGIs over 200k)
Taxable interest for individuals: $2,256 (reported on 51.8% of returns)
This zip code:
$2,256
Wisconsin:
$1,431
(% of AGI for various income ranges: 27.9% for AGIs below $25k, 38.2% for AGIs $25k-50k, 42.8% for AGIs $50k-75k, 80.3% for AGIs $75k-100k, 150.6% for AGIs $100k-200k, 1398.0% for AGIs over 200k)
Ordinary dividends: $7,512 (reported on 40.5% of returns)
Here:
$7,512
State:
$6,481
(% of AGI for various income ranges: 54.4% for AGIs below $25k, 97.0% for AGIs $25k-50k, 151.7% for AGIs $50k-75k, 232.0% for AGIs $75k-100k, 547.9% for AGIs $100k-200k, 3197.4% for AGIs over 200k)
Net capital gain/loss in AGI: +$27,300 (reported on 37.3% of returns)
Here:
+$27,300
State:
+$18,329
(% of AGI for various income ranges: 44.2% for AGIs below $25k, 103.6% for AGIs $25k-50k, 154.7% for AGIs $50k-75k, 209.5% for AGIs $75k-100k, 746.1% for AGIs $100k-200k, 15453.4% for AGIs over 200k)
Profit/loss from business: +$23,174 (reported on 14.9% of returns)
Here:
+$23,174
State:
+$14,562
(% of AGI for various income ranges: 90.6% for AGIs below $25k, 122.9% for AGIs $25k-50k, 211.0% for AGIs $50k-75k, 405.8% for AGIs $75k-100k, 620.0% for AGIs $100k-200k, 3310.1% for AGIs over 200k)
Taxable individual retirement arrangement distribution: $24,896 (reported on 12.1% of returns)
53593:
$24,896
Wisconsin:
$19,348
(% of AGI for various income ranges: 89.4% for AGIs below $25k, 136.4% for AGIs $25k-50k, 250.9% for AGIs $50k-75k, 432.0% for AGIs $75k-100k, 923.8% for AGIs $100k-200k, 1608.3% for AGIs over 200k)
Self-employed (Keogh) retirement plans: $24,623 (reported on 1.5% of returns)
53593:
$24,623
Wisconsin:
$21,322
(% of AGI for various income ranges: 19.6% for AGIs $50k-75k, 43.2% for AGIs $100k-200k, 519.0% for AGIs over 200k)
Total itemized deductions: $33,816 (reported on 16.1% of returns)
Here:
$33,816
State:
$33,000
(% of AGI for various income ranges: 150.6% for AGIs below $25k, 165.3% for AGIs $25k-50k, 413.1% for AGIs $50k-75k, 640.3% for AGIs $75k-100k, 1026.3% for AGIs $100k-200k, 4978.9% for AGIs over 200k)
Charity contributions: $11,143 (reported on 13.0% of returns)
Here:
$11,143
State:
$12,044
(% of AGI for various income ranges: 3.7% for AGIs below $25k, 14.7% for AGIs $25k-50k, 35.9% for AGIs $50k-75k, 85.1% for AGIs $75k-100k, 199.3% for AGIs $100k-200k, 1880.1% for AGIs over 200k)
Taxes paid: $9,431 (reported on 16.0% of returns)
53593:
$9,431
State:
$8,228
(% of AGI for various income ranges: 21.5% for AGIs below $25k, 44.8% for AGIs $25k-50k, 136.1% for AGIs $50k-75k, 234.4% for AGIs $75k-100k, 358.5% for AGIs $100k-200k, 1126.3% for AGIs over 200k)
Earned income credit: $1,532 (reported on 3.8% of returns)
Here:
$1,532
State:
$2,155
(% of AGI for various income ranges: 28.6% for AGIs below $25k, 21.9% for AGIs $25k-50k)
Percentage of individuals using paid preparers for their 2020 taxes: 94.0%
Here:
94%
State:
94%
(% for various income ranges: 90.2% for AGIs below $25k, 93.3% for AGIs $25k-50k, 95.4% for AGIs $50k-75k, 94.8% for AGIs $75k-100k, 94.8% for AGIs $100k-200k, 96.1% for AGIs over 200k)
Averages for the 2012 tax year for zip code 53593, filed in 2013:
Average Adjusted Gross Income (AGI) in 2012: $105,466 (Individual Income Tax Returns)
Here:
$105,466
State:
$57,939
Salary/wage: $84,240 (reported on 87.2% of returns)
Here:
$84,240
State:
$48,248
(% of AGI for various income ranges: 76.2% for AGIs below $25k, 78.2% for AGIs $25k-50k, 75.7% for AGIs $50k-75k, 76.9% for AGIs $75k-100k, 79.8% for AGIs $100k-200k, 58.8% for AGIs over 200k)
Taxable interest for individuals: $1,800 (reported on 55.5% of returns)
This zip code:
$1,800
Wisconsin:
$1,224
(% of AGI for various income ranges: 1.8% for AGIs below $25k, 1.0% for AGIs $25k-50k, 0.9% for AGIs $50k-75k, 0.8% for AGIs $75k-100k, 0.6% for AGIs $100k-200k, 1.1% for AGIs over 200k)
Ordinary dividends: $6,240 (reported on 38.3% of returns)
Here:
$6,240
State:
$5,137
(% of AGI for various income ranges: 3.5% for AGIs below $25k, 1.7% for AGIs $25k-50k, 1.8% for AGIs $50k-75k, 1.7% for AGIs $75k-100k, 1.7% for AGIs $100k-200k, 2.9% for AGIs over 200k)
Net capital gain/loss in AGI: +$18,920 (reported on 31.3% of returns)
Here:
+$18,920
State:
+$11,137
(% of AGI for various income ranges: 0.9% for AGIs below $25k, 0.6% for AGIs $25k-50k, 0.9% for AGIs $50k-75k, 1.0% for AGIs $75k-100k, 1.3% for AGIs $100k-200k, 11.2% for AGIs over 200k)
Profit/loss from business: +$21,743 (reported on 16.7% of returns)
Here:
+$21,743
State:
+$11,943
(% of AGI for various income ranges: 4.5% for AGIs below $25k, 3.8% for AGIs $25k-50k, 2.6% for AGIs $50k-75k, 2.9% for AGIs $75k-100k, 3.5% for AGIs $100k-200k, 3.5% for AGIs over 200k)
Taxable individual retirement arrangement distribution: $20,721 (reported on 12.2% of returns)
53593:
$20,721
Wisconsin:
$14,087
(% of AGI for various income ranges: 3.4% for AGIs below $25k, 3.3% for AGIs $25k-50k, 3.2% for AGIs $50k-75k, 2.8% for AGIs $75k-100k, 2.1% for AGIs $100k-200k, 2.2% for AGIs over 200k)
Self-employment retirement plans: $19,059 (reported on 2.1% of returns)
53593:
$19,059
Wisconsin:
$17,048
(% of AGI for various income ranges: 0.4% for AGIs $50k-75k, 0.3% for AGIs $100k-200k, 0.6% for AGIs over 200k)
Total itemized deductions: $30,434 (19% of AGI, reported on 56.0% of returns)
Here:
$30,434
State:
$22,257
Here:
18.6% of AGI
State:
20.1% of AGI
(% of AGI for various income ranges: 17.9% for AGIs below $25k, 14.2% for AGIs $25k-50k, 17.7% for AGIs $50k-75k, 18.4% for AGIs $75k-100k, 18.9% for AGIs $100k-200k, 13.8% for AGIs over 200k)
Charity contributions: $3,603 (reported on 47.6% of returns)
Here:
$3,603
State:
$3,370
(% of AGI for various income ranges: 0.8% for AGIs below $25k, 1.1% for AGIs $25k-50k, 1.4% for AGIs $50k-75k, 1.7% for AGIs $75k-100k, 1.8% for AGIs $100k-200k, 1.6% for AGIs over 200k)
Taxes paid: $16,970 (reported on 55.8% of returns)
53593:
$16,970
State:
$10,731
(% of AGI for various income ranges: 4.8% for AGIs below $25k, 5.1% for AGIs $25k-50k, 8.1% for AGIs $50k-75k, 9.1% for AGIs $75k-100k, 10.3% for AGIs $100k-200k, 9.0% for AGIs over 200k)
Earned income credit: $1,652 (reported on 5.5% of returns)
Here:
$1,652
State:
$2,094
(% of AGI for various income ranges: 2.4% for AGIs below $25k, 0.4% for AGIs $25k-50k)
Percentage of individuals using paid preparers for their 2012 taxes: 47.8%
Here:
48%
State:
54%
(% for various income ranges: 38.5% for AGIs below $25k, 42.9% for AGIs $25k-50k, 50.7% for AGIs $50k-75k, 49.2% for AGIs $75k-100k, 49.2% for AGIs $100k-200k, 72.0% for AGIs over 200k)
Averages for the 2004 tax year for zip code 53593, filed in 2005:
Average Adjusted Gross Income (AGI) in 2004: $93,188 (Individual Income Tax Returns)
Here:
$93,188
State:
$47,735
Salary/wage: $72,090 (reported on 87.7% of returns)
Here:
$72,090
State:
$41,540
(% of AGI for various income ranges: 171.3% for AGIs below $10k, 73.2% for AGIs $10k-25k, 81.9% for AGIs $25k-50k, 79.1% for AGIs $50k-75k, 83.3% for AGIs $75k-100k, 61.7% for AGIs over 100k)
Taxable interest for individuals: $1,883 (reported on 67.5% of returns)
This zip code:
$1,883
Wisconsin:
$1,420
(% of AGI for various income ranges: 11.8% for AGIs below $10k, 3.1% for AGIs $10k-25k, 1.5% for AGIs $25k-50k, 1.2% for AGIs $50k-75k, 0.9% for AGIs $75k-100k, 1.3% for AGIs over 100k)
Taxable dividends: $2,745 (reported on 44.2% of returns)
Here:
$2,745
State:
$2,869
(% of AGI for various income ranges: 10.0% for AGIs below $10k, 2.6% for AGIs $10k-25k, 1.6% for AGIs $25k-50k, 1.1% for AGIs $50k-75k, 1.1% for AGIs $75k-100k, 1.2% for AGIs over 100k)
Net capital gain/loss: +$19,009 (reported on 36.1% of returns)
Here:
+$19,009
State:
+$9,569
(% of AGI for various income ranges: -8.5% for AGIs below $10k, 1.3% for AGIs $10k-25k, 0.8% for AGIs $25k-50k, 1.1% for AGIs $50k-75k, 1.4% for AGIs $75k-100k, 10.1% for AGIs over 100k)
Profit/loss from business: +$19,218 (reported on 17.2% of returns)
Here:
+$19,218
State:
+$10,417
(% of AGI for various income ranges: 3.8% for AGIs below $10k, 5.3% for AGIs $10k-25k, 3.9% for AGIs $25k-50k, 5.0% for AGIs $50k-75k, 3.1% for AGIs $75k-100k, 3.3% for AGIs over 100k)
IRA payment deduction: $2,924 (reported on 2.9% of returns)
53593:
$2,924
Wisconsin:
$2,900
(% of AGI for various income ranges: 0.4% for AGIs $10k-25k, 0.3% for AGIs $25k-50k, 0.2% for AGIs $50k-75k, 0.1% for AGIs $75k-100k, 0.0% for AGIs over 100k)
Self-employed pension: $14,302 (reported on 3.0% of returns)
Here:
$14,302
Wisconsin:
$11,934
(% of AGI for various income ranges: 0.2% for AGIs $25k-50k, 0.2% for AGIs $50k-75k, 0.3% for AGIs $75k-100k, 0.6% for AGIs over 100k)
Total itemized deductions: $25,318 (17% of AGI, reported on 57.2% of returns)
Here:
$25,318
State:
$18,160
Here:
17.3% of AGI
State:
21.1% of AGI
(% of AGI for various income ranges: 20.4% for AGIs below $10k, 16.7% for AGIs $10k-25k, 17.5% for AGIs $25k-50k, 20.7% for AGIs $50k-75k, 21.3% for AGIs $75k-100k, 13.7% for AGIs over 100k)
Charity contributions deductions: $3,090 (2% of AGI, reported on 51.1% of returns)
Here:
$3,090
State:
$2,711
Here:
2.0% of AGI
State:
3.0% of AGI
(% of AGI for various income ranges: 1.1% for AGIs below $10k, 1.1% for AGIs $10k-25k, 1.5% for AGIs $25k-50k, 1.7% for AGIs $50k-75k, 1.7% for AGIs $75k-100k, 1.7% for AGIs over 100k)
Total tax: $17,789 (reported on 83.8% of returns)
53593:
$17,789
State:
$7,114
(% of AGI for various income ranges: 4.6% for AGIs below $10k, 5.4% for AGIs $10k-25k, 7.8% for AGIs $25k-50k, 9.0% for AGIs $50k-75k, 9.3% for AGIs $75k-100k, 19.2% for AGIs over 100k)
Earned income credit: $1,362 (reported on 4.3% of returns)
Here:
$1,362
State:
$1,544
Percentage of individuals using paid preparers for their 2004 taxes: 51.6%
Here:
52%
State:
57%
(% for various income ranges: 41.2% for AGIs below $10k, 49.0% for AGIs $10k-25k, 51.5% for AGIs $25k-50k, 54.5% for AGIs $50k-75k, 49.6% for AGIs $75k-100k, 60.1% for AGIs over 100k)
Likely homosexual households (counted as self-reported same-sex unmarried-partner households)
Lesbian couples: 0.0% of all households
Gay men: 0.0% of all households
Household received Food Stamps/SNAP in the past 12 months: 148 Household did not receive Food Stamps/SNAP in the past 12 months: 11,260
Women who had a birth in the past 12 months: 427 (429 now married, 0 unmarried) Women who did not have a birth in the past 12 months: 5,877 (3,453 now married, 2,423 unmarried)
Housing units in zip code 53593 with a mortgage: 6,270 (848 second mortgage, 5 home equity loan, 713 both second mortgage and home equity loan) Houses without a mortgage: 367
Median monthly owner costs for units with a mortgage: $2,322 Median monthly owner costs for units without a mortgage: $924
Residents with income below the poverty level in 2022:
This zip code:
2.1%
Whole state:
10.7%
Residents with income below 50% of the poverty level in 2022:
This zip code:
0.7%
Whole state:
5.7%
Median number of rooms in houses and condos:
Here:
7.5
State:
6.5
Median number of rooms in apartments:
Here:
3.2
State:
4.1
Notable locations in this zip code not listed on our city pages
Notable locations in zip code 53593: Wolf Mink Ranch (A), Appleberry Farm (B), Eplegaarden (C), Fitch - Rona Emergency Medical Services Substation (D), Madison Fire Department Station 12 (E), Middleton Fire District Station 2 (F), Verona Fire Department (G). Display/hide their locations on the map
Parks in zip code 53593 include: Olson Oak Woods State Natural Area (1), Sugar River Wetlands State Natural Area (2), Badger Prairie County Park (3). Display/hide their locations on the map
6,144 married couples with children.
1,039 single-parent households (291 men, 748 women).
91.4% of residents of 53593 zip code speak English at home.
1.7% of residents speak Spanish at home (87% very well, 10% well, 3% not well).
2.8% of residents speak other Indo-European language at home (70% very well, 23% well, 8% not well).
2.9% of residents speak Asian or Pacific Island language at home (74% very well, 10% well, 16% not well).
0.9% of residents speak other language at home (52% very well, 19% well, 30% not well).
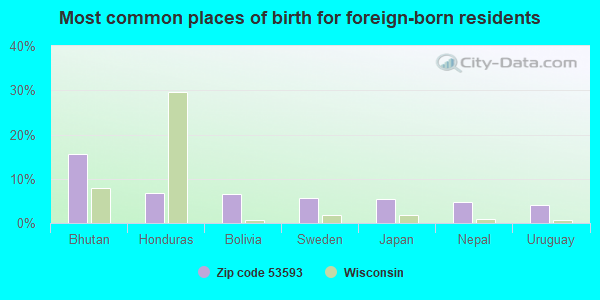
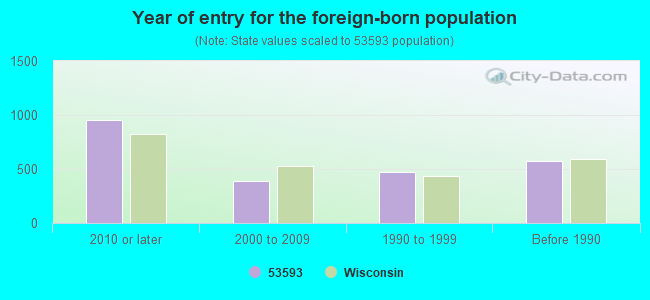
Foreign born population: 1,975 (7.0%) (54.7% of them are naturalized citizens)
This zip code:
7.0%
Whole state:
5.0%
16%Bhutan
7%Honduras
7%Bolivia
6%Sweden
5%Japan
5%Nepal
4%Uruguay
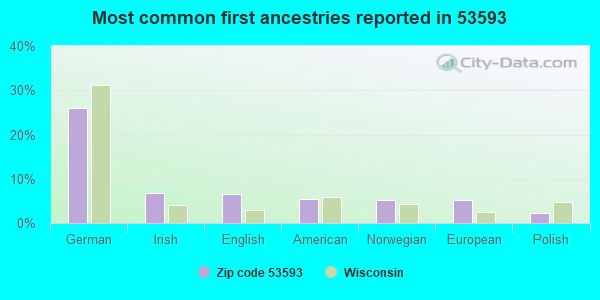
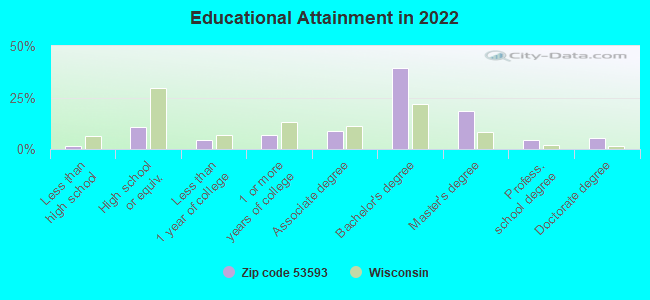
26%German
7%Irish
7%English
5%American
5%Norwegian
5%European
2%Polish
Year of entry for the foreign-born population
9532010 or later
3852000 to 2009
4711990 to 1999
570Before 1990
Facilities with environmental interests located in this zip code:
COATING PLACE INC (200 PAOLI ST BOX 930310 in VERONA, WI)
AIR MAJOR (AIRS/AFS) COMPLIANCE ACTIVITY (Tracking inspections of insecticide, fungicide, and rodenticide, and toxic substances) CRITERIA AND HAZARDOUS AIR POLLUTANT INVENTORY (Inventory of air pollution sources) Small Quantity Generators, between 100 kg and 1000 kg of hazardous waste/month (Resource Conservation and Recovery Act (tracking hazardous waste)) - notification TRI REPORTER (Tracking of toxic chemicals releasing facilities) STATE MASTER (Wisconsin database) - TRIS-53593CTNGP2283H, TRI REPORTER, NEI-WI113020380, AIR PROGRAM, RCRAINFO-WID082809666, SQG Business SIC classification: CHEMICALS AND CHEMICAL PREPARATIONS; COATING, ENGRAVING, AND ALLIED SERVICES; MANUFACTURING INDUSTRIES Business NAICS classification: ALL OTHER MISCELLANEOUS CHEMICAL PRODUCT AND PREPARATION MANUFACTURING.; ALL OTHER MISCELLANEOUS MANUFACTURING.; ALL OTHER MISCELLANEOUS MANUFACTURING.
CARNES COMPANY (448 S MAIN ST in VERONA, WI)
AIR SYNTHETIC MINOR (AIRS/AFS) CRITERIA AND HAZARDOUS AIR POLLUTANT INVENTORY (Inventory of air pollution sources) Small Quantity Generators, between 100 kg and 1000 kg of hazardous waste/month (Resource Conservation and Recovery Act (tracking hazardous waste)) STATE MASTER (Wisconsin database) - NEI-WI113005200, AIR PROGRAM, RCRAINFO-WID006439368, SQG Business SIC classification: SHEET METALWORK; MACHINE TOOLS, METAL CUTTING TYPES Business NAICS classification: SHEET METAL WORK MANUFACTURING.; INDUSTRIAL AND COMMERCIAL FAN AND BLOWER MANUFACTURING.
Small Quantity Generators, between 100 kg and 1000 kg of hazardous waste/month (Resource Conservation and Recovery Act (tracking hazardous waste)) - notification TRANSPORTER (Resource Conservation and Recovery Act (tracking hazardous waste)) - notification STATE MASTER (Wisconsin database) - RCRAINFO-WIR000002170, CESQG Business SIC classification: PAINTING AND PAPER HANGING
AMERICAN METALS INC HAMMERSLEY (6292 LACY RD in VERONA, WI)
(Integrated Compliance Information System) - ICIS-05-1986-0124, FORMAL ENFORCEMENT ACTION COMPLIANCE ACTIVITY (Tracking inspections of insecticide, fungicide, and rodenticide, and toxic substances) Business SIC classification: SCRAP AND WASTE MATERIALS Alternative names: AMERICAN METALS INC.
AG STAT (6394 GRANDVIEW ROAD in VERONA, WI)
COMPLIANCE ACTIVITY (Tracking inspections of insecticide, fungicide, and rodenticide, and toxic substances)
Housing units lacking complete plumbing facilities: 0.2% Housing units lacking complete kitchen facilities: 1.3%
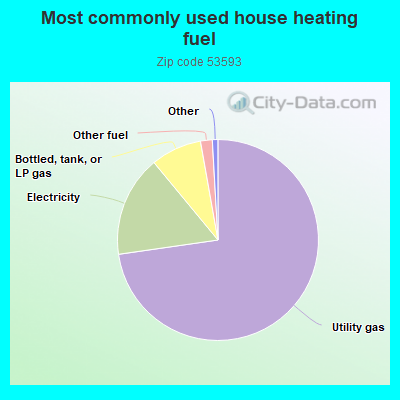
72.8%Utility gas
16.3%Electricity
8.2%Bottled, tank, or LP gas
1.9%Other fuel
Population in 1990: 9,932. Population change in the 1990s: +2,846 (+28.7%).
Place of birth for U.S.-born residents:
This state: 16,570
Northeast: 927
Midwest: 5,620
South: 1,398
West: 1,344
60% of the 53593 zip code residents lived in the same house 5 years ago. Out of people who lived in different houses, 73% lived in this county. Out of people who lived in different counties, 50% lived in Wisconsin.
87% of the 53593 zip code residents lived in the same house 1 year ago. Out of people who lived in different houses, 62% moved from this county. Out of people who lived in different houses, 14% moved from different county within same state. Out of people who lived in different houses, 19% moved from different state. Out of people who lived in different houses, 3% moved from abroad.
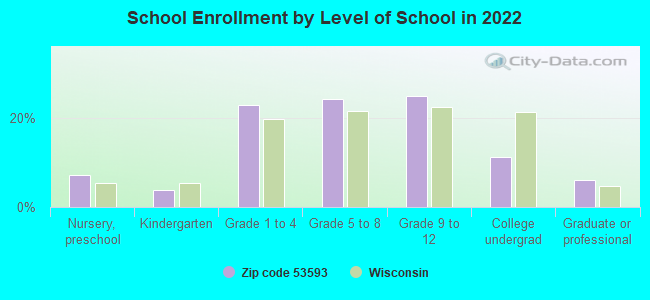
Private vs. public school enrollment:
Students in private schools in grades 1 to 8 (elementary and middle school): 251
Here:
7.8%
Wisconsin:
16.7%
Students in private schools in grades 9 to 12 (high school): 181
Here:
10.6%
Wisconsin:
12.5%
Students in private undergraduate colleges: 58
Here:
7.5%
Wisconsin:
17.5%
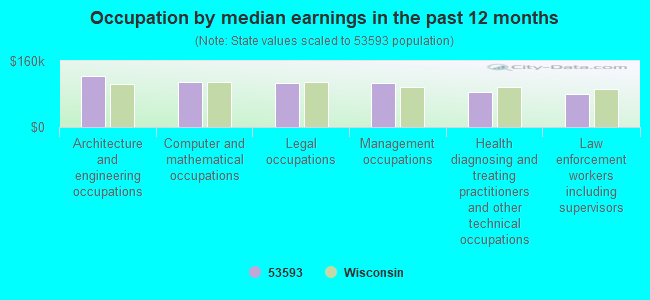
Occupation by median earnings in the past 12 months ($)
122,927Architecture and engineering occupations
109,700Computer and mathematical occupations
105,961Legal occupations
105,881Management occupations
84,377Health diagnosing and treating practitioners and other technical occupations
80,166Law enforcement workers including supervisors
Companies with federal contracts located in this zip code (VERONA, WI):
PARISI CONSTRUCTION CO INC (508 S NINEMOUND RD, STE A; small business) : $868,407 in 23 contractsfrom 2000 to 2002
Contracts for Maintenance, Repair or Alteration of Real Property -- Highways, Roads, Streets, Bridges, and Railways (includes resurfacing) by Army Signed by year:2000: $74,029; 2001: $177,170; 2002: $617,208; 2003: $0; 2004: $0; 2005: $0; 2006: $0.
Biggest contracts:
$273,213 with Army for Maintenance, Repair or Alteration of Real Property -- Highways, Roads, Streets, Bridges, and Railways (includes resurfacing). Signed on 2002-09-24. Completion date: 2003-04-04.
$84,919, same as above.Signed on 2002-09-10. Completion date: 2002-12-06.
$77,304, same as above.Signed on 2001-03-01. Completion date: 2001-07-27.
$66,195, same as above.Signed on 2001-08-22. Completion date: 2002-01-23.
$43,325 with Army for Other Professional Services. Taking place in MD. Signed on 2004-11-08. Completion date: 2005-05-14.
APPLIED SIGNAL PROCESSING INC (1981 N KOLLATH RD; small business)
$24,990 with Navy for ADPE System Configuration. Signed on 2005-07-21. Completion date: 2005-08-30.
SAFETY FIRST INC (312 INVESTMENT CT; small business) : $13,380 in 3 contractsin 2004
$13,380 with Army for Sets, Kits, and Outfits of Hand Tools. Signed on 2004-01-29. Completion date: 2004-03-09.
$13,380, same as above.Signed on 2004-01-28. Completion date: 2004-03-05.
-$13,380, same as above.Signed on 2004-02-12. Completion date: 2004-03-05.
CECOR INCORPORATED (102 LINCOLN ST; small business)
$5,895 with Navy for Miscellaneous Maintenance and Repair Shop Specialized Equipment. Signed on 2005-05-26. Completion date: 2005-06-17.
Top industries in this zip code by the number of employees in 2005:
Construction: Commercial and Institutional Building Construction (100-249 employees: 1 establishment, 20-49 employees: 1 establishment, 10-19 employees: 1 establishment, 1-4 employees: 4 establishments)
Health Care and Social Assistance: Nursing Care Facilities (100-249: 1, 20-49: 1)
2002 - 2018 National Fire Incident Reporting System (NFIRS) incidents
Based on the data from the years 2002 - 2018 the average number of fire incidents per year is 23. The highest number of fire incidents - 56 took place in 2017, and the least - 2 in 2002. The data has a growing trend.
When looking into fire subcategories, the most reports belonged to: Structure Fires (51.2%), and Outside Fires (27.9%).
Fire incident types reported to NFIRS in Zip Code 53593


 Nearest zip codes: 53719, 53717, 53508, 53562, 53528, 53705.


 Based on the data from the years 2002 - 2018 the average number of fire incidents per year is 23. The highest number of fire incidents - 56 took place in 2017, and the least - 2 in 2002. The data has a growing trend.
 When looking into fire subcategories, the most reports belonged to: Structure Fires (51.2%), and Outside Fires (27.9%).