Estimated zip code population in 2022: 23,601 Zip code population in 2010: 22,659 Zip code population in 2000: 16,941
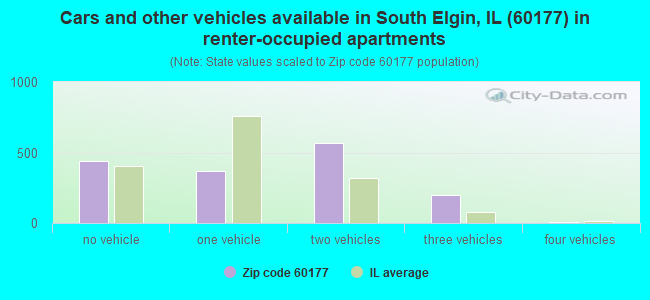
Houses and condos: 8,525 Renter-occupied apartments: 1,606
% of renters here:
19%
State:
33%
March 2022 cost of living index in zip code 60177: 100.9 (near average, U.S. average is 100)
Land area: 8.5 sq. mi. Water area: 0.3 sq. mi.
Population density: 2,762 people per square mile
(average).
OSM Map
General Map
Google Map
MSN Map
OSM Map
General Map
Google Map
MSN Map
OSM Map
General Map
Google Map
MSN Map
OSM Map
General Map
Google Map
MSN Map
Please wait while loading the map...
Real estate property taxes paid for housing units in 2022:
This zip code:
2.3% ($6,802)
Illinois:
2.0% ($4,912)
Median real estate property taxes paid for housing units with mortgages in 2022: $7,018 (2.3%) Median real estate property taxes paid for housing units with no mortgage in 2022: $5,628 (2.0%)
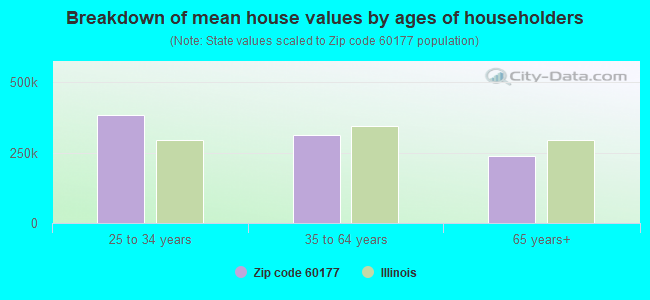
Estimated median house/condo value in 2022: $299,268
60177:
$299,268
Illinois:
$251,600
According to our research of Illinois and other state lists, there were 17 registered sex offenders living in 60177 zip code as of April 27, 2024. The ratio of all residents to sex offenders in zip code 60177 is 1,376 to 1. The ratio of registered sex offenders to all residents in this zip code is lower than the state average.
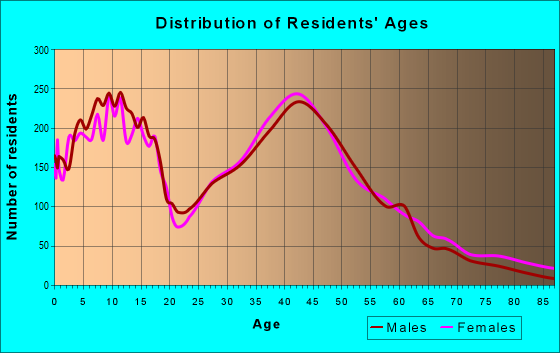
Median resident age:
This zip code:
39.4 years
Illinois median age:
39.1 years
Average household size:
This zip code:
2.8 people
Illinois:
2.4 people
Averages for the 2020 tax year for zip code 60177, filed in 2021:
Average Adjusted Gross Income (AGI) in 2020: $78,180 (Individual Income Tax Returns)
Here:
$78,180
State:
$82,626
Salary/wage: $71,515 (reported on 88.8% of returns)
Here:
$71,515
State:
$66,640
(% of AGI for various income ranges: 1113.8% for AGIs below $25k, 3620.1% for AGIs $25k-50k, 6555.7% for AGIs $50k-75k, 9210.9% for AGIs $75k-100k, 17999.0% for AGIs $100k-200k, 62386.5% for AGIs over 200k)
Taxable interest for individuals: $819 (reported on 26.5% of returns)
This zip code:
$819
Illinois:
$2,376
(% of AGI for various income ranges: 11.7% for AGIs below $25k, 10.9% for AGIs $25k-50k, 22.0% for AGIs $50k-75k, 31.8% for AGIs $75k-100k, 53.1% for AGIs $100k-200k, 202.9% for AGIs over 200k)
Ordinary dividends: $3,009 (reported on 19.6% of returns)
Here:
$3,009
State:
$9,061
(% of AGI for various income ranges: 17.1% for AGIs below $25k, 36.0% for AGIs $25k-50k, 47.9% for AGIs $50k-75k, 80.9% for AGIs $75k-100k, 114.8% for AGIs $100k-200k, 865.2% for AGIs over 200k)
Net capital gain/loss in AGI: +$10,268 (reported on 18.0% of returns)
Here:
+$10,268
State:
+$31,684
(% of AGI for various income ranges: 7.0% for AGIs below $25k, 32.4% for AGIs $25k-50k, 42.9% for AGIs $50k-75k, 85.9% for AGIs $75k-100k, 220.8% for AGIs $100k-200k, 5414.8% for AGIs over 200k)
Profit/loss from business: +$10,462 (reported on 13.4% of returns)
Here:
+$10,462
State:
+$12,175
(% of AGI for various income ranges: 75.0% for AGIs below $25k, 107.3% for AGIs $25k-50k, 113.2% for AGIs $50k-75k, 139.9% for AGIs $75k-100k, 290.8% for AGIs $100k-200k, 1729.4% for AGIs over 200k)
Taxable individual retirement arrangement distribution: $17,016 (reported on 7.1% of returns)
60177:
$17,016
Illinois:
$21,613
(% of AGI for various income ranges: 58.6% for AGIs below $25k, 95.0% for AGIs $25k-50k, 104.7% for AGIs $50k-75k, 185.0% for AGIs $75k-100k, 307.2% for AGIs $100k-200k, 978.1% for AGIs over 200k)
Self-employed (Keogh) retirement plans: $19,180 (reported on 0.4% of returns)
60177:
$19,180
Illinois:
$30,962
(% of AGI for various income ranges: 15.7% for AGIs $50k-75k, 234.5% for AGIs over 200k)
Total itemized deductions: $26,073 (reported on 11.1% of returns)
Here:
$26,073
State:
$34,948
(% of AGI for various income ranges: 50.0% for AGIs below $25k, 144.9% for AGIs $25k-50k, 355.6% for AGIs $50k-75k, 531.6% for AGIs $75k-100k, 763.7% for AGIs $100k-200k, 2639.0% for AGIs over 200k)
Charity contributions: $6,105 (reported on 8.5% of returns)
Here:
$6,105
State:
$13,122
(% of AGI for various income ranges: 2.5% for AGIs below $25k, 14.4% for AGIs $25k-50k, 30.9% for AGIs $50k-75k, 68.4% for AGIs $75k-100k, 143.6% for AGIs $100k-200k, 812.9% for AGIs over 200k)
Taxes paid: $8,875 (reported on 10.9% of returns)
60177:
$8,875
State:
$8,563
(% of AGI for various income ranges: 11.4% for AGIs below $25k, 48.5% for AGIs $25k-50k, 137.0% for AGIs $50k-75k, 213.1% for AGIs $75k-100k, 258.4% for AGIs $100k-200k, 719.7% for AGIs over 200k)
Earned income credit: $2,115 (reported on 9.1% of returns)
Here:
$2,115
State:
$2,311
(% of AGI for various income ranges: 55.1% for AGIs below $25k, 48.8% for AGIs $25k-50k)
Percentage of individuals using paid preparers for their 2020 taxes: 94.3%
Here:
94%
State:
93%
(% for various income ranges: 92.6% for AGIs below $25k, 93.2% for AGIs $25k-50k, 95.2% for AGIs $50k-75k, 94.7% for AGIs $75k-100k, 96.1% for AGIs $100k-200k, 96.1% for AGIs over 200k)
Averages for the 2012 tax year for zip code 60177, filed in 2013:
Average Adjusted Gross Income (AGI) in 2012: $67,217 (Individual Income Tax Returns)
Here:
$67,217
State:
$68,058
Salary/wage: $62,987 (reported on 90.1% of returns)
Here:
$62,987
State:
$55,396
(% of AGI for various income ranges: 76.8% for AGIs below $25k, 84.2% for AGIs $25k-50k, 86.0% for AGIs $50k-75k, 87.5% for AGIs $75k-100k, 88.6% for AGIs $100k-200k, 74.3% for AGIs over 200k)
Taxable interest for individuals: $575 (reported on 34.8% of returns)
This zip code:
$575
Illinois:
$1,969
(% of AGI for various income ranges: 0.8% for AGIs below $25k, 0.4% for AGIs $25k-50k, 0.2% for AGIs $50k-75k, 0.3% for AGIs $75k-100k, 0.2% for AGIs $100k-200k, 0.3% for AGIs over 200k)
Ordinary dividends: $2,417 (reported on 20.8% of returns)
Here:
$2,417
State:
$7,786
(% of AGI for various income ranges: 1.3% for AGIs below $25k, 0.5% for AGIs $25k-50k, 0.5% for AGIs $50k-75k, 0.4% for AGIs $75k-100k, 0.4% for AGIs $100k-200k, 1.8% for AGIs over 200k)
Net capital gain/loss in AGI: +$3,713 (reported on 15.3% of returns)
Here:
+$3,713
State:
+$22,183
(% of AGI for various income ranges: 0.2% for AGIs $75k-100k, 0.3% for AGIs $100k-200k, 3.9% for AGIs over 200k)
Profit/loss from business: +$11,683 (reported on 13.0% of returns)
Here:
+$11,683
State:
+$12,903
(% of AGI for various income ranges: 6.6% for AGIs below $25k, 2.5% for AGIs $25k-50k, 1.8% for AGIs $50k-75k, 1.3% for AGIs $75k-100k, 1.9% for AGIs $100k-200k, 2.9% for AGIs over 200k)
Taxable individual retirement arrangement distribution: $13,816 (reported on 8.4% of returns)
60177:
$13,816
Illinois:
$17,929
(% of AGI for various income ranges: 3.3% for AGIs below $25k, 1.8% for AGIs $25k-50k, 1.8% for AGIs $50k-75k, 1.7% for AGIs $75k-100k, 1.6% for AGIs $100k-200k, 1.3% for AGIs over 200k)
Self-employment retirement plans: $12,900 (reported on 0.5% of returns)
60177:
$12,900
Illinois:
$24,666
Total itemized deductions: $23,372 (23% of AGI, reported on 52.0% of returns)
Here:
$23,372
State:
$26,433
Here:
22.7% of AGI
State:
19.2% of AGI
(% of AGI for various income ranges: 15.4% for AGIs below $25k, 16.2% for AGIs $25k-50k, 20.5% for AGIs $50k-75k, 19.8% for AGIs $75k-100k, 19.1% for AGIs $100k-200k, 14.5% for AGIs over 200k)
Charity contributions: $2,511 (reported on 44.5% of returns)
Here:
$2,511
State:
$4,525
(% of AGI for various income ranges: 0.8% for AGIs below $25k, 1.2% for AGIs $25k-50k, 1.4% for AGIs $50k-75k, 1.7% for AGIs $75k-100k, 1.8% for AGIs $100k-200k, 2.1% for AGIs over 200k)
Taxes paid: $10,618 (reported on 52.0% of returns)
60177:
$10,618
State:
$11,968
(% of AGI for various income ranges: 4.7% for AGIs below $25k, 6.2% for AGIs $25k-50k, 8.6% for AGIs $50k-75k, 8.7% for AGIs $75k-100k, 9.2% for AGIs $100k-200k, 7.8% for AGIs over 200k)
Earned income credit: $2,022 (reported on 11.2% of returns)
Here:
$2,022
State:
$2,349
(% of AGI for various income ranges: 4.6% for AGIs below $25k, 0.9% for AGIs $25k-50k)
Percentage of individuals using paid preparers for their 2012 taxes: 53.5%
Here:
53%
State:
57%
(% for various income ranges: 47.5% for AGIs below $25k, 55.4% for AGIs $25k-50k, 56.1% for AGIs $50k-75k, 54.7% for AGIs $75k-100k, 55.6% for AGIs $100k-200k, 67.5% for AGIs over 200k)
Averages for the 2004 tax year for zip code 60177, filed in 2005:
Average Adjusted Gross Income (AGI) in 2004: $61,937 (Individual Income Tax Returns)
Here:
$61,937
State:
$54,625
Salary/wage: $59,477 (reported on 91.9% of returns)
Here:
$59,477
State:
$46,811
(% of AGI for various income ranges: 124.4% for AGIs below $10k, 76.3% for AGIs $10k-25k, 87.4% for AGIs $25k-50k, 90.3% for AGIs $50k-75k, 92.0% for AGIs $75k-100k, 86.2% for AGIs over 100k)
Taxable interest for individuals: $701 (reported on 53.1% of returns)
This zip code:
$701
Illinois:
$2,101
(% of AGI for various income ranges: 4.9% for AGIs below $10k, 2.3% for AGIs $10k-25k, 0.8% for AGIs $25k-50k, 0.4% for AGIs $50k-75k, 0.4% for AGIs $75k-100k, 0.5% for AGIs over 100k)
Taxable dividends: $1,167 (reported on 26.3% of returns)
Here:
$1,167
State:
$4,306
(% of AGI for various income ranges: 3.5% for AGIs below $10k, 1.3% for AGIs $10k-25k, 0.5% for AGIs $25k-50k, 0.4% for AGIs $50k-75k, 0.3% for AGIs $75k-100k, 0.5% for AGIs over 100k)
Net capital gain/loss: +$4,055 (reported on 20.0% of returns)
Here:
+$4,055
State:
+$17,321
(% of AGI for various income ranges: -0.3% for AGIs below $10k, -0.3% for AGIs $10k-25k, -0.0% for AGIs $25k-50k, 0.3% for AGIs $50k-75k, 0.4% for AGIs $75k-100k, 2.9% for AGIs over 100k)
Profit/loss from business: +$9,607 (reported on 13.5% of returns)
Here:
+$9,607
State:
+$11,771
(% of AGI for various income ranges: 8.5% for AGIs below $10k, 5.3% for AGIs $10k-25k, 2.8% for AGIs $25k-50k, 1.7% for AGIs $50k-75k, 1.2% for AGIs $75k-100k, 2.1% for AGIs over 100k)
IRA payment deduction: $2,932 (reported on 2.4% of returns)
60177:
$2,932
Illinois:
$3,087
(% of AGI for various income ranges: 0.2% for AGIs $10k-25k, 0.2% for AGIs $25k-50k, 0.1% for AGIs $50k-75k, 0.1% for AGIs $75k-100k, 0.1% for AGIs over 100k)
Self-employed pension: $12,653 (reported on 0.5% of returns)
Here:
$12,653
Illinois:
$16,965
Total itemized deductions: $20,352 (24% of AGI, reported on 61.9% of returns)
Here:
$20,352
State:
$20,239
Here:
24.2% of AGI
State:
19.5% of AGI
(% of AGI for various income ranges: 27.5% for AGIs below $10k, 19.0% for AGIs $10k-25k, 21.3% for AGIs $25k-50k, 22.8% for AGIs $50k-75k, 22.3% for AGIs $75k-100k, 18.0% for AGIs over 100k)
Charity contributions deductions: $2,179 (3% of AGI, reported on 56.4% of returns)
Here:
$2,179
State:
$3,719
Here:
2.5% of AGI
State:
3.4% of AGI
(% of AGI for various income ranges: 1.1% for AGIs below $10k, 1.4% for AGIs $10k-25k, 1.9% for AGIs $25k-50k, 2.0% for AGIs $50k-75k, 2.1% for AGIs $75k-100k, 2.0% for AGIs over 100k)
Total tax: $8,093 (reported on 83.4% of returns)
60177:
$8,093
State:
$9,882
(% of AGI for various income ranges: 3.6% for AGIs below $10k, 4.2% for AGIs $10k-25k, 6.9% for AGIs $25k-50k, 7.9% for AGIs $50k-75k, 8.8% for AGIs $75k-100k, 15.4% for AGIs over 100k)
Earned income credit: $1,610 (reported on 7.3% of returns)
Here:
$1,610
State:
$1,788
Percentage of individuals using paid preparers for their 2004 taxes: 56.7%
Here:
57%
State:
61%
(% for various income ranges: 43.5% for AGIs below $10k, 56.7% for AGIs $10k-25k, 57.2% for AGIs $25k-50k, 61.0% for AGIs $50k-75k, 59.6% for AGIs $75k-100k, 58.5% for AGIs over 100k)
Household received Food Stamps/SNAP in the past 12 months: 404 Household did not receive Food Stamps/SNAP in the past 12 months: 7,954
Women who had a birth in the past 12 months: 276 (198 now married, 77 unmarried) Women who did not have a birth in the past 12 months: 5,391 (2,862 now married, 2,501 unmarried)
Housing units in zip code 60177 with a mortgage: 5,378 (446 second mortgage, 13 home equity loan, 312 both second mortgage and home equity loan) Houses without a mortgage: 19
Median monthly owner costs for units with a mortgage: $1,978 Median monthly owner costs for units without a mortgage: $830
Residents with income below the poverty level in 2022:
This zip code:
5.7%
Whole state:
11.9%
Residents with income below 50% of the poverty level in 2022:
This zip code:
4.0%
Whole state:
5.7%
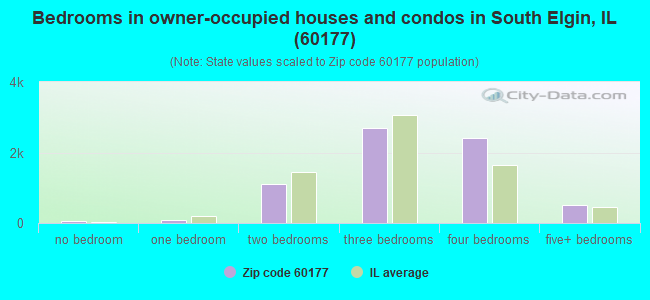
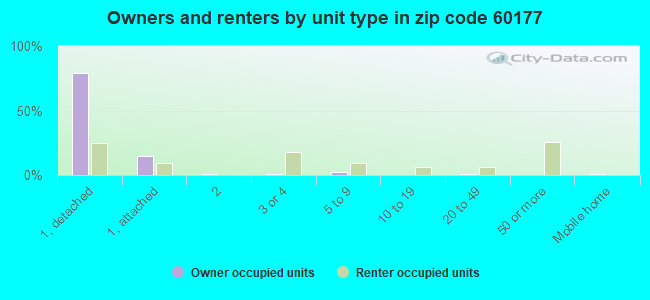
Median number of rooms in houses and condos:
Here:
7.2
State:
6.4
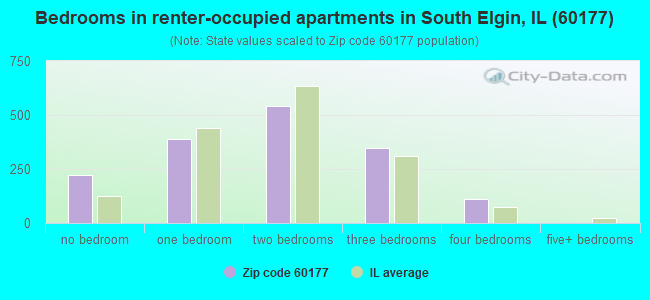
Median number of rooms in apartments:
Here:
3.6
State:
4.1
Notable locations in this zip code not listed on our city pages
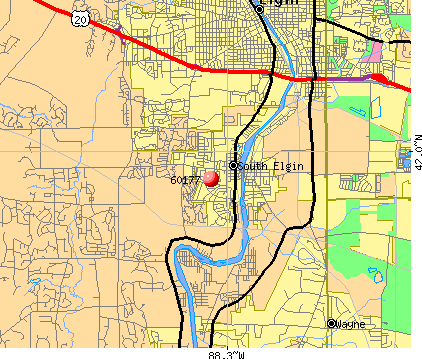
Notable locations in zip code 60177: South Elgin and Countryside Fire Protection District Station 2 (A), South Elgin and Countryside Fire Protection District Station 1 (B). Display/hide their locations on the map
Churches in zip code 60177 include: Community Center Church of God (A), Kane County Baptist Church (B), South Elgin Community United Church (C). Display/hide their locations on the map
Parks in zip code 60177 include: Concord Park (1), Blackhawk County Forest Preserve (2), Kenyon Farm County Forest Preserve (3), Robert Sperry Park (4), Lions Park (5), Panton Mill Park (6), Pickeral Park (7), Seba Park (8), Vasa Park (9). Display/hide their locations on the map
4,361 married couples with children.
844 single-parent households (361 men, 483 women).
74.7% of residents of 60177 zip code speak English at home.
13.9% of residents speak Spanish at home (68% very well, 24% well, 7% not well, 1% not at all).
6.6% of residents speak other Indo-European language at home (81% very well, 6% well, 12% not well, 2% not at all).
4.1% of residents speak Asian or Pacific Island language at home (50% very well, 24% well, 20% not well, 5% not at all).
0.3% of residents speak other language at home (100% very well).
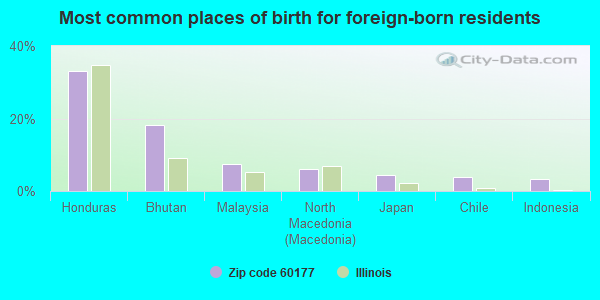
Foreign born population: 3,360 (14.2%) (74.1% of them are naturalized citizens)
This zip code:
14.2%
Whole state:
14.4%
33%Honduras
18%Bhutan
8%Malaysia
6%North Macedonia (Macedonia)
4%Japan
4%Chile
3%Indonesia
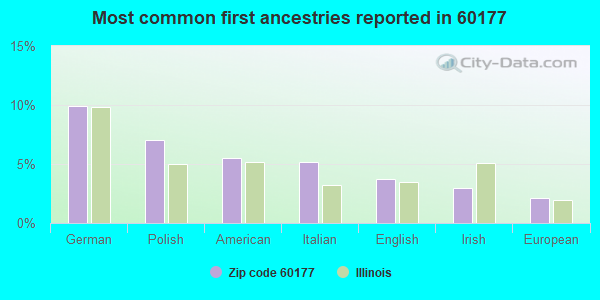
10%German
7%Polish
5%American
5%Italian
4%English
3%Irish
2%European
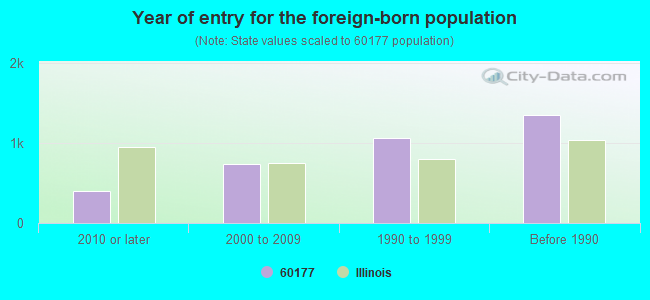
Year of entry for the foreign-born population
4042010 or later
7372000 to 2009
1,0591990 to 1999
1,353Before 1990
Major facilities with environmental interests located in this zip code:
HEAD INC (201 N. CENTER ST. in SOUTH ELGIN, IL)
STATE MASTER (Illinois EPA Project) - SOLID WASTE PROGRAM, HAZARDOUS WASTE PROGRAM, AIR PROGRAM STATE MASTER (Illinois EPA Project) - National Pollutant Discharge Elimination System Permit AIR MINOR (AIRS/AFS) CRITERIA AND HAZARDOUS AIR POLLUTANT INVENTORY (Inventory of air pollution sources) National Pollutant Discharge Elimination System NON-MAJOR (Tracking pollutant discharge elimination systems) - permit National Pollutant Discharge Elimination System NON-MAJOR (Tracking pollutant discharge elimination systems) - permit Small Quantity Generators, between 100 kg and 1000 kg of hazardous waste/month (Resource Conservation and Recovery Act (tracking hazardous waste)) TRI REPORTER (Tracking of toxic chemicals releasing facilities) Business SIC classification: SCREW MACHINE PRODUCTS; BOLTS, NUTS, SCREWS, RIVETS, AND WASHERS; NONCLASSIFIABLE ESTABLISHMENTS Alternative names: HEAD INC-SOUTH ELGIN
CUSTOM ALUMINUM PRODUCTS INC (414 WEST DIVISION STREET in SOUTH ELGIN, IL)
STATE MASTER (Illinois EPA Project) - National Pollutant Discharge Elimination System Permit AIR MAJOR (AIRS/AFS) CRITERIA AND HAZARDOUS AIR POLLUTANT INVENTORY (Inventory of air pollution sources) National Pollutant Discharge Elimination System NON-MAJOR (Tracking pollutant discharge elimination systems) - permit HAZARDOUS WASTE BIENNIAL REPORTER (Resource Conservation and Recovery Act (tracking hazardous waste)) Small Quantity Generators, between 100 kg and 1000 kg of hazardous waste/month (Resource Conservation and Recovery Act (tracking hazardous waste)) TRI REPORTER (Tracking of toxic chemicals releasing facilities) Business SIC classification: ALUMINUM EXTRUDED PRODUCTS Business NAICS classification: ALUMINUM EXTRUDED PRODUCT MANUFACTURING.; ALUMINUM EXTRUDED PRODUCT MANUFACTURING. Organizations: CUSTOM ALUMINUM PRODUCTS INC. (CONTACT/OWNER)
HOFFER PLASTICS CORP (500 N COLLINS ST in SOUTH ELGIN, IL)
STATE MASTER (Illinois EPA Project) - SOLID WASTE PROGRAM, HAZARDOUS WASTE PROGRAM, AIR PROGRAM, National Pollutant Discharge Elimination System Permit AIR SYNTHETIC MINOR (AIRS/AFS) CRITERIA AND HAZARDOUS AIR POLLUTANT INVENTORY (Inventory of air pollution sources) National Pollutant Discharge Elimination System NON-MAJOR (Tracking pollutant discharge elimination systems) - permit HAZARDOUS WASTE BIENNIAL REPORTER (Resource Conservation and Recovery Act (tracking hazardous waste)) Small Quantity Generators, between 100 kg and 1000 kg of hazardous waste/month (Resource Conservation and Recovery Act (tracking hazardous waste)) - notification Business SIC classification: PLASTICS PRODUCTS Business NAICS classification: ALL OTHER PLASTICS PRODUCT MANUFACTURING. Alternative names: HOFFER PLASTICS CORPORATION COLLINS SAINT PLANT, HOFFER PLASTICS CORP.-S. ELGIN
HOFFER PLASTICS CORP (400 CENTER STREET in SOUTH ELGIN, IL)
STATE MASTER (Illinois EPA Project) - HAZARDOUS WASTE PROGRAM, AIR PROGRAM, National Pollutant Discharge Elimination System Permit AIR MINOR (AIRS/AFS) CRITERIA AND HAZARDOUS AIR POLLUTANT INVENTORY (Inventory of air pollution sources) Small Quantity Generators, between 100 kg and 1000 kg of hazardous waste/month (Resource Conservation and Recovery Act (tracking hazardous waste)) - notification Business SIC classification: PLASTICS PRODUCTS Organizations: HOFFER ROBERT (CONTACT/OWNER)
MARBLE WORKS (1601 N LAFOX in SOUTH ELGIN, IL)
STATE MASTER (Illinois EPA Project) - AIR PROGRAM, HAZARDOUS WASTE PROGRAM AIR MINOR (AIRS/AFS) CRITERIA AND HAZARDOUS AIR POLLUTANT INVENTORY (Inventory of air pollution sources) Small Quantity Generators, between 100 kg and 1000 kg of hazardous waste/month (Resource Conservation and Recovery Act (tracking hazardous waste)) Business SIC classification: PLASTICS PLUMBING FIXTURES Organizations: WEINMAR INC (CONTACT/OPERATOR)
, TOM WIENCKOWSKI (CONTACT/OWNER)
Alternative names: TOM WIENCKOWSKI
METAL ENHANCERS (365 INDUSTRIAL DRIVE in SOUTH ELGIN, IL)
STATE MASTER (Illinois EPA Project) - HAZARDOUS WASTE PROGRAM, AIR PROGRAM AIR MINOR (AIRS/AFS) (Resource Conservation and Recovery Act (tracking hazardous waste)) Business SIC classification: NONCLASSIFIABLE ESTABLISHMENTS
ANDERSON ANIMAL SHELTER (1000 S LAFOX in SOUTH ELGIN, IL)
STATE MASTER (Illinois EPA Project) - SOLID WASTE PROGRAM, AIR PROGRAM AIR MINOR (AIRS/AFS) CRITERIA AND HAZARDOUS AIR POLLUTANT INVENTORY (Inventory of air pollution sources) Business SIC classification: ANIMAL SPECIALTIES
BLUFF CITY MATERIALS INC (1155 W. MIDDLE ST. in SOUTH ELGIN, IL)
STATE MASTER (Illinois EPA Project) - AIR PROGRAM AIR MINOR (AIRS/AFS) CRITERIA AND HAZARDOUS AIR POLLUTANT INVENTORY (Inventory of air pollution sources) Business SIC classification: CRUSHED AND BROKEN STONE
LIZ CLEANERS (341 RANDALL RD in SOUTH ELGIN, IL)
STATE MASTER (Illinois EPA Project) - AIR PROGRAM AIR MINOR (AIRS/AFS) CRITERIA AND HAZARDOUS AIR POLLUTANT INVENTORY (Inventory of air pollution sources) Business SIC classification: DRYCLEANING PLANTS, EXCEPT RUG CLEANING Alternative names: GEE HUN LEE
MR BS MARINE (1790 GILPEN in SOUTH ELGIN, IL)
STATE MASTER (Illinois EPA Project) - SOLID WASTE PROGRAM Small Quantity Generators, between 100 kg and 1000 kg of hazardous waste/month (Resource Conservation and Recovery Act (tracking hazardous waste)) - notification
NEWMAN OIL CO (365 N WOODBURY in SOUTH ELGIN, IL)
STATE MASTER (Illinois EPA Project) - AIR PROGRAM AIR MINOR (AIRS/AFS) Business SIC classification: PETROLEUM BULK STATIONS AND TERMINALS Alternative names: RICHARD E NEWMAN
D&B GRAPHICS SERVICE (376 SUNDOWN RD in SOUTH ELGIN, IL)
STATE MASTER (Illinois EPA Project) - HAZARDOUS WASTE PROGRAM Small Quantity Generators, between 100 kg and 1000 kg of hazardous waste/month (Resource Conservation and Recovery Act (tracking hazardous waste))
ARTHUR J LOOTENS & SONS INC (35 W 460 RT 31 in SOUTH ELGIN, IL)
STATE MASTER (Illinois EPA Project) - AIR PROGRAM AIR MINOR (AIRS/AFS) Business SIC classification: WRECKING AND DEMOLITION WORK
Housing units lacking complete plumbing facilities: 0.3% Housing units lacking complete kitchen facilities: 3.0%
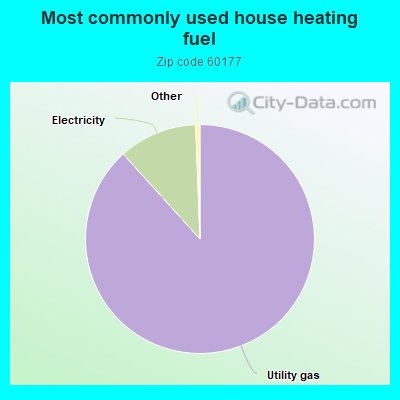
88.4%Utility gas
11.1%Electricity
Population in 1990: 9,117. Population change in the 1990s: +7,824 (+85.8%).
Place of birth for U.S.-born residents:
This state: 16,422
Northeast: 241
Midwest: 1,455
South: 1,374
West: 408
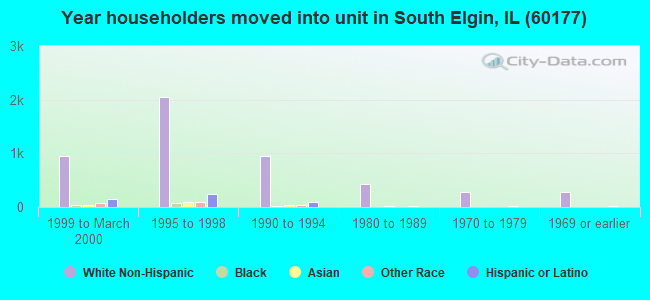
42% of the 60177 zip code residents lived in the same house 5 years ago. Out of people who lived in different houses, 39% lived in this county. Out of people who lived in different counties, 50% lived in Illinois.
91% of the 60177 zip code residents lived in the same house 1 year ago. Out of people who lived in different houses, 32% moved from this county. Out of people who lived in different houses, 68% moved from different county within same state. Out of people who lived in different houses, 1% moved from different state. Out of people who lived in different houses, 1% moved from abroad.
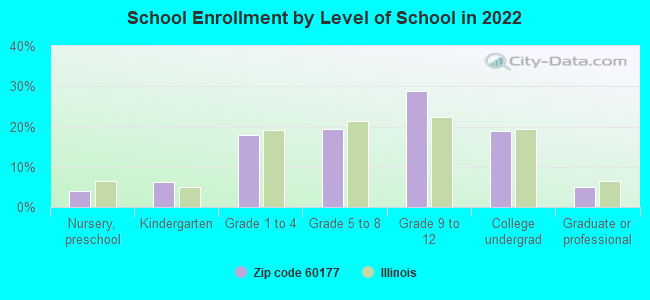
Private vs. public school enrollment:
Students in private schools in grades 1 to 8 (elementary and middle school): 100
Here:
4.3%
Illinois:
13.3%
Students in private schools in grades 9 to 12 (high school): 119
Here:
6.5%
Illinois:
9.9%
Students in private undergraduate colleges: 166
Here:
14.0%
Illinois:
27.4%
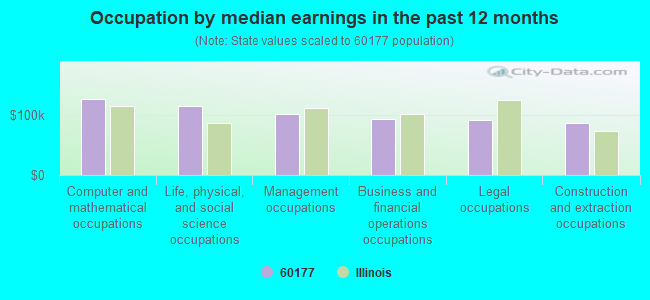
Occupation by median earnings in the past 12 months ($)
127,120Computer and mathematical occupations
115,884Life, physical, and social science occupations
101,852Management occupations
93,241Business and financial operations occupations
91,534Legal occupations
86,288Construction and extraction occupations
Companies with federal contracts located in this zip code:
RED CLOUD FOOD SERVICE, INC (740 SCHNEIDER DRIVE in SOUTH ELGIN, IL; small business) : $9,333,169 in 3 contractsin 2005
$4,547,949 with Defense Logistics Agency for Special Dietary Foods and Food Specialty Preparations. Signed on 2005-10-28. Completion date: 2005-10-31.
$2,484,820, same as above.Signed on 2005-09-30. Completion date: 2005-09-30.
$2,300,400, same as above.Signed on 2005-09-26. Completion date: 2005-09-26.
KINETIC BEI, LLC (2197 BROOKWOOD DR in SOUTH ELGIN, IL; small business) : $769,779 in 3 contractsfrom 2003 to 2006
$358,068 with Army for Other Defense -- Operational Systems Development (R&D). Signed on 2004-03-16. Completion date: 2005-08-05.
$311,776, same as above.Signed on 2003-08-06. Completion date: 2005-08-05.
$99,935 with Air Force for Defense Aircraft -- Applied Research and Exploratory Development (R&D). Signed on 2006-04-03. Completion date: 2007-01-03.
KINETIC RESEARCH & DEVELOPMENT (2197 BROOKWOOD DR in SOUTH ELGIN, IL; small business) : $117,965 in 2 contractsfrom 2001 to 2002
$68,081 with Army for Other Defense -- Management and Support (R&D). Signed on 2001-05-31. Completion date: 2002-03-27.
$49,884, same as above.Signed on 2002-09-26. Completion date: 2003-01-26.
Top industries in this zip code by the number of employees in 2005:
2002 - 2018 National Fire Incident Reporting System (NFIRS) incidents
According to the data from the years 2002 - 2018 the average number of fires per year is 65. The highest number of fires - 89 took place in 2010, and the least - 45 in 2018. The data has a decreasing trend.
When looking into fire subcategories, the most reports belonged to: Structure Fires (45.9%), and Outside Fires (41.3%).
Fire incident types reported to NFIRS in Zip Code 60177


 Nearest zip codes: 60123, 60174, 60184, 60120, 60175, 60124.
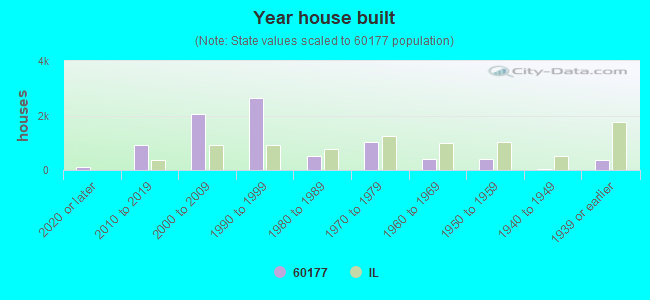


 According to the data from the years 2002 - 2018 the average number of fires per year is 65. The highest number of fires - 89 took place in 2010, and the least - 45 in 2018. The data has a decreasing trend.
 When looking into fire subcategories, the most reports belonged to: Structure Fires (45.9%), and Outside Fires (41.3%).