Bartlett, Illinois
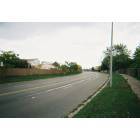
Bartlett: Bartlett, IL - Newport Blvd/Newport LN - This Was Predominently A Wheat And Cornfield Throughout The 1970's and Early 1980's. Newly Developed Home Subdivisions Built Sometime In The Late 1980's And Early 1990's Gobbled Up Any Or Of This Existing Parcel Of Farmland In Bartlett Which Was Once Known As Farmland.
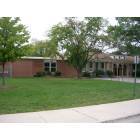
Bartlett: Bartlett Elementary School
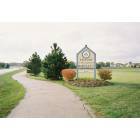
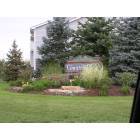
Bartlett: Village Of Bartlett, IL Sign - Just Off Stearns Rd

Bartlett: Rainbow over Bartlett
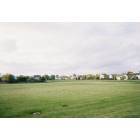
Bartlett: Open Field In Bartlett, IL - Just Off Stearns Rd
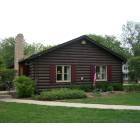
Bartlett: Bartlett Log Downtown
Bartlett: Bartlett Sub Division
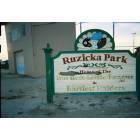
Bartlett: Bartlett, IL - Ruzicka Park sign. Home Of the Bartlett Little League. Just off Newport Ln.
- add
your
Submit your own pictures of this village and show them to the world
- OSM Map
- General Map
- Google Map
- MSN Map
Population change since 2000: +9.4%
 |
| Males: 20,203 | |
| Females: 19,951 |
| Median resident age: | 41.8 years |
| Illinois median age: | 39.1 years |
Zip codes: 60103, 60107, 60120, 60133, 60177, 60184, 60185.
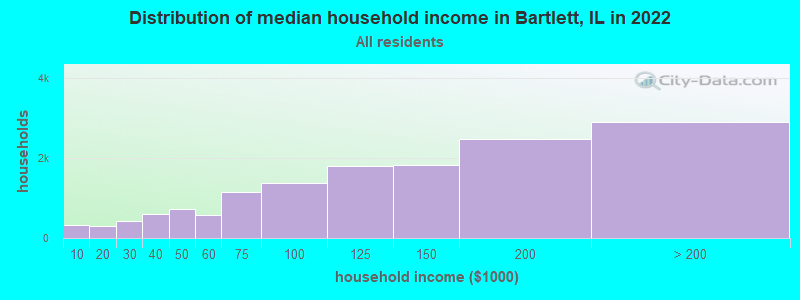
Bartlett Zip Code Map| Bartlett: | $123,853 |
| IL: | $76,708 |
Estimated per capita income in 2022: $50,118 (it was $29,652 in 2000)
Bartlett village income, earnings, and wages data
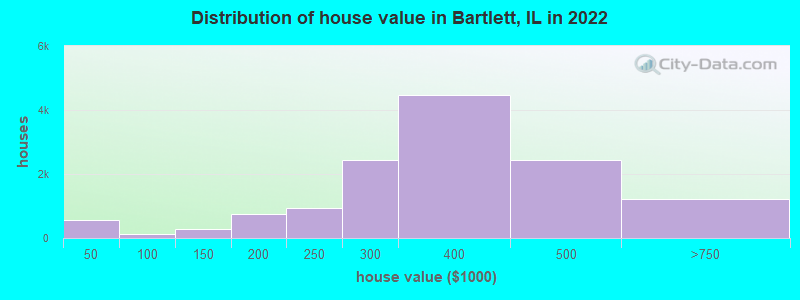
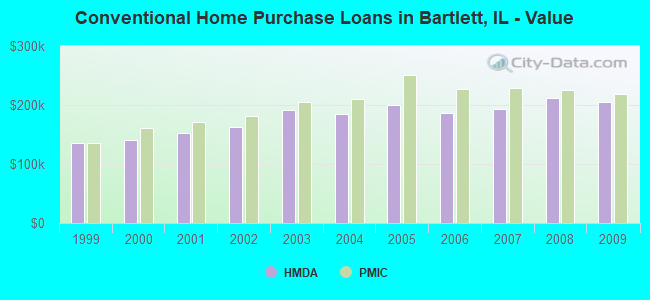
Estimated median house or condo value in 2022: $343,372 (it was $198,600 in 2000)
| Bartlett: | $343,372 |
| IL: | $251,600 |
Mean prices in 2022: all housing units: $324,307; detached houses: $362,181; townhouses or other attached units: $240,959; in 3-to-4-unit structures: $232,778; in 5-or-more-unit structures: $176,343; mobile homes: $27,004
Median gross rent in 2022: $1,909.
(2.0% for White Non-Hispanic residents, 1.6% for Black residents, 4.2% for Hispanic or Latino residents, 4.7% for other race residents, 7.0% for two or more races residents)
Detailed information about poverty and poor residents in Bartlett, IL


Compare current foreclosures in Bartlett, IL:
| Photo | Address | Area | Beds / Baths | Price | Details |
|---|---|---|---|---|---|

|
#1
Norwich Dr
Bartlett, IL 60103
|
1,842 sq. feet
|
2 baths - beds |
show details | |

|
#2
Bayberry Dr
Bartlett, IL 60103
|
1,734 sq. feet
|
2 baths - beds |
show details | |

|
#3
Cummings Dr
Bartlett, IL 60103
|
1,593 sq. feet
|
2 baths - beds |
show details | |

|
#4
S Hale Ave
Bartlett, IL 60103
|
1,090 sq. feet
|
1 baths - beds |
show details | |

|
#5
N Tatge Ave
Bartlett, IL 60103
|
1,176 sq. feet
|
1 baths - beds |
show details | |

|
#6
Pinoak Dr
Bartlett, IL 60103
|
1,774 sq. feet
|
2 baths - beds |
show details | |

|
#7
Snow Drift Ct
Bartlett, IL 60103
|
1,531 sq. feet
|
2 baths - beds |
show details | |

|
#8
Golf View Dr
Bartlett, IL 60103
|
1,820 sq. feet
|
2 baths - beds |
show details | |

|
#9
Oakmont Dr
Bartlett, IL 60103
|
1,867 sq. feet
|
2 baths - beds |
show details | |

|
#10
W Morse Ave
Bartlett, IL 60103
|
2,610 sq. feet
|
2 baths - beds |
show details |
| Photo | Address | Area | Beds / Baths | Price | Details |
|---|---|---|---|---|---|

|
#11
Norwich Dr
Bartlett, IL 60103
|
2,092 sq. feet
|
2 baths - beds |
show details | |

|
#12
Monarch Birch Ln
Bartlett, IL 60103
|
1,497 sq. feet
|
1 baths - beds |
show details | |

|
#13
Snow Drift Ct
Bartlett, IL 60103
|
1,425 sq. feet
|
3 baths - beds |
show details | |

|
#14
N Hickory Ave
Bartlett, IL 60103
|
1,404 sq. feet
|
1 baths - beds |
show details | |

|
#15
Grovetown Dr
Bartlett, IL 60103
|
2,408 sq. feet
|
2 baths - beds |
show details | |

|
#16
Bradbury Ln
Bartlett, IL 60103
|
1,531 sq. feet
|
2 baths - beds |
show details | |

|
#17
Dorchester Ln
Bartlett, IL 60103
|
- sq. feet
|
- baths - beds |
show details | |

|
#18
Thomas Ct Unit C
Bartlett, IL 60103
|
- sq. feet
|
- baths - beds |
show details | |

|
#19
Helen Dr
Bartlett, IL 60103
|
- sq. feet
|
- baths - beds |
show details | |

|
#20
Abbott Ct
Bartlett, IL 60103
|
- sq. feet
|
- baths - beds |
show details |
| Photo | Address | Area | Beds / Baths | Price | Details |
|---|---|---|---|---|---|

|
#21
6th Ave
Bartlett, IL 60103
|
- sq. feet
|
- baths - beds |
show details | |

|
#22
Il Route 59
Bartlett, IL 60103
|
- sq. feet
|
- baths - beds |
show details | |

|
#23
Wayne Ct Apt 1
Bartlett, IL 60103
|
- sq. feet
|
- baths - beds |
show details | |

|
#24
Newport B-2
Bartlett, IL 60103
|
- sq. feet
|
- baths - beds |
show details | |

|
#25
Newport Ln Apt B1
Bartlett, IL 60103
|
- sq. feet
|
- baths - beds |
show details | |

|
#26
Marcia Ct Unit C
Bartlett, IL 60103
|
- sq. feet
|
- baths - beds |
show details | |

|
#27
Tameling Ct
Bartlett, IL 60103
|
- sq. feet
|
- baths - beds |
show details | |

|
#28
Groton Ln
Bartlett, IL 60103
|
- sq. feet
|
- baths - beds |
show details | |

|
#29
Sandpiper Ct
Bartlett, IL 60103
|
- sq. feet
|
- baths - beds |
show details | |

|
#30
Mccook Ct
Bartlett, IL 60103
|
- sq. feet
|
- baths - beds |
show details |
| Photo | Address | Area | Beds / Baths | Price | Details |
|---|---|---|---|---|---|

|
#31
S Main St Unit 213
Bartlett, IL 60103
|
- sq. feet
|
- baths - beds |
show details | |

|
#32
E Railroad Ave Unit 202
Bartlett, IL 60103
|
- sq. feet
|
- baths - beds |
show details | |

|
#33
Joan Ct Unit D
Bartlett, IL 60103
|
- sq. feet
|
- baths - beds |
show details | |

|
#34
Mable Ln
Bartlett, IL 60103
|
- sq. feet
|
- baths - beds |
show details | |

|
#35
Lucille Ct Unit B
Bartlett, IL 60103
|
- sq. feet
|
- baths - beds |
show details | |

|
#36
Grenache Ct
Bartlett, IL 60103
|
- sq. feet
|
- baths - beds |
show details | |

|
#37
Belmont Ln
Bartlett, IL 60103
|
- sq. feet
|
- baths - beds |
show details | |

|
#38
Bay Ct
Bartlett, IL 60103
|
- sq. feet
|
- baths - beds |
show details | |

|
#39
Towering Oaks Ct
Bartlett, IL 60103
|
- sq. feet
|
- baths - beds |
show details | |

|
#40
Harbor Ter
Bartlett, IL 60103
|
- sq. feet
|
- baths - beds |
show details |
| Photo | Address | Area | Beds / Baths | Price | Details |
|---|---|---|---|---|---|

|
#41
Osprey Ct
Bartlett, IL 60103
|
- sq. feet
|
- baths - beds |
show details | |

|
#42
Sun Drop Ct
Bartlett, IL 60103
|
- sq. feet
|
- baths - beds |
show details | |

|
#43
E Country Dr
Bartlett, IL 60103
|
- sq. feet
|
- baths - beds |
show details | |

|
#44
Harbor Ter
Bartlett, IL 60103
|
- sq. feet
|
- baths - beds |
show details | |

|
#45
Wilcox Dr
Bartlett, IL 60103
|
- sq. feet
|
- baths - beds |
show details | |

|
#46
Wilcox Dr
Bartlett, IL 60103
|
- sq. feet
|
- baths - beds |
show details | |

|
#47
Timber Ridge Dr
Bartlett, IL 60103
|
- sq. feet
|
- baths - beds |
show details | |

|
#48
Edinburgh Dr
Bartlett, IL 60103
|
- sq. feet
|
- baths - beds |
show details | |

|
#49
Lakeside Dr
Bartlett, IL 60103
|
- sq. feet
|
- baths - beds |
show details | |

|
Check over 1 million property listings on Foreclosure.com!
|
browse all offers | |||


- 24,71961.9%White alone
- 6,86717.2%Asian alone
- 6,07415.2%Hispanic
- 1,5023.8%Black alone
- 7812.0%Two or more races
- 320.08%Other race alone
- 150.04%American Indian alone
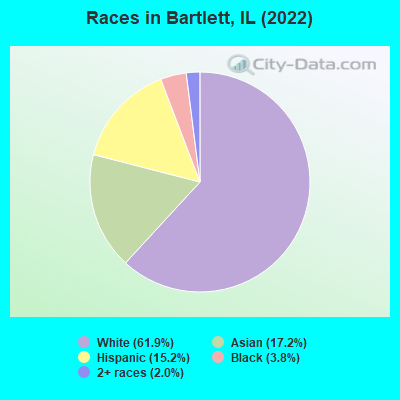
Races in Bartlett detailed stats: ancestries, foreign born residents, place of birth
According to our research of Illinois and other state lists, there were 10 registered sex offenders living in Bartlett, Illinois as of April 27, 2024.
The ratio of all residents to sex offenders in Bartlett is 4,128 to 1.
The ratio of registered sex offenders to all residents in this city is much lower than the state average.
Type |
2009 |
2010 |
2011 |
2012 |
2013 |
2014 |
2015 |
2016 |
2017 |
2018 |
2019 |
2020 |
|---|---|---|---|---|---|---|---|---|---|---|---|---|
| Murders (per 100,000) | 0 (0.0) | 0 (0.0) | 0 (0.0) | 0 (0.0) | 1 (2.4) | 1 (2.4) | 0 (0.0) | 0 (0.0) | 1 (2.4) | 0 (0.0) | 1 (2.4) | 0 (0.0) |
| Rapes (per 100,000) | 0 (0.0) | 4 (9.7) | 3 (7.3) | 4 (9.6) | 1 (2.4) | 1 (2.4) | 3 (7.2) | 1 (2.4) | 4 (9.7) | 5 (12.2) | 8 (19.6) | 2 (4.9) |
| Robberies (per 100,000) | 8 (18.7) | 3 (7.3) | 2 (4.8) | 9 (21.7) | 5 (12.0) | 3 (7.2) | 4 (9.6) | 8 (19.2) | 6 (14.6) | 8 (19.4) | 3 (7.3) | 2 (4.9) |
| Assaults (per 100,000) | 9 (21.0) | 14 (34.0) | 11 (26.6) | 18 (43.4) | 11 (26.4) | 9 (21.5) | 19 (45.5) | 23 (55.3) | 8 (19.4) | 8 (19.4) | 12 (29.3) | 5 (12.3) |
| Burglaries (per 100,000) | 53 (123.7) | 34 (82.5) | 26 (62.9) | 29 (69.9) | 22 (52.7) | 15 (35.9) | 10 (24.0) | 17 (40.9) | 20 (48.6) | 11 (26.7) | 22 (53.8) | 9 (22.2) |
| Thefts (per 100,000) | 422 (984.7) | 328 (796.0) | 257 (621.8) | 278 (670.3) | 240 (575.1) | 216 (516.9) | 173 (414.6) | 226 (543.3) | 187 (454.2) | 150 (364.6) | 157 (383.9) | 143 (352.4) |
| Auto thefts (per 100,000) | 11 (25.7) | 11 (26.7) | 5 (12.1) | 10 (24.1) | 8 (19.2) | 5 (12.0) | 8 (19.2) | 7 (16.8) | 7 (17.0) | 8 (19.4) | 9 (22.0) | 16 (39.4) |
| Arson (per 100,000) | 0 (0.0) | 10 (24.3) | 5 (12.1) | 1 (2.4) | 2 (4.8) | 6 (14.4) | 1 (2.4) | 3 (7.2) | 7 (17.0) | 2 (4.9) | 1 (2.4) | 0 (0.0) |
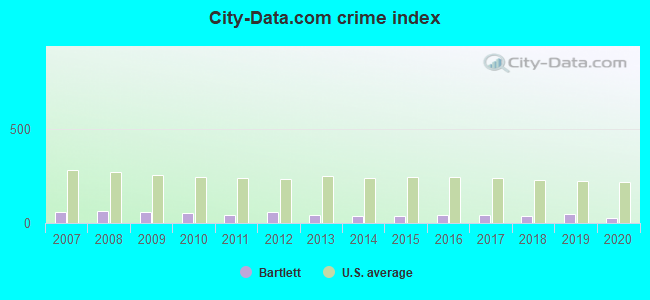
| City-Data.com crime index | 59.9 | 56.5 | 42.8 | 56.5 | 43.8 | 37.3 | 37.5 | 44.7 | 43.8 | 37.5 | 49.5 | 26.7 |
The City-Data.com crime index weighs serious crimes and violent crimes more heavily. Higher means more crime, U.S. average is 246.1. It adjusts for the number of visitors and daily workers commuting into cities.
Crime rate in Bartlett detailed stats: murders, rapes, robberies, assaults, burglaries, thefts, arson
Full-time law enforcement employees in 2017, including police officers: 69 (54 officers - 46 male; 8 female).
| Officers per 1,000 residents here: | 1.31 |
| Illinois average: | 3.15 |
 Recent articles from our blog. Our writers, many of them Ph.D. graduates or candidates, create easy-to-read articles on a wide variety of topics.


Latest news from Bartlett, IL collected exclusively by city-data.com from local newspapers, TV, and radio stations
Ancestries: Polish (12.6%), Italian (9.9%), German (7.2%), Irish (4.4%), American (3.8%), European (2.7%).
Current Local Time: CST time zone
Incorporated on 06/21/1892
Elevation: 810 feet
Land area: 14.8 square miles.
Population density: 2,711 people per square mile (average).
8,186 residents are foreign born (11.4% Asia, 4.8% Europe, 3.8% Latin America).
| This village: | 20.5% |
| Illinois: | 14.1% |
Median real estate property taxes paid for housing units with mortgages in 2022: $8,635 (2.5%)
Median real estate property taxes paid for housing units with no mortgage in 2022: $8,275 (2.5%)
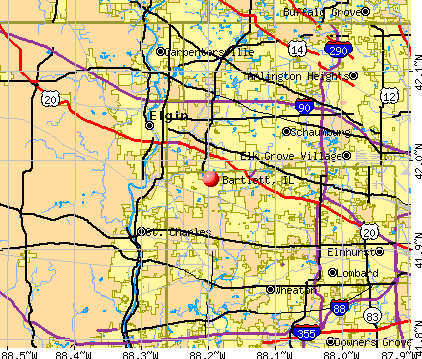
Nearest city with pop. 50,000+: Elgin, IL  (6.3 miles , pop. 94,487).
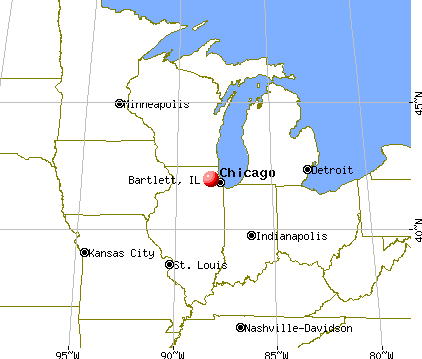
Nearest city with pop. 200,000+: Chicago, IL (28.3 miles , pop. 2,896,016).
Nearest cities:
), Latitude: 41.98 N, Longitude: 88.20 W
Daytime population change due to commuting: -9,778 (-24.5%)
Workers who live and work in this village: 5,759 (25.5%)
Area codes: 630, 847

Bartlett, Illinois accommodation & food services, waste management - Economy and Business Data
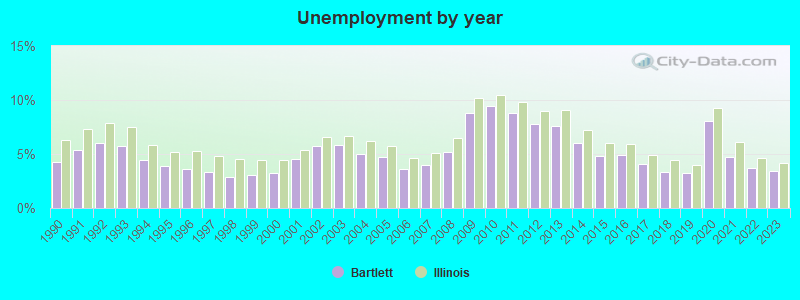
| Here: | 3.4% |
| Illinois: | 4.2% |
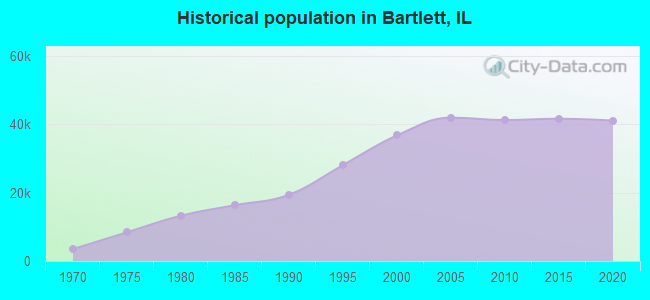
Population change in the 1990s: +16,972 (+86.0%).
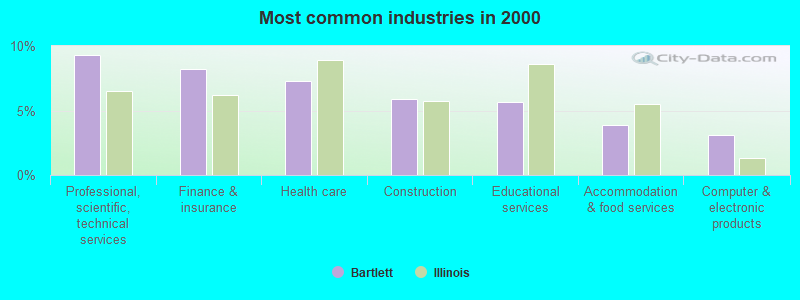
- Professional, scientific, technical services (9.3%)
- Finance & insurance (8.2%)
- Health care (7.3%)
- Construction (5.9%)
- Educational services (5.7%)
- Accommodation & food services (3.8%)
- Computer & electronic products (3.1%)
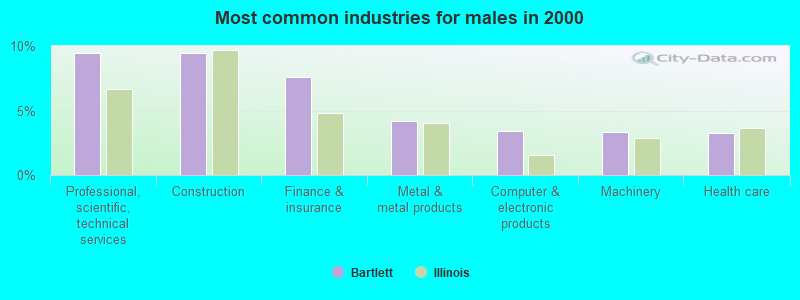
- Professional, scientific, technical services (9.5%)
- Construction (9.5%)
- Finance & insurance (7.6%)
- Metal & metal products (4.1%)
- Computer & electronic products (3.4%)
- Machinery (3.4%)
- Health care (3.3%)
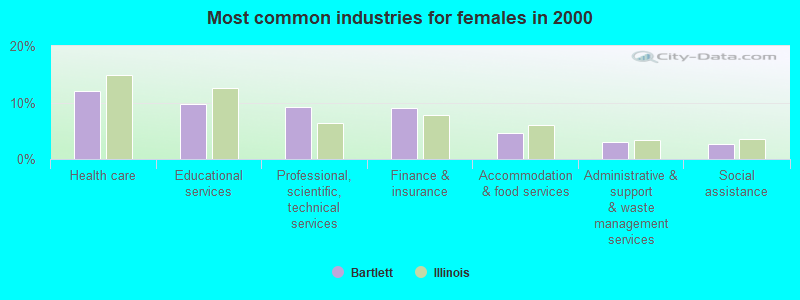
- Health care (12.0%)
- Educational services (9.8%)
- Professional, scientific, technical services (9.2%)
- Finance & insurance (9.0%)
- Accommodation & food services (4.5%)
- Administrative & support & waste management services (3.1%)
- Social assistance (2.7%)
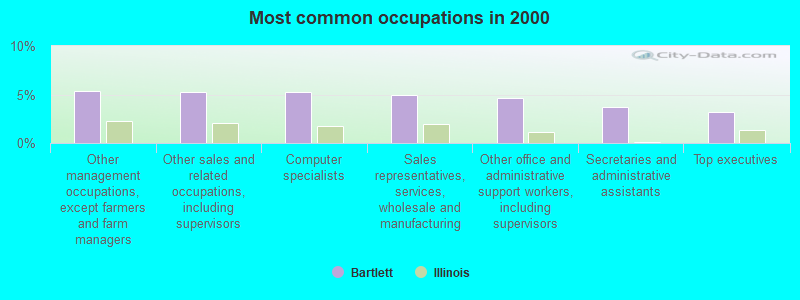
- Other management occupations, except farmers and farm managers (5.4%)
- Other sales and related occupations, including supervisors (5.3%)
- Computer specialists (5.3%)
- Sales representatives, services, wholesale and manufacturing (5.0%)
- Other office and administrative support workers, including supervisors (4.6%)
- Secretaries and administrative assistants (3.7%)
- Top executives (3.2%)

- Sales representatives, services, wholesale and manufacturing (6.5%)
- Other sales and related occupations, including supervisors (6.4%)
- Computer specialists (6.3%)
- Other management occupations, except farmers and farm managers (5.4%)
- Top executives (5.0%)
- Engineers (4.3%)
- Electrical equipment mechanics and other installation, maintenance, and repair workers, including supervisors (4.2%)
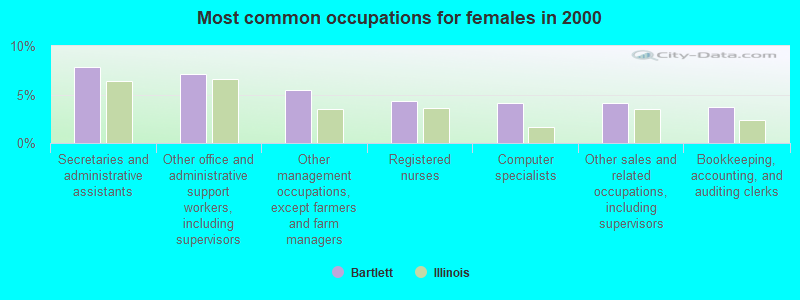
- Secretaries and administrative assistants (7.8%)
- Other office and administrative support workers, including supervisors (7.1%)
- Other management occupations, except farmers and farm managers (5.4%)
- Registered nurses (4.4%)
- Computer specialists (4.1%)
- Other sales and related occupations, including supervisors (4.1%)
- Bookkeeping, accounting, and auditing clerks (3.7%)
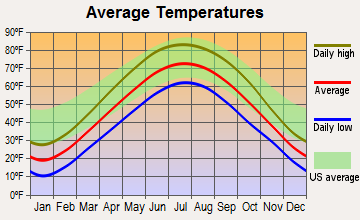
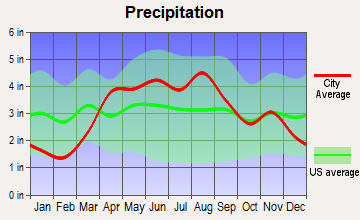
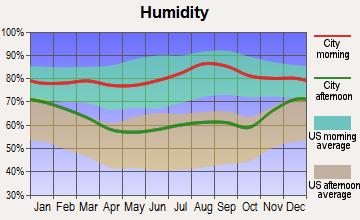
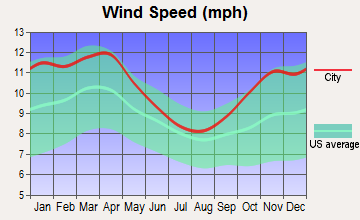
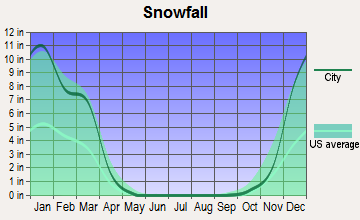
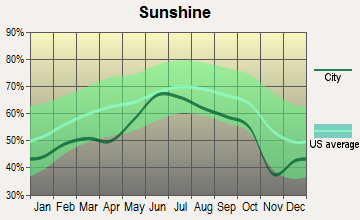
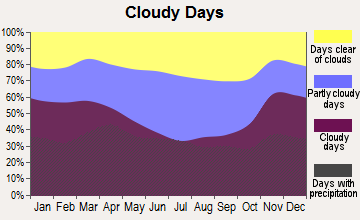
Average climate in Bartlett, Illinois
Based on data reported by over 4,000 weather stations
|
|


(lower is better)
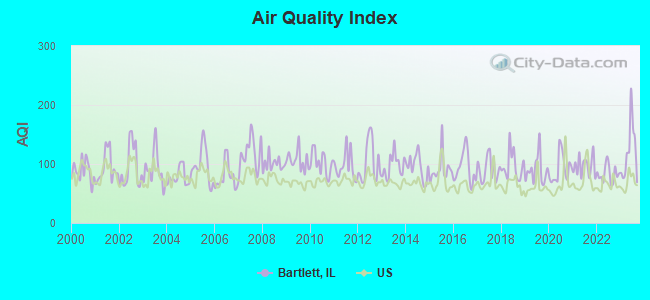
Air Quality Index (AQI) level in 2023 was 120. This is significantly worse than average.
| City: | 120 |
| U.S.: | 73 |
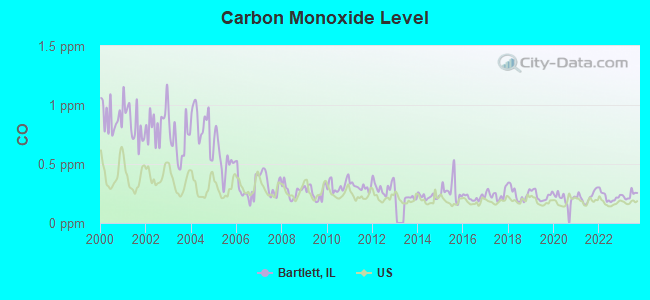
Carbon Monoxide (CO) [ppm] level in 2023 was 0.237. This is about average. Closest monitor was 13.9 miles away from the city center.
| City: | 0.237 |
| U.S.: | 0.251 |
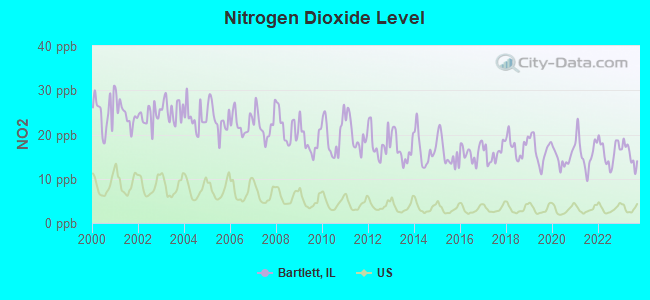
Nitrogen Dioxide (NO2) [ppb] level in 2023 was 15.5. This is significantly worse than average. Closest monitor was 3.4 miles away from the city center.
| City: | 15.5 |
| U.S.: | 5.1 |
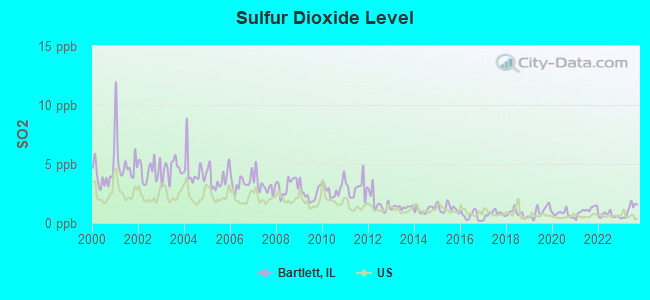
Sulfur Dioxide (SO2) [ppb] level in 2023 was 1.11. This is better than average. Closest monitor was 3.4 miles away from the city center.
| City: | 1.11 |
| U.S.: | 1.51 |
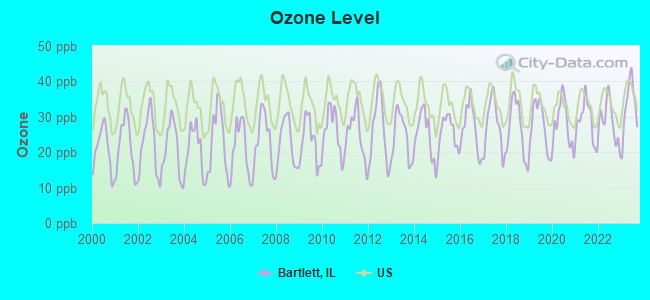
Ozone [ppb] level in 2023 was 33.0. This is about average. Closest monitor was 6.3 miles away from the city center.
| City: | 33.0 |
| U.S.: | 33.3 |
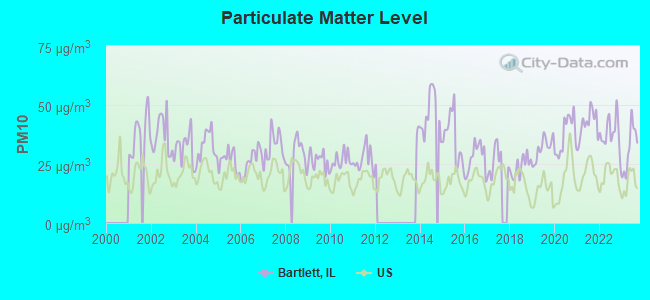
Particulate Matter (PM10) [µg/m3] level in 2023 was 31.4. This is significantly worse than average. Closest monitor was 6.9 miles away from the city center.
| City: | 31.4 |
| U.S.: | 19.2 |
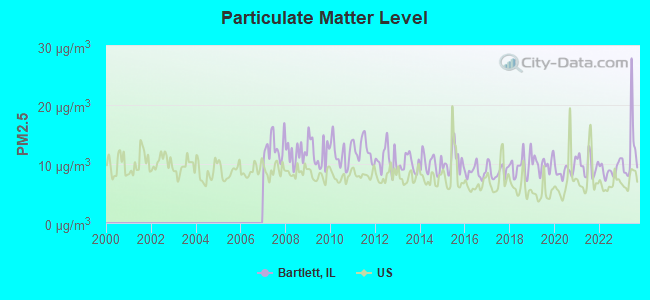
Particulate Matter (PM2.5) [µg/m3] level in 2023 was 12.1. This is significantly worse than average. Closest monitor was 6.6 miles away from the city center.
| City: | 12.1 |
| U.S.: | 8.1 |
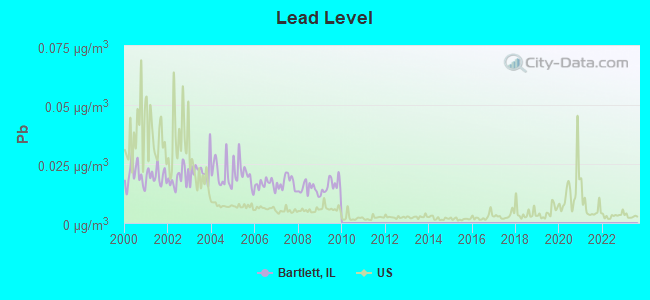
Lead (Pb) [µg/m3] level in 2009 was 0.0157. This is significantly worse than average. Closest monitor was 3.4 miles away from the city center.
| City: | 0.0157 |
| U.S.: | 0.0093 |
Tornado activity:
Bartlett-area historical tornado activity is slightly below Illinois state average. It is 45% greater than the overall U.S. average.
On 8/28/1990, a category F5 (max. wind speeds 261-318 mph) tornado 22.1 miles away from the Bartlett village center killed 29 people and injured 350 people and caused between $50,000 and $500,000 in damages.
On 4/21/1967, a category F4 (max. wind speeds 207-260 mph) tornado 12.4 miles away from the village center killed one person and injured 100 people and caused between $500,000 and $5,000,000 in damages.
Earthquake activity:
Bartlett-area historical earthquake activity is significantly above Illinois state average. It is 45% greater than the overall U.S. average.On 4/18/2008 at 09:36:59, a magnitude 5.4 (5.1 MB, 4.8 MS, 5.4 MW, 5.2 MW, Class: Moderate, Intensity: VI - VII) earthquake occurred 244.5 miles away from the city center
On 6/10/1987 at 23:48:54, a magnitude 5.1 (4.9 MB, 4.4 MS, 4.6 MS, 5.1 LG) earthquake occurred 219.0 miles away from Bartlett center
On 4/18/2008 at 09:36:59, a magnitude 5.2 (5.2 MW, Depth: 8.9 mi) earthquake occurred 244.5 miles away from the city center
On 6/28/2004 at 06:10:52, a magnitude 4.2 (4.2 MW, Depth: 6.2 mi, Class: Light, Intensity: IV - V) earthquake occurred 51.1 miles away from the city center
On 2/10/2010 at 09:59:35, a magnitude 3.8 (3.8 MW, Depth: 6.2 mi, Class: Light, Intensity: II - III) earthquake occurred 15.5 miles away from the city center
On 6/18/2002 at 17:37:15, a magnitude 5.0 (4.3 MB, 4.6 MW, 5.0 LG) earthquake occurred 277.0 miles away from Bartlett center
Magnitude types: regional Lg-wave magnitude (LG), body-wave magnitude (MB), surface-wave magnitude (MS), moment magnitude (MW)
Natural disasters:
The number of natural disasters in Cook County (20) is greater than the US average (15).Major Disasters (Presidential) Declared: 15
Emergencies Declared: 4
Causes of natural disasters: Floods: 13, Storms: 12, Tornadoes: 3, Snowstorms: 2, Winter Storms: 2, Blizzard: 1, Hurricane: 1, Snow: 1, Wind: 1, Other: 1 (Note: some incidents may be assigned to more than one category).

Hospitals and medical centers in Bartlett:
- SUPPORTIVE HOME HEALTH, LLC (1261 HUMBRACHT UNIT L)
- ASSISI HEALTHCARE OF CLARE OAKS (829 CARILLON DRIVE)
Other hospitals and medical centers near Bartlett:
- ALEXIAN BROTHERS HOME HEALTH (Home Health Center, about 3 miles away; HANOVER PARK, IL)
- CLAREMONT - HANOVER PARK (Nursing Home, about 3 miles away; HANOVER PARK, IL)
- ZACHARY HOUSE (Hospital, about 4 miles away; STREAMWOOD, IL)
- BHC STREAMWOOD HOSPITAL INC (Hospital, about 4 miles away; STREAMWOOD, IL)
- LEXINGTON OF STREAMWOOD (Nursing Home, about 4 miles away; STREAMWOOD, IL)
- ALDEN TRAILS (Hospital, about 5 miles away; BLOOMINGDALE, IL)
- WOOD GLEN NURSING AND REHAB CTR (Nursing Home, about 5 miles away; WEST CHICAGO, IL)
Heliports located in Bartlett:
Colleges/universities with over 2000 students nearest to Bartlett:
- Elgin Community College (about 8 miles; Elgin, IL; Full-time enrollment: 8,173)
- Universal Technical Institute of Illinois Inc (about 8 miles; Glendale Heights, IL; FT enrollment: 2,281)
- Chamberlain College of Nursing-Illinois (about 9 miles; Addison, IL; FT enrollment: 8,977)
- Wheaton College (about 10 miles; Wheaton, IL; FT enrollment: 2,948)
- American InterContinental University-Online (about 10 miles; Schaumburg, IL; FT enrollment: 16,158)
- Harper College (about 10 miles; Palatine, IL; FT enrollment: 10,800)
- College of DuPage (about 12 miles; Glen Ellyn, IL; FT enrollment: 18,910)
Public high school in Bartlett:
- BARTLETT HIGH SCHOOL (Students: 2,698, Location: 701 W SCHICK RD, Grades: 9-12)
Private high school in Bartlett:
Public elementary/middle schools in Bartlett:
- EASTVIEW MIDDLE SCHOOL (Students: 1,081, Location: 321 N OAK AVE, Grades: 7-8)
- NATURE RIDGE ELEM SCHOOL (Students: 795, Location: 1899 WESTRIDGE BLVD, Grades: KG-6)
- BARTLETT ELEM SCHOOL (Students: 631, Location: 111 E NORTH AVE, Grades: KG-6)
- SYCAMORE TRAILS ELEMENTARY SCHOOL (Students: 577, Location: 1025 SYCAMORE LN, Grades: KG-6)
- CENTENNIAL SCHOOL (Students: 544, Location: 234 E STEARNS RD, Grades: KG-6)
- HAWK HOLLOW ELEM SCHOOL (Students: 518, Location: 235 JACARANDA DR, Grades: PK-6)
- PRAIRIEVIEW ELEMENTARY SCHOOL (Students: 510, Location: 285 MAYFLOWER LN, Grades: PK-6)
- LIBERTY ELEM SCHOOL (Location: 1375 W BARTLETT RD, Grades: KG-6)
Private elementary/middle school in Bartlett:
Library in Bartlett:
- BARTLETT PUBLIC LIBRARY DISTRICT (Operating income: $2,927,126; Location: 800 SOUTH BARTLETT ROAD; 116,265 books; 24,087 e-books; 7,778 audio materials; 9,080 video materials; 26 local licensed databases; 17 state licensed databases; 1 other licensed databases; 280 print serial subscriptions; 3 electronic serial subscriptions)
User-submitted facts and corrections:
- Private School Bartlett Christian Academy 1500 W. Stearns Rd., Bartlett Illinois, 60103 630-830-9888 Administrator - Pastor Jerry Gleason K - 5th grades (6th next year) www.bartlettchristianacademy.org For additional info: bcaschooloffice at gmail.com
Points of interest:
Notable locations in Bartlett: Bartlett Hills Golf and Country Club (A), Munger Station (B), Herrick House Childrens Center (C), Brewster Creek Business Park (D), Apple Orchard Golf Course (E), Villa Olivia Country Club (F), Bartlett Fire Protection District Station 2 (G), Bartlett Fire Protection District Station 3 (H), Bartlett Fire Protection District Station 1 (I), Bartlett Public Library (J), Bartlett Village Hall (K), Hanover Township Office (L). Display/hide their locations on the map
Shopping Centers: Brewster Creek Shopping Center (1), Bartlett Orchards Shopping Center (2), Bartlett Commons Shopping Center (3), Oakfield Shopping Center (4), Devon-Prospect Shopping Center (5), Bartlett Plaza Shopping Center (6), Walnut Corner Shopping Center (7). Display/hide their locations on the map
Churches in Bartlett include: Alliance Church of Bartlett (A), Faith World Outreach Church (B), Immanuel Lutheran Church (C), Immanuel United Church of Christ (D), Saint Joseph Chapel (E), Saint Peter Damien Catholic Church (F), Village Church of Bartlett (G), Bartlett Baptist Church (H), Living Lord Lutheran Church (I). Display/hide their locations on the map
Cemetery: Bartlett Cemetery (1). Display/hide its location on the map
Lake: Island Lake (A). Display/hide its location on the map
Parks in Bartlett include: Schoppe Park (1), Winding Creek Commons Park (2), Sunrise Park (3), Kermits Corner Park (4), Ruzicka Memorial Park (5), Oak Park (6), Humbracht Park (7), Prairieview Park (8), Schick Park (9). Display/hide their locations on the map
Hotels: Crest Motel (West Lake Street) (1), Four Seasons Market (399 Bartlett Plaza) (2), Extended Stayamerica (1075 East Lake Street) (3). Display/hide their approximate locations on the map
Court: Hesaco Industrial Court (1261 Humbracht Circle) (1). Display/hide its approximate location on the map
Birthplace of: Alok Aiyar - College basketball player (Illinois (Chi.) Flames), Anthony Maestranzi - College basketball player (Northern Illinois Huskies).
Drinking water stations with addresses in Bartlett and their reported violations in the past:
BARTLETT (Population served: 41,500, Purch surface water):Past health violations:PLAZA DE MARCOS (Population served: 250, Groundwater):Past monitoring violations:
- MCL, Average - Between JUL-2011 and SEP-2011, Contaminant: Combined Radium (-226 and -228). Follow-up actions: St Formal NOV issued (NOV-10-2010), St BCA signed (JAN-21-2011), St Compliance achieved (SEP-30-2011), St Public Notif requested (OCT-20-2011), St Violation/Reminder Notice (OCT-20-2011), St Public Notif received (DEC-06-2011)
- MCL, Average - Between APR-2011 and JUN-2011, Contaminant: Combined Radium (-226 and -228). Follow-up actions: St Formal NOV issued (NOV-10-2010), St BCA signed (JAN-21-2011), St Public Notif requested (JUL-29-2011), St Violation/Reminder Notice (JUL-29-2011), St Compliance achieved (SEP-30-2011), St Public Notif received (OCT-11-2011)
- MCL, Average - Between JAN-2011 and MAR-2011, Contaminant: Combined Radium (-226 and -228). Follow-up actions: St Formal NOV issued (NOV-10-2010), St BCA signed (JAN-21-2011), St Public Notif requested (APR-19-2011), St Violation/Reminder Notice (APR-19-2011), St Public Notif received (JUN-03-2011), St Compliance achieved (SEP-30-2011)
- MCL, Average - Between OCT-2010 and DEC-2010, Contaminant: Combined Radium (-226 and -228). Follow-up actions: St Formal NOV issued (NOV-10-2010), St BCA signed (JAN-21-2011), St Public Notif requested (JAN-21-2011), St Violation/Reminder Notice (JAN-21-2011), St Public Notif received (APR-06-2011), St Compliance achieved (SEP-30-2011)
- MCL, Average - Between JUL-2010 and SEP-2010, Contaminant: Combined Radium (-226 and -228). Follow-up actions: St Formal NOV issued (APR-25-2008), St BCA signed (JUN-25-2008), St Public Notif requested (OCT-19-2010), St Violation/Reminder Notice (OCT-19-2010), St Compliance achieved (NOV-24-2010), St Public Notif received (DEC-09-2010)
- MCL, Average - Between APR-2010 and JUN-2010, Contaminant: Combined Radium (-226 and -228). Follow-up actions: St Formal NOV issued (APR-25-2008), St BCA signed (JUN-25-2008), St Public Notif requested (JUL-15-2010), St Violation/Reminder Notice (JUL-15-2010), St Public Notif received (OCT-05-2010), St Compliance achieved (NOV-24-2010)
- 22 other older health violations
- Monitoring and Reporting (DBP) - Between OCT-2006 and DEC-2006, Contaminant: Chlorine. Follow-up actions: St Public Notif requested (DEC-14-2006), St Violation/Reminder Notice (DEC-14-2006), St Compliance achieved (DEC-27-2006)
- One minor monitoring violation
- 4 regular monitoring violations
Past monitoring violations:GOOD SHEPHERD UNITED METHODIST (Address: 751 W ARMY TRAIL ROAD , Population served: 85, Groundwater):
- One routine major monitoring violation
- One regular monitoring violation
Past health violations:
- MCL, Monthly (TCR) - In SEP-2010, Contaminant: Coliform. Follow-up actions: St Formal NOV issued (FEB-25-2011), St Compliance achieved (MAR-23-2011)
- MCL, Monthly (TCR) - Between JAN-2008 and DEC-2008, Contaminant: Coliform. Follow-up actions: St Violation/Reminder Notice (AUG-20-2008), St Compliance achieved (NOV-04-2008)
| This village: | 2.9 people |
| Illinois: | 2.6 people |
| This village: | 79.0% |
| Whole state: | 65.8% |
| This village: | 4.1% |
| Whole state: | 6.3% |
Likely homosexual households (counted as self-reported same-sex unmarried-partner households)
- Lesbian couples: 0.3% of all households
- Gay men: 0.2% of all households
People in group quarters in Bartlett in 2000:
- 56 people in religious group quarters
- 49 people in training schools for juvenile delinquents
- 8 people in homes for the mentally retarded
Banks with branches in Bartlett (2011 data):
- West Suburban Bank: Bartlett Facility at 1061 West Stearns Road, branch established on 1986/10/27; Clare Oaks Branch at 1061 W. Stearns Rd, branch established on 2008/06/30. Info updated 2011/02/23: Bank assets: $1,927.7 mil, Deposits: $1,744.7 mil, headquarters in Lombard, IL, positive income, Commercial Lending Specialization, 44 total offices, Holding Company: West Suburban Bancorp, Inc.
- BMO Harris Bank National Association: Harris Bk Bartlett Branch at 335 South Main Street, branch established on 1910/01/01. Info updated 2011/07/14: Bank assets: $97,264.0 mil, Deposits: $75,624.6 mil, headquarters in Chicago, IL, positive income, 717 total offices, Holding Company: Bank Of Montreal
- Fifth Third Bank: Bartlett Banking Center Branch at 980 South Illinois Route 59, branch established on 2005/02/14. Info updated 2009/10/05: Bank assets: $114,540.4 mil, Deposits: $89,689.1 mil, headquarters in Cincinnati, OH, positive income, Commercial Lending Specialization, 1378 total offices, Holding Company: Fifth Third Bancorp
- First American Bank: Bartlett Branch at 970 S. Route 59, branch established on 2005/09/16. Info updated 2010/01/19: Bank assets: $2,710.6 mil, Deposits: $2,213.4 mil, headquarters in Elk Grove Village, IL, negative income in the last year, Commercial Lending Specialization, 50 total offices, Holding Company: First American Bank Corporation
- JPMorgan Chase Bank, National Association: Bartlett Stearns Dominicks at 1041 West Stearns, branch established on 1999/02/11. Info updated 2011/11/10: Bank assets: $1,811,678.0 mil, Deposits: $1,190,738.0 mil, headquarters in Columbus, OH, positive income, International Specialization, 5577 total offices, Holding Company: Jpmorgan Chase & Co.
- TCF National Bank: Stearns/Bartlett Rd Jewel Br #2262 at 125 East Stearns Road, branch established on 1996/10/10. Info updated 2009/11/23: Bank assets: $19,007.0 mil, Deposits: $12,377.0 mil, headquarters in Sioux Falls, SD, positive income, Commercial Lending Specialization, 441 total offices, Holding Company: Tcf Financial Corporation
- Associated Bank, National Association: Bartlett Branch at 200 Bartlett Avenue, branch established on 1883/01/01. Info updated 2008/09/12: Bank assets: $21,715.0 mil, Deposits: $15,244.4 mil, headquarters in Green Bay, WI, positive income, Commercial Lending Specialization, 282 total offices, Holding Company: Associated Banc-Corp
- American Chartered Bank: Bartlett Branch at 388 South Main Street, branch established on 1992/10/29. Info updated 2006/11/03: Bank assets: $2,326.5 mil, Deposits: $2,068.1 mil, headquarters in Schaumburg, IL, negative income in the last year, Commercial Lending Specialization, 15 total offices, Holding Company: American Chartered Bancorp, Inc.
For population 15 years and over in Bartlett:
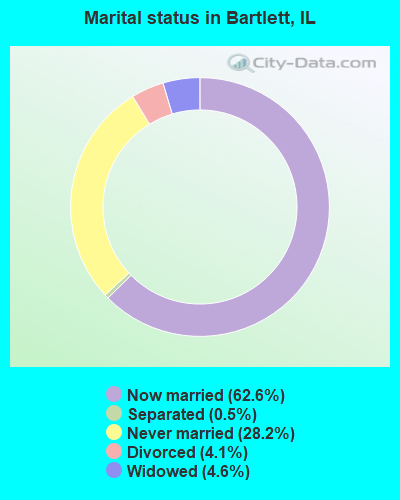
- Never married: 28.2%
- Now married: 62.6%
- Separated: 0.5%
- Widowed: 4.6%
- Divorced: 4.1%
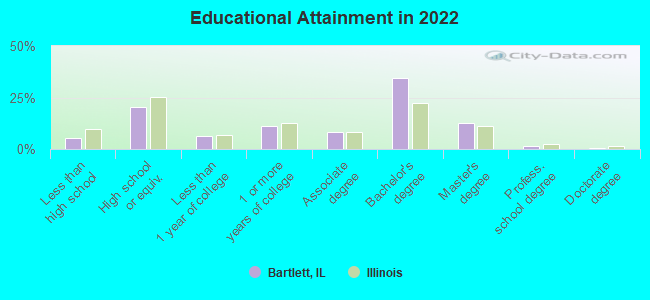
For population 25 years and over in Bartlett:
- High school or higher: 95.0%
- Bachelor's degree or higher: 48.0%
- Graduate or professional degree: 14.3%
- Unemployed: 2.3%
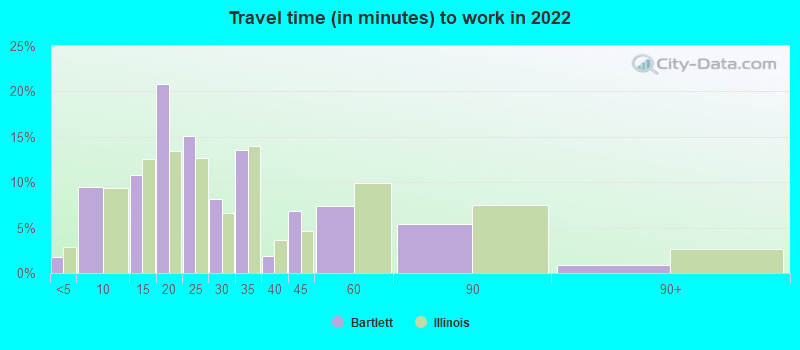
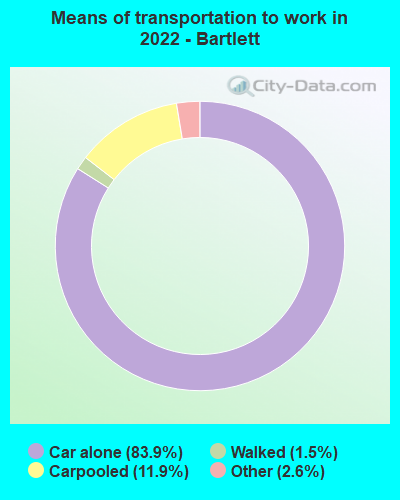
- Mean travel time to work (commute): 23.6 minutes
| Here: | 9.9 |
| Illinois average: | 12.5 |


Graphs represent county-level data. Detailed 2008 Election Results
Religion statistics for Bartlett, IL (based on Cook County data)


| Religion | Adherents | Congregations |
|---|---|---|
| Catholic | 1,947,223 | 376 |
| Evangelical Protestant | 432,975 | 1,484 |
| Other | 312,636 | 403 |
| Mainline Protestant | 202,114 | 630 |
| Black Protestant | 148,895 | 395 |
| Orthodox | 53,276 | 66 |
| None | 2,097,556 | - |
Food Environment Statistics:
| Cook County: | 2.77 / 10,000 pop. |
| Illinois: | 2.24 / 10,000 pop. |
| Cook County: | 0.04 / 10,000 pop. |
| Illinois: | 0.08 / 10,000 pop. |
| Cook County: | 0.93 / 10,000 pop. |
| Illinois: | 0.75 / 10,000 pop. |
| Cook County: | 1.53 / 10,000 pop. |
| Illinois: | 2.61 / 10,000 pop. |
| This county: | 6.67 / 10,000 pop. |
| Illinois: | 6.86 / 10,000 pop. |
| Cook County: | 8.4% |
| Illinois: | 8.3% |
| Cook County: | 23.5% |
| Illinois: | 25.2% |
| Cook County: | 16.3% |
| Illinois: | 14.5% |
Health and Nutrition:
| Bartlett: | 51.3% |
| Illinois: | 49.5% |
| This city: | 49.7% |
| State: | 47.2% |
| Bartlett: | 28.3 |
| Illinois: | 28.6 |
| This city: | 20.3% |
| Illinois: | 20.5% |
| Here: | 9.9% |
| Illinois: | 10.8% |
| Here: | 6.8 |
| Illinois: | 6.8 |
| This city: | 33.0% |
| State: | 33.4% |
| This city: | 58.9% |
| Illinois: | 56.4% |
| Bartlett: | 81.6% |
| Illinois: | 79.9% |
More about Health and Nutrition of Bartlett, IL Residents
| Local government employment and payroll (March 2022) | |||||
| Function | Full-time employees | Monthly full-time payroll | Average yearly full-time wage | Part-time employees | Monthly part-time payroll |
|---|---|---|---|---|---|
| Police Protection - Officers | 53 | $507,548 | $114,917 | 0 | $0 |
| Streets and Highways | 20 | $144,255 | $86,553 | 0 | $0 |
| Police - Other | 14 | $82,520 | $70,731 | 31 | $17,088 |
| Other and Unallocable | 13 | $102,673 | $94,775 | 3 | $3,947 |
| Sewerage | 12 | $86,515 | $86,515 | 0 | $0 |
| Financial Administration | 10 | $80,667 | $96,800 | 3 | $3,856 |
| Other Government Administration | 9 | $81,311 | $108,415 | 9 | $3,589 |
| Parks and Recreation | 9 | $60,503 | $80,671 | 31 | $16,294 |
| Water Supply | 6 | $49,366 | $98,732 | 0 | $0 |
| Housing and Community Development (Local) | 4 | $36,888 | $110,664 | 0 | $0 |
| Natural Resources | 1 | $6,535 | $78,420 | 0 | $0 |
| Health | 1 | $7,558 | $90,696 | 0 | $0 |
| Totals for Government | 152 | $1,246,339 | $98,395 | 77 | $44,774 |
Bartlett government finances - Expenditure in 2021 (per resident):
- Construction - General - Other: $679,000 ($16.91)
- Current Operations - Police Protection: $13,213,000 ($329.06)
Water Utilities: $7,959,000 ($198.21)
Central Staff Services: $5,021,000 ($125.04)
Sewerage: $4,214,000 ($104.95)
Regular Highways: $4,137,000 ($103.03)
Parks and Recreation: $1,743,000 ($43.41)
Financial Administration: $1,179,000 ($29.36)
Parking Facilities: $128,000 ($3.19)
- General - Interest on Debt: $4,384,000 ($109.18)
- Other Capital Outlay - Water Utilities: $2,367,000 ($58.95)
Central Staff Services: $1,982,000 ($49.36)
- Total Salaries and Wages: $16,127,000 ($401.63)
Bartlett government finances - Revenue in 2021 (per resident):
- Charges - Sewerage: $6,329,000 ($157.62)
Parks and Recreation: $1,771,000 ($44.11)
Parking Facilities: $19,000 ($0.47)
- Local Intergovernmental - Other: $2,979,000 ($74.19)
- Miscellaneous - General Revenue - Other: $1,161,000 ($28.91)
Fines and Forfeits: $214,000 ($5.33)
Interest Earnings: $72,000 ($1.79)
- Revenue - Water Utilities: $12,439,000 ($309.78)
- State Intergovernmental - General Local Government Support: $7,645,000 ($190.39)
Highways: $1,565,000 ($38.97)
- Tax - Property: $18,768,000 ($467.40)
Other Selective Sales: $3,137,000 ($78.12)
Other License: $2,309,000 ($57.50)
General Sales and Gross Receipts: $1,869,000 ($46.55)
Public Utilities Sales: $466,000 ($11.61)
Bartlett government finances - Debt in 2021 (per resident):
- Long Term Debt - Outstanding Unspecified Public Purpose: $87,426,000 ($2177.27)
Beginning Outstanding - Unspecified Public Purpose: $78,935,000 ($1965.81)
Issue, Unspecified Public Purpose: $29,434,000 ($733.03)
Retired Unspecified Public Purpose: $20,943,000 ($521.57)
Bartlett government finances - Cash and Securities in 2021 (per resident):
- Bond Funds - Cash and Securities: $3,464,000 ($86.27)
- Other Funds - Cash and Securities: $47,994,000 ($1195.25)
3.53% of this county's 2021 resident taxpayers lived in other counties in 2020 ($82,405 average adjusted gross income)
| Here: | 3.53% |
| Illinois average: | 5.09% |
0.01% of residents moved from foreign countries ($114 average AGI)
Cook County: 0.01% Illinois average: 0.01%
Top counties from which taxpayers relocated into this county between 2020 and 2021:
| from DuPage County, IL | |
| from Lake County, IL | |
| from Will County, IL |
5.44% of this county's 2020 resident taxpayers moved to other counties in 2021 ($120,340 average adjusted gross income)
| Here: | 5.44% |
| Illinois average: | 6.10% |
0.01% of residents moved to foreign countries ($140 average AGI)
Cook County: 0.01% Illinois average: 0.01%
Top counties to which taxpayers relocated from this county between 2020 and 2021:
| to DuPage County, IL | |
| to Will County, IL | |
| to Lake County, IL |
| Businesses in Bartlett, IL | ||||
| Name | Count | Name | Count | |
|---|---|---|---|---|
| 7-Eleven | 3 | McDonald's | 1 | |
| Baskin-Robbins | 1 | Quiznos | 1 | |
| Blockbuster | 1 | RadioShack | 1 | |
| CVS | 2 | SONIC Drive-In | 1 | |
| Dairy Queen | 1 | Safeway | 1 | |
| Dunkin Donuts | 1 | Starbucks | 2 | |
| FedEx | 3 | T-Mobile | 1 | |
| GNC | 1 | Taco Bell | 2 | |
| H&R Block | 1 | UPS | 4 | |
| Home Depot | 1 | Vans | 1 | |
| Jewel-Osco | 1 | Vons | 1 | |
| KFC | 1 | Wendy's | 1 | |
Strongest AM radio stations in Bartlett:
- WSCR (670 AM; 50 kW; CHICAGO, IL; Owner: INFINITY BROADCASTING OPERATIONS, INC.)
- WGN (720 AM; 50 kW; CHICAGO, IL; Owner: WGN CONTINENTAL BROADCASTING CO.)
- WBBM (780 AM; 50 kW; CHICAGO, IL; Owner: INFINITY BROADCASTING OPERATIONS, INC.)
- WMVP (1000 AM; 50 kW; CHICAGO, IL; Owner: ABC, INC.)
- WYLL (1160 AM; 50 kW; CHICAGO, IL; Owner: SCA LICENSE CORPORATION)
- WLS (890 AM; 50 kW; CHICAGO, IL; Owner: WLS, INC.)
- WMBI (1110 AM; daytime; 5 kW; CHICAGO, IL; Owner: THE MOODY BIBLE INSTITUTE OF CHICAGO)
- WTMJ (620 AM; 50 kW; MILWAUKEE, WI; Owner: JOURNAL BROADCAST CORPORATION)
- WRMN (1410 AM; 1 kW; ELGIN, IL; Owner: ELGIN BROADCASTING CO., INC.)
- WISN (1130 AM; 50 kW; MILWAUKEE, WI; Owner: CAPSTAR TX LIMITED PARTNERSHIP)
- WSPY (1480 AM; 1 kW; GENEVA, IL)
- WVIV (1200 AM; 20 kW; CHICAGO, IL; Owner: WLXX-AM LICENSE CORP.)
- WCSN (820 AM; 5 kW; CHICAGO, IL; Owner: WYPA, INC.)
Strongest FM radio stations in Bartlett:
- WJKL (94.3 FM; ELGIN, IL; Owner: ELGIN BROADCASTING CO., INC.)
- WLEY-FM (107.9 FM; AURORA, IL; Owner: WLEY LICENSING, INC.)
- WMBI-FM (90.1 FM; CHICAGO, IL; Owner: THE MOODY BIBLE INSTITUTE OF CHICAGO)
- WCKG (105.9 FM; ELMWOOD PARK, IL; Owner: INFINITY HOLDINGS CORPORATION OF ORLANDO)
- WLIT-FM (93.9 FM; CHICAGO, IL; Owner: AMFM RADIO LICENSES, L.L.C.)
- WJMK (104.3 FM; CHICAGO, IL; Owner: INFINITY BROADCASTING CORP. OF ILLINOIS)
- WNUA (95.5 FM; CHICAGO, IL; Owner: AMFM RADIO LICENSES, L.L.C.)
- WTMX (101.9 FM; SKOKIE, IL; Owner: BONNEVILLE HOLDING COMPANY)
- WGCI-FM (107.5 FM; CHICAGO, IL; Owner: AMFM RADIO LICENSES, L.L.C.)
- WBBM-FM (96.3 FM; CHICAGO, IL; Owner: INFINITY BROADCASTING OPERATIONS, INC.)
- WKSC-FM (103.5 FM; CHICAGO, IL; Owner: AMFM RADIO LICENSES, L.L.C.)
- WFMT (98.7 FM; CHICAGO, IL; Owner: WINDOW TO THE WORLD COMMUNICATIONS)
- WZZN (94.7 FM; CHICAGO, IL; Owner: ABC CHICAGO FM RADIO,INC.)
- WBEZ (91.5 FM; CHICAGO, IL; Owner: THE WBEZ ALLIANCE, INC.)
- WKQX (101.1 FM; CHICAGO, IL; Owner: EMMIS RADIO LICENSE CORPORATION)
- WLUP-FM (97.9 FM; CHICAGO, IL; Owner: BONNEVILLE HOLDING COMPANY)
- WNND (100.3 FM; CHICAGO, IL; Owner: BONNEVILLE HOLDING COMPANY)
- WOJO (105.1 FM; EVANSTON, IL; Owner: TICHENOR LICENSE CORPORATION ("TLC"))
- WUSN (99.5 FM; CHICAGO, IL; Owner: INFINITY BROADCASTING CORPORATION OF CHICAGO)
- WVAZ (102.7 FM; OAK PARK, IL; Owner: AMFM RADIO LICENSES, L.L.C.)
TV broadcast stations around Bartlett:
- W57DN (Channel 57; ELGIN, IL; Owner: TRINITY BROADCASTING NETWORK)
- W34CK (Channel 34; ARLINGTON HEIGHTS, IL; Owner: FIRST UNITED, INC.)
- WLS-TV (Channel 7; CHICAGO, IL; Owner: WLS TELEVISION, INC.)
- WMAQ-TV (Channel 5; CHICAGO, IL; Owner: NBC SUBSIDIARY (WMAQ-TV), INC.)
- WTTW (Channel 11; CHICAGO, IL; Owner: WINDOW TO THE WORLD COMMUNICATIONS, INC.)
- WGN-TV (Channel 9; CHICAGO, IL; Owner: WGN CONTINENTAL BROADCASTING COMPANY)
- WGBO-TV (Channel 66; JOLIET, IL; Owner: WGBO LICENSE PARTNERSHIP, G.P.)
- WBBM-TV (Channel 2; CHICAGO, IL; Owner: CBS BROADCASTING INC.)
- WPWR-TV (Channel 50; GARY, IN; Owner: FOX TELEVISION STATIONS, INC.)
- WXFT (Channel 60; AURORA, IL; Owner: TELEFUTURA CHICAGO LLC)
- WCIU-TV (Channel 26; CHICAGO, IL; Owner: WCIU-TV LIMITED PARTNERSHIP)
- WCPX (Channel 38; CHICAGO, IL; Owner: PAXSON CHICAGO LICENSE, INC.)
- WFLD (Channel 32; CHICAGO, IL; Owner: FOX TELEVISION STATIONS, INC.)
- W68DO (Channel 68; PALATINE, IL; Owner: TRINITY BROADCASTING NETWORK)
- WFBT-CA (Channel 23; CHICAGO, IL; Owner: CHANNEL 23 LIMITED PARTNERSHIP)
- WSNS-TV (Channel 44; CHICAGO, IL; Owner: TELEMUNDO OF CHICAGO, INC.)
- WJYS (Channel 62; HAMMOND, IN; Owner: JOVON BROADCASTING CORPORATION)
- W24AJ (Channel 24; AURORA, IL; Owner: NELSON TV, INC.)
- W64CQ (Channel 64; ARLINGTON HEIGHTS, IL; Owner: TRINITY BROADCASTING NETWORK)
- WOCH-LP (Channel 28; CHICAGO, IL; Owner: KM LPTV OF CHICAGO-28, L.L.C.)
- WYCC (Channel 20; CHICAGO, IL; Owner: COLLEGE DIST. #508, COUNTY OF COOK)
- WOCK-CA (Channel 13; CHICAGO, IL; Owner: KM LPTV OF CHICAGO-13, L.L.C.)
- WSPY-LP (Channel 30; PLANO, IL; Owner: WSPY-TV, INC.)
- W54BE (Channel 54; SUGAR GROVE, IL; Owner: WAUBONSEE COMMUNITY COLLEGE)
- National Bridge Inventory (NBI) Statistics
- 12Number of bridges
- 102ft / 31.5mTotal length
- $626,000Total costs
- 210,800Total average daily traffic
- 18,382Total average daily truck traffic
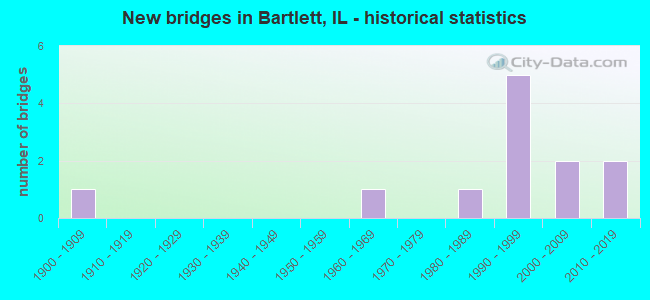
- New bridges - historical statistics
- 11900-1909
- 11960-1969
- 11980-1989
- 51990-1999
- 22000-2009
- 22010-2019
FCC Registered Private Land Mobile Towers: 1 (See the full list of FCC Registered Private Land Mobile Towers in Bartlett, IL)
FCC Registered Broadcast Land Mobile Towers: 9 (See the full list of FCC Registered Broadcast Land Mobile Towers)
FCC Registered Microwave Towers: 11 (See the full list of FCC Registered Microwave Towers in this town)
FCC Registered Paging Towers: 1 (See the full list of FCC Registered Paging Towers)
FCC Registered Amateur Radio Licenses: 125 (See the full list of FCC Registered Amateur Radio Licenses in Bartlett)
FAA Registered Aircraft: 30 (See the full list of FAA Registered Aircraft in Bartlett)
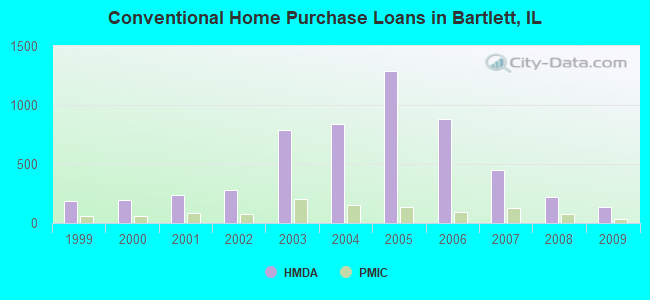
| Home Mortgage Disclosure Act Aggregated Statistics For Year 2009 (Based on 7 partial tracts) | ||||||||||||||
| A) FHA, FSA/RHS & VA Home Purchase Loans | B) Conventional Home Purchase Loans | C) Refinancings | D) Home Improvement Loans | E) Loans on Dwellings For 5+ Families | F) Non-occupant Loans on < 5 Family Dwellings (A B C & D) | G) Loans On Manufactured Home Dwelling (A B C & D) | ||||||||
|---|---|---|---|---|---|---|---|---|---|---|---|---|---|---|
| Number | Average Value | Number | Average Value | Number | Average Value | Number | Average Value | Number | Average Value | Number | Average Value | Number | Average Value | |
| LOANS ORIGINATED | 135 | $205,979 | 132 | $205,746 | 1,213 | $217,489 | 30 | $110,137 | 1 | $1,447,360 | 14 | $161,081 | 8 | $141,308 |
| APPLICATIONS APPROVED, NOT ACCEPTED | 7 | $197,310 | 16 | $162,889 | 123 | $228,021 | 5 | $19,544 | 0 | $0 | 4 | $178,962 | 2 | $27,500 |
| APPLICATIONS DENIED | 23 | $184,260 | 23 | $170,296 | 312 | $228,363 | 14 | $52,406 | 0 | $0 | 10 | $151,684 | 4 | $41,080 |
| APPLICATIONS WITHDRAWN | 7 | $195,116 | 9 | $217,808 | 185 | $227,201 | 6 | $132,522 | 0 | $0 | 3 | $146,037 | 0 | $0 |
| FILES CLOSED FOR INCOMPLETENESS | 3 | $201,550 | 4 | $186,390 | 58 | $236,234 | 1 | $135,370 | 0 | $0 | 1 | $253,800 | 0 | $0 |
Detailed HMDA statistics for the following Tracts: 8045.01 , 8045.05, 8413.01, 8413.02, 8413.03, 8413.04, 8413.05
| Private Mortgage Insurance Companies Aggregated Statistics For Year 2009 (Based on 7 partial tracts) | ||||||
| A) Conventional Home Purchase Loans | B) Refinancings | C) Non-occupant Loans on < 5 Family Dwellings (A & B) | ||||
|---|---|---|---|---|---|---|
| Number | Average Value | Number | Average Value | Number | Average Value | |
| LOANS ORIGINATED | 35 | $218,312 | 27 | $245,252 | 0 | $0 |
| APPLICATIONS APPROVED, NOT ACCEPTED | 12 | $208,010 | 21 | $241,083 | 0 | $0 |
| APPLICATIONS DENIED | 7 | $202,019 | 7 | $224,727 | 0 | $0 |
| APPLICATIONS WITHDRAWN | 6 | $264,647 | 3 | $267,233 | 0 | $0 |
| FILES CLOSED FOR INCOMPLETENESS | 2 | $237,645 | 1 | $186,200 | 1 | $200,210 |
Detailed PMIC statistics for the following Tracts: 8045.01 , 8045.05, 8413.01, 8413.02, 8413.03, 8413.04, 8413.05
2002 - 2018 National Fire Incident Reporting System (NFIRS) incidents
- Fire incident types reported to NFIRS in Bartlett, IL
- 62148.1%Structure Fires
- 48237.3%Outside Fires
- 1269.8%Mobile Property/Vehicle Fires
- 624.8%Other
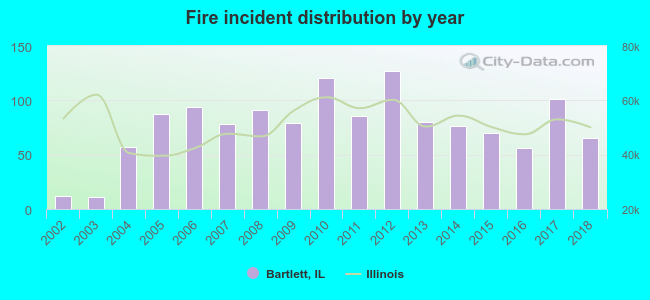 Based on the data from the years 2002 - 2018 the average number of fire incidents per year is 76. The highest number of fires - 127 took place in 2012, and the least - 11 in 2003. The data has a rising trend.
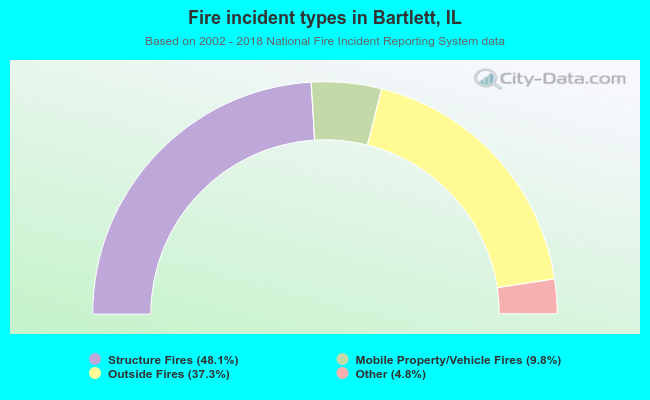 When looking into fire subcategories, the most reports belonged to: Structure Fires (48.1%), and Outside Fires (37.3%).
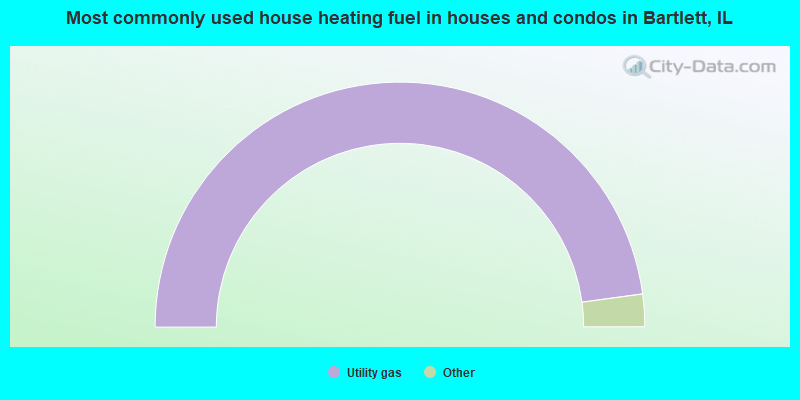
- 95.7%Utility gas
- 3.7%Electricity
- 0.5%Bottled, tank, or LP gas
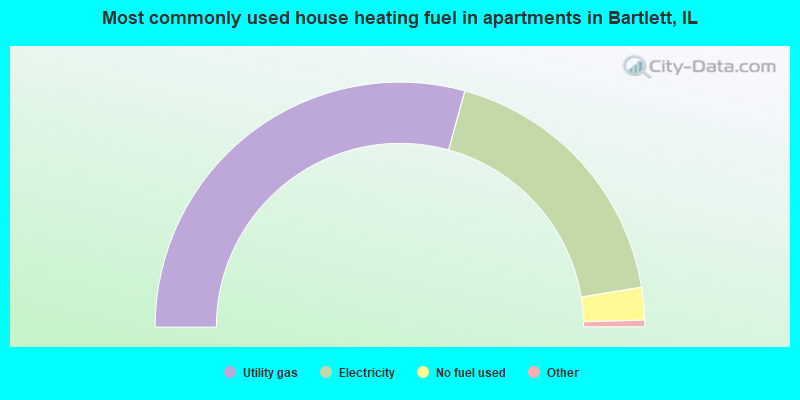
- 58.6%Utility gas
- 36.3%Electricity
- 4.3%No fuel used
- 0.5%Bottled, tank, or LP gas
- 0.4%Other fuel
Bartlett compared to Illinois state average:
- Median household income above state average.
- Unemployed percentage significantly below state average.
- Black race population percentage significantly below state average.
- Foreign-born population percentage above state average.
- Renting percentage significantly below state average.
- Length of stay since moving in above state average.
- Number of rooms per house above state average.
- House age significantly below state average.
- Percentage of population with a bachelor's degree or higher above state average.
Bartlett on our top lists:
- #45 on the list of "Top 101 cities with largest percentage of males in occupations: sales and related occupations (population 5,000+)"
- #76 on the list of "Top 101 cities with the lowest number of burglaries per 100,000 residents (population 5,000+)"
- #91 on the list of "Top 101 cities with the most residents born in Poland (population 500+)"
- #70 (60120) on the list of "Top 101 zip codes with the most big companies in 2005 (at least 1000 employees)"
- #1 on the list of "Top 101 counties with the most Black Protestant congregations"
- #1 on the list of "Top 101 counties with the most Catholic congregations"
- #1 on the list of "Top 101 counties with the highest surface withdrawal of fresh water for public supply"
- #2 on the list of "Top 101 counties with the most Black Protestant adherents"
- #2 on the list of "Top 101 counties with the most Orthodox congregations (pop. 50,000+)"

|
|
Total of 656 patent applications in 2008-2024.