Estimated zip code population in 2022: 14,810 Zip code population in 2010: 15,776 Zip code population in 2000: 15,557
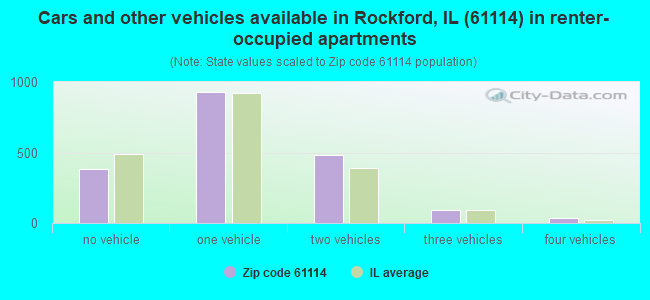
Houses and condos: 6,633 Renter-occupied apartments: 1,933
% of renters here:
30%
State:
33%
March 2022 cost of living index in zip code 61114: 85.4 (less than average, U.S. average is 100)
Land area: 8.0 sq. mi. Water area: 0.0 sq. mi.
Population density: 1,859 people per square mile
(low).
OSM Map
General Map
Google Map
MSN Map
OSM Map
General Map
Google Map
MSN Map
OSM Map
General Map
Google Map
MSN Map
OSM Map
General Map
Google Map
MSN Map
Please wait while loading the map...
Real estate property taxes paid for housing units in 2022:
This zip code:
3.1% ($5,957)
Illinois:
2.0% ($4,912)
Median real estate property taxes paid for housing units with mortgages in 2022: $5,962 (3.1%) Median real estate property taxes paid for housing units with no mortgage in 2022: $5,889 (3.0%)
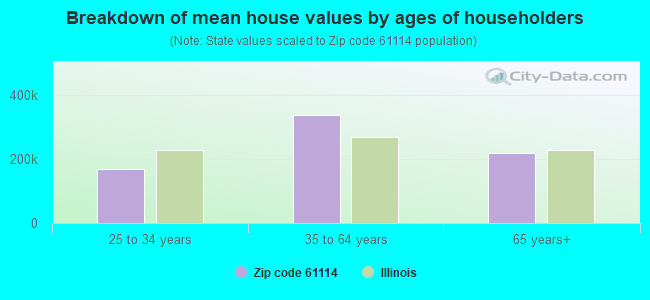
Estimated median house/condo value in 2022: $193,304
61114:
$193,304
Illinois:
$251,600
According to our research of Illinois and other state lists, there were 18 registered sex offenders living in 61114 zip code as of April 27, 2024. The ratio of all residents to sex offenders in zip code 61114 is 843 to 1. The ratio of registered sex offenders to all residents in this zip code is near the state average.
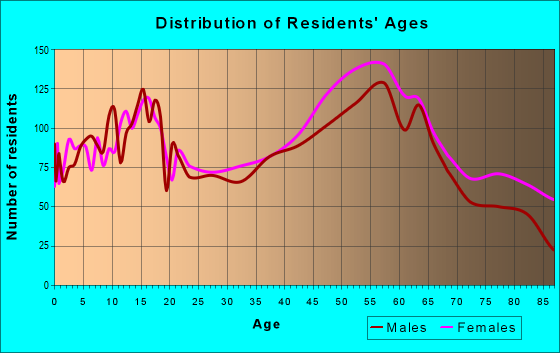
Median resident age:
This zip code:
48.8 years
Illinois median age:
39.1 years
Average household size:
This zip code:
2.2 people
Illinois:
2.4 people
Averages for the 2020 tax year for zip code 61114, filed in 2021:
Average Adjusted Gross Income (AGI) in 2020: $84,652 (Individual Income Tax Returns)
Here:
$84,652
State:
$82,626
Salary/wage: $67,343 (reported on 75.5% of returns)
Here:
$67,343
State:
$66,640
(% of AGI for various income ranges: 1027.8% for AGIs below $25k, 3095.1% for AGIs $25k-50k, 5833.1% for AGIs $50k-75k, 7990.7% for AGIs $75k-100k, 15503.7% for AGIs $100k-200k, 64445.3% for AGIs over 200k)
Taxable interest for individuals: $2,001 (reported on 37.4% of returns)
This zip code:
$2,001
Illinois:
$2,376
(% of AGI for various income ranges: 22.6% for AGIs below $25k, 34.7% for AGIs $25k-50k, 55.9% for AGIs $50k-75k, 107.5% for AGIs $75k-100k, 183.8% for AGIs $100k-200k, 1307.4% for AGIs over 200k)
Ordinary dividends: $11,222 (reported on 29.7% of returns)
Here:
$11,222
State:
$9,061
(% of AGI for various income ranges: 59.1% for AGIs below $25k, 86.5% for AGIs $25k-50k, 220.0% for AGIs $50k-75k, 293.2% for AGIs $75k-100k, 621.9% for AGIs $100k-200k, 8155.3% for AGIs over 200k)
Net capital gain/loss in AGI: +$13,739 (reported on 27.1% of returns)
Here:
+$13,739
State:
+$31,684
(% of AGI for various income ranges: 12.5% for AGIs below $25k, 50.7% for AGIs $25k-50k, 135.4% for AGIs $50k-75k, 251.3% for AGIs $75k-100k, 591.5% for AGIs $100k-200k, 11032.1% for AGIs over 200k)
Profit/loss from business: +$18,411 (reported on 14.6% of returns)
Here:
+$18,411
State:
+$12,175
(% of AGI for various income ranges: 94.3% for AGIs below $25k, 120.5% for AGIs $25k-50k, 197.5% for AGIs $50k-75k, 300.5% for AGIs $75k-100k, 596.9% for AGIs $100k-200k, 5151.6% for AGIs over 200k)
Taxable individual retirement arrangement distribution: $23,680 (reported on 17.2% of returns)
61114:
$23,680
Illinois:
$21,613
(% of AGI for various income ranges: 123.6% for AGIs below $25k, 242.5% for AGIs $25k-50k, 443.6% for AGIs $50k-75k, 683.2% for AGIs $75k-100k, 1119.0% for AGIs $100k-200k, 5306.3% for AGIs over 200k)
Self-employed (Keogh) retirement plans: $26,083 (reported on 0.8% of returns)
61114:
$26,083
Illinois:
$30,962
(% of AGI for various income ranges: 57.8% for AGIs $100k-200k, 577.4% for AGIs over 200k)
Total itemized deductions: $39,574 (reported on 9.2% of returns)
Here:
$39,574
State:
$34,948
(% of AGI for various income ranges: 65.5% for AGIs below $25k, 168.3% for AGIs $25k-50k, 327.3% for AGIs $50k-75k, 567.3% for AGIs $75k-100k, 763.2% for AGIs $100k-200k, 6955.8% for AGIs over 200k)
Charity contributions: $16,835 (reported on 7.7% of returns)
Here:
$16,835
State:
$13,122
(% of AGI for various income ranges: 3.2% for AGIs below $25k, 34.0% for AGIs $25k-50k, 68.5% for AGIs $50k-75k, 150.0% for AGIs $75k-100k, 269.4% for AGIs $100k-200k, 3168.9% for AGIs over 200k)
Taxes paid: $8,215 (reported on 9.1% of returns)
61114:
$8,215
State:
$8,563
(% of AGI for various income ranges: 11.7% for AGIs below $25k, 33.7% for AGIs $25k-50k, 104.2% for AGIs $50k-75k, 152.9% for AGIs $75k-100k, 225.1% for AGIs $100k-200k, 883.7% for AGIs over 200k)
Earned income credit: $2,300 (reported on 11.4% of returns)
Here:
$2,300
State:
$2,311
(% of AGI for various income ranges: 79.8% for AGIs below $25k, 59.7% for AGIs $25k-50k)
Percentage of individuals using paid preparers for their 2020 taxes: 93.2%
Here:
93%
State:
93%
(% for various income ranges: 91.4% for AGIs below $25k, 93.4% for AGIs $25k-50k, 93.8% for AGIs $50k-75k, 94.0% for AGIs $75k-100k, 93.8% for AGIs $100k-200k, 96.3% for AGIs over 200k)
Averages for the 2012 tax year for zip code 61114, filed in 2013:
Average Adjusted Gross Income (AGI) in 2012: $78,988 (Individual Income Tax Returns)
Here:
$78,988
State:
$68,058
Salary/wage: $63,516 (reported on 77.7% of returns)
Here:
$63,516
State:
$55,396
(% of AGI for various income ranges: 67.1% for AGIs below $25k, 68.1% for AGIs $25k-50k, 66.7% for AGIs $50k-75k, 66.1% for AGIs $75k-100k, 67.9% for AGIs $100k-200k, 53.2% for AGIs over 200k)
Taxable interest for individuals: $1,904 (reported on 47.1% of returns)
This zip code:
$1,904
Illinois:
$1,969
(% of AGI for various income ranges: 2.1% for AGIs below $25k, 1.2% for AGIs $25k-50k, 0.9% for AGIs $50k-75k, 0.9% for AGIs $75k-100k, 0.9% for AGIs $100k-200k, 1.4% for AGIs over 200k)
Ordinary dividends: $9,192 (reported on 33.9% of returns)
Here:
$9,192
State:
$7,786
(% of AGI for various income ranges: 4.5% for AGIs below $25k, 2.6% for AGIs $25k-50k, 2.7% for AGIs $50k-75k, 3.0% for AGIs $75k-100k, 2.6% for AGIs $100k-200k, 6.0% for AGIs over 200k)
Net capital gain/loss in AGI: +$12,311 (reported on 28.3% of returns)
Here:
+$12,311
State:
+$22,183
(% of AGI for various income ranges: 0.4% for AGIs $25k-50k, 0.2% for AGIs $50k-75k, 0.7% for AGIs $75k-100k, 1.5% for AGIs $100k-200k, 11.2% for AGIs over 200k)
Profit/loss from business: +$22,745 (reported on 15.4% of returns)
Here:
+$22,745
State:
+$12,903
(% of AGI for various income ranges: 5.6% for AGIs below $25k, 2.8% for AGIs $25k-50k, 2.8% for AGIs $50k-75k, 3.3% for AGIs $75k-100k, 3.6% for AGIs $100k-200k, 6.3% for AGIs over 200k)
Taxable individual retirement arrangement distribution: $19,682 (reported on 19.2% of returns)
61114:
$19,682
Illinois:
$17,929
(% of AGI for various income ranges: 7.2% for AGIs below $25k, 6.3% for AGIs $25k-50k, 5.8% for AGIs $50k-75k, 5.8% for AGIs $75k-100k, 5.6% for AGIs $100k-200k, 2.7% for AGIs over 200k)
Self-employment retirement plans: $21,340 (reported on 1.3% of returns)
61114:
$21,340
Illinois:
$24,666
Total itemized deductions: $25,625 (20% of AGI, reported on 48.6% of returns)
Here:
$25,625
State:
$26,433
Here:
19.6% of AGI
State:
19.2% of AGI
(% of AGI for various income ranges: 18.1% for AGIs below $25k, 16.4% for AGIs $25k-50k, 17.7% for AGIs $50k-75k, 17.5% for AGIs $75k-100k, 16.1% for AGIs $100k-200k, 13.8% for AGIs over 200k)
Charity contributions: $5,662 (reported on 42.2% of returns)
Here:
$5,662
State:
$4,525
(% of AGI for various income ranges: 1.7% for AGIs below $25k, 2.0% for AGIs $25k-50k, 2.6% for AGIs $50k-75k, 2.7% for AGIs $75k-100k, 2.8% for AGIs $100k-200k, 3.9% for AGIs over 200k)
Taxes paid: $11,940 (reported on 48.4% of returns)
61114:
$11,940
State:
$11,968
(% of AGI for various income ranges: 5.1% for AGIs below $25k, 5.7% for AGIs $25k-50k, 7.3% for AGIs $50k-75k, 7.9% for AGIs $75k-100k, 8.3% for AGIs $100k-200k, 7.0% for AGIs over 200k)
Earned income credit: $2,146 (reported on 10.4% of returns)
Here:
$2,146
State:
$2,349
(% of AGI for various income ranges: 4.5% for AGIs below $25k, 0.8% for AGIs $25k-50k)
Percentage of individuals using paid preparers for their 2012 taxes: 54.7%
Here:
55%
State:
57%
(% for various income ranges: 44.4% for AGIs below $25k, 54.7% for AGIs $25k-50k, 54.7% for AGIs $50k-75k, 61.4% for AGIs $75k-100k, 61.5% for AGIs $100k-200k, 82.2% for AGIs over 200k)
Averages for the 2004 tax year for zip code 61114, filed in 2005:
Average Adjusted Gross Income (AGI) in 2004: $70,823 (Individual Income Tax Returns)
Here:
$70,823
State:
$54,625
Salary/wage: $57,554 (reported on 79.6% of returns)
Here:
$57,554
State:
$46,811
(% of AGI for various income ranges: 141.8% for AGIs below $10k, 60.5% for AGIs $10k-25k, 70.4% for AGIs $25k-50k, 73.8% for AGIs $50k-75k, 77.2% for AGIs $75k-100k, 58.5% for AGIs over 100k)
Taxable interest for individuals: $2,855 (reported on 59.4% of returns)
This zip code:
$2,855
Illinois:
$2,101
(% of AGI for various income ranges: 14.5% for AGIs below $10k, 5.9% for AGIs $10k-25k, 3.0% for AGIs $25k-50k, 2.1% for AGIs $50k-75k, 1.9% for AGIs $75k-100k, 2.1% for AGIs over 100k)
Taxable dividends: $4,581 (reported on 41.4% of returns)
Here:
$4,581
State:
$4,306
(% of AGI for various income ranges: 18.1% for AGIs below $10k, 4.6% for AGIs $10k-25k, 2.9% for AGIs $25k-50k, 2.1% for AGIs $50k-75k, 1.9% for AGIs $75k-100k, 2.6% for AGIs over 100k)
Net capital gain/loss: +$14,167 (reported on 34.5% of returns)
Here:
+$14,167
State:
+$17,321
(% of AGI for various income ranges: -6.0% for AGIs below $10k, 0.2% for AGIs $10k-25k, 0.4% for AGIs $25k-50k, 1.0% for AGIs $50k-75k, 1.4% for AGIs $75k-100k, 10.9% for AGIs over 100k)
Profit/loss from business: +$21,892 (reported on 16.2% of returns)
Here:
+$21,892
State:
+$11,771
(% of AGI for various income ranges: 12.0% for AGIs below $10k, 3.9% for AGIs $10k-25k, 3.5% for AGIs $25k-50k, 2.7% for AGIs $50k-75k, 4.6% for AGIs $75k-100k, 5.8% for AGIs over 100k)
Profit/loss from farming: +$2,000 (reported on 0.1% of returns)
Here:
+$2,000
State:
+$2,327
IRA payment deduction: $3,513 (reported on 2.9% of returns)
61114:
$3,513
Illinois:
$3,087
(% of AGI for various income ranges: 0.3% for AGIs $10k-25k, 0.4% for AGIs $25k-50k, 0.2% for AGIs $50k-75k, 0.2% for AGIs $75k-100k, 0.1% for AGIs over 100k)
Self-employed pension: $14,494 (reported on 2.0% of returns)
Here:
$14,494
Illinois:
$16,965
(% of AGI for various income ranges: 0.2% for AGIs $25k-50k, 0.1% for AGIs $50k-75k, 0.4% for AGIs $75k-100k, 0.5% for AGIs over 100k)
Total itemized deductions: $20,705 (18% of AGI, reported on 51.1% of returns)
Here:
$20,705
State:
$20,239
Here:
17.9% of AGI
State:
19.5% of AGI
(% of AGI for various income ranges: 37.4% for AGIs below $10k, 20.7% for AGIs $10k-25k, 18.7% for AGIs $25k-50k, 19.5% for AGIs $50k-75k, 17.3% for AGIs $75k-100k, 12.3% for AGIs over 100k)
Charity contributions deductions: $5,137 (4% of AGI, reported on 47.0% of returns)
Here:
$5,137
State:
$3,719
Here:
4.3% of AGI
State:
3.4% of AGI
(% of AGI for various income ranges: 1.7% for AGIs below $10k, 2.7% for AGIs $10k-25k, 2.8% for AGIs $25k-50k, 3.0% for AGIs $50k-75k, 3.1% for AGIs $75k-100k, 3.7% for AGIs over 100k)
Total tax: $14,234 (reported on 76.7% of returns)
61114:
$14,234
State:
$9,882
(% of AGI for various income ranges: 4.3% for AGIs below $10k, 3.9% for AGIs $10k-25k, 7.1% for AGIs $25k-50k, 8.9% for AGIs $50k-75k, 10.5% for AGIs $75k-100k, 20.0% for AGIs over 100k)
Earned income credit: $1,608 (reported on 7.6% of returns)
Here:
$1,608
State:
$1,788
Percentage of individuals using paid preparers for their 2004 taxes: 58.5%
Here:
59%
State:
61%
(% for various income ranges: 48.9% for AGIs below $10k, 58.3% for AGIs $10k-25k, 58.0% for AGIs $25k-50k, 61.5% for AGIs $50k-75k, 58.7% for AGIs $75k-100k, 68.0% for AGIs over 100k)
Likely homosexual households (counted as self-reported same-sex unmarried-partner households)
Lesbian couples: 0.3% of all households
Gay men: 0.2% of all households
Household received Food Stamps/SNAP in the past 12 months: 551 Household did not receive Food Stamps/SNAP in the past 12 months: 5,883
Women who had a birth in the past 12 months: 158 (51 now married, 107 unmarried) Women who did not have a birth in the past 12 months: 2,606 (960 now married, 1,648 unmarried)
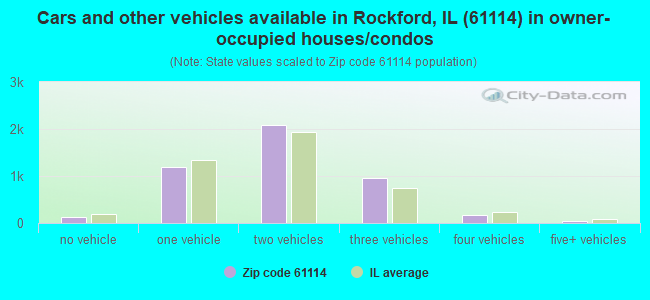
Housing units in zip code 61114 with a mortgage: 2,719 (311 second mortgage, 11 home equity loan, 260 both second mortgage and home equity loan) Houses without a mortgage: 84
Median monthly owner costs for units with a mortgage: $1,569 Median monthly owner costs for units without a mortgage: $832
Residents with income below the poverty level in 2022:
This zip code:
8.0%
Whole state:
11.9%
Residents with income below 50% of the poverty level in 2022:
This zip code:
3.3%
Whole state:
5.7%
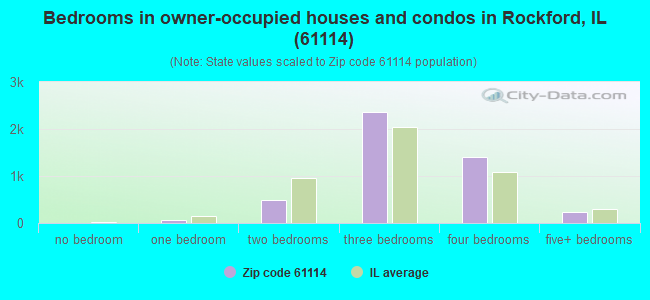
Median number of rooms in houses and condos:
Here:
7.5
State:
6.4
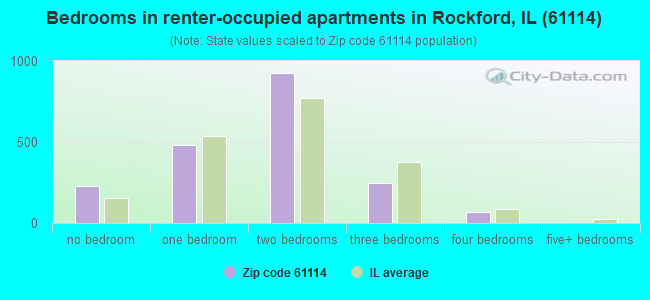
Median number of rooms in apartments:
Here:
4.0
State:
4.1
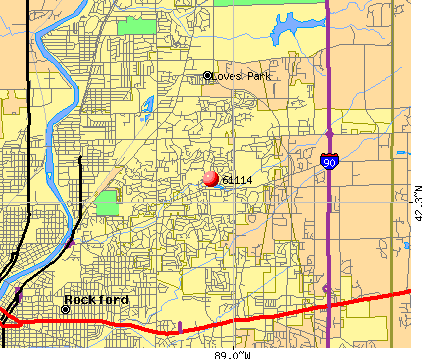
Notable locations in this zip code not listed on our city pages
Notable locations in zip code 61114: Forest Hills Country Club (A), North Park Fire Protection District Alpine Road Station (B), Alpine Health Center (C), Mount Saint Francis Nursing Home for Nuns (D), Fairview Home (E), Rockford Fire Department Station 4 and Ambulance Service (F). Display/hide their locations on the map
Churches in zip code 61114 include: First Evangelical Free Church (A), North Love Baptist Church (B), Calvary Memorial Church (C), First Assembly of God Church (D), Forest City Baptist Church (E), Forest Hills Evangelical Free Church (F), Grace Fellowship Church (G), Hope Reformed Church (H), Northeast Christian Church (I). Display/hide their locations on the map
Parks in zip code 61114 include: Landstrom Park (1), Hillview Park (2), Alpine Meadows Playground (3), Gambino Park (4), Hunter Park (5). Display/hide their locations on the map
In group quarters: 302 (-1 institutionalized population)
Size of family households: 2,176 2-persons, 1,068 3-persons, 552 4-persons, 180 5-persons, 74 6-persons, 79 7-or-more-persons
Size of nonfamily households: 2,071 1-person, 227 2-persons, 61 3-persons
1,644 married couples with children.
878 single-parent households (200 men, 678 women).
85.3% of residents of 61114 zip code speak English at home.
7.8% of residents speak Spanish at home (82% very well, 10% well, 7% not well, 1% not at all).
4.2% of residents speak other Indo-European language at home (72% very well, 24% well, 5% not well).
2.7% of residents speak Asian or Pacific Island language at home (90% very well, 10% well).
0.7% of residents speak other language at home (100% very well).
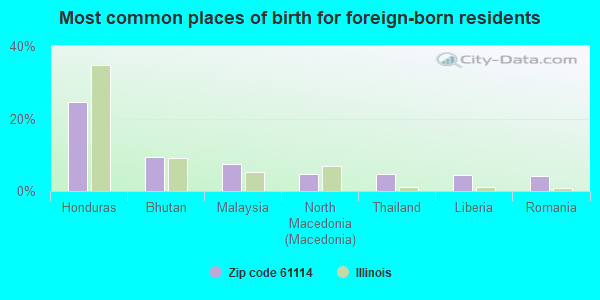
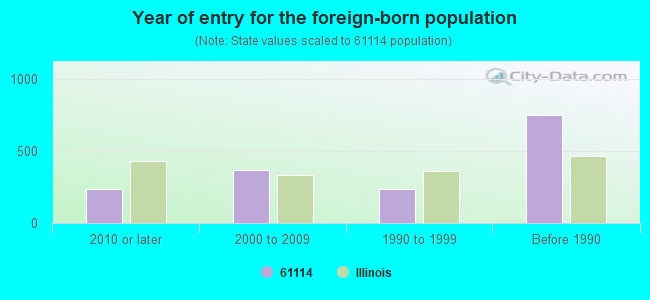
Foreign born population: 1,512 (10.2%) (74.0% of them are naturalized citizens)
Facilities with environmental interests located in this zip code:
PARFECTION CUSTOM GOLF (5843 FOREST HILLS RD in ROCKFORD, IL)
STATE MASTER (Illinois EPA Project) - HAZARDOUS WASTE PROGRAM (Resource Conservation and Recovery Act (tracking hazardous waste)) Organizations: BURCH ERIC (CONTACT/OWNER)
COR MARIAE CENTER (3330 MARIE LINDEN DR in ROCKFORD, IL)
STATE MASTER (Illinois EPA Project) - SOLID WASTE PROGRAM, HAZARDOUS WASTE PROGRAM Conditionally Exempt Small Quantity Generators, less than 100 kg/month of hazardous waste (Resource Conservation and Recovery Act (tracking hazardous waste)) - notification USED OIL PROGRAM (Resource Conservation and Recovery Act (tracking hazardous waste)) Organizations: SERVANT COR (CONTACT/OWNER)
DAVIG S CUSTOM CLEANERS (2625 N MULFORD in ROCKFORD, IL)
STATE MASTER (Illinois EPA Project) - AIR PROGRAM Small Quantity Generators, between 100 kg and 1000 kg of hazardous waste/month (Resource Conservation and Recovery Act (tracking hazardous waste)) - notification Organizations: LEWIS JIM (CONTACT/OWNER)
Alternative names: DAVIGS CUSTOM CLEANERS
RIVERSIDE CRASH 1 (1719 E RIVERSIDE BLVD in ROCKFORD, IL)
STATE MASTER (Illinois EPA Project) - HAZARDOUS WASTE PROGRAM Small Quantity Generators, between 100 kg and 1000 kg of hazardous waste/month (Resource Conservation and Recovery Act (tracking hazardous waste)) Organizations: RIVERSIDE CRASH1 (CONTACT/OPERATOR)
, FAYEZ MIZED (CONTACT/OWNER)
Alternative names: RIVERSIDE CRASH1
DAVIG'S CUSTOM CLEANERS (2625 N. MULFORD RD. in ROCKFORD, IL)
AIR MINOR (AIRS/AFS) CRITERIA AND HAZARDOUS AIR POLLUTANT INVENTORY (Inventory of air pollution sources) Business SIC classification: DRYCLEANING PLANTS, EXCEPT RUG CLEANING Business NAICS classification: DRYCLEANING AND LAUNDRY SERVICES (EXCEPT COIN-OPERATED).
ALL TUNE & LUBE (6655 E RIVERSIDE RD in ROCKFORD, IL)
Conditionally Exempt Small Quantity Generators, less than 100 kg/month of hazardous waste (Resource Conservation and Recovery Act (tracking hazardous waste)) Business NAICS classification: AUTOMOTIVE TRANSMISSION REPAIR.; AUTOMOTIVE OIL CHANGE AND LUBRICATION SHOPS.; ALL OTHER AUTOMOTIVE REPAIR AND MAINTENANCE. Organizations: JAY FLORA (CONTACT/OPERATOR)
Alternative names: ABSOLUTE AUTO REPAIR
ALPHINE CLEANERS (6551 E RIVERSIDE in ROCKFORD, IL)
Conditionally Exempt Small Quantity Generators, less than 100 kg/month of hazardous waste (Resource Conservation and Recovery Act (tracking hazardous waste)) - notification Organizations: ALPINE CLEANERS (CONTACT/OWNER)
NORTH LOVE CHRISTIAN SCH (5301 EAST RIVERSIDE in ROCKFORD, IL)
COMPLIANCE ACTIVITY (Tracking inspections of insecticide, fungicide, and rodenticide, and toxic substances)
ROCKFORD FIRE DEPT STATION #4 (2959 SHAW WOOD RD in ROCKFORD, IL)
Conditionally Exempt Small Quantity Generators, less than 100 kg/month of hazardous waste (Resource Conservation and Recovery Act (tracking hazardous waste)) - notification Organizations: ROCKFORD FIRE DEPT CITY OF (CONTACT/OWNER)
CHRISTIAN LIFE CENTER SCH (5950 SPRING CREEK ROAD in ROCKFORD, IL)
COMPLIANCE ACTIVITY (Tracking inspections of insecticide, fungicide, and rodenticide, and toxic substances) Business SIC classification: ELEMENTARY AND SECONDARY SCHOOLS
CHRISTIAN LEARN-N-CARE (6413 FOREST HILLS RD in ROCKFORD, IL)
COMPLIANCE ACTIVITY (Tracking inspections of insecticide, fungicide, and rodenticide, and toxic substances)
Housing units lacking complete plumbing facilities: 0.2% Housing units lacking complete kitchen facilities: 3.0%
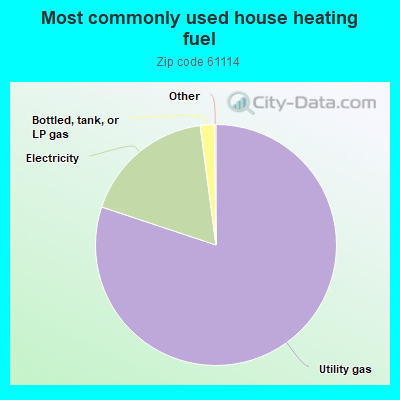
80.2%Utility gas
17.8%Electricity
1.9%Bottled, tank, or LP gas
Place of birth for U.S.-born residents:
This state: 10,064
Northeast: 385
Midwest: 1,850
South: 380
West: 506
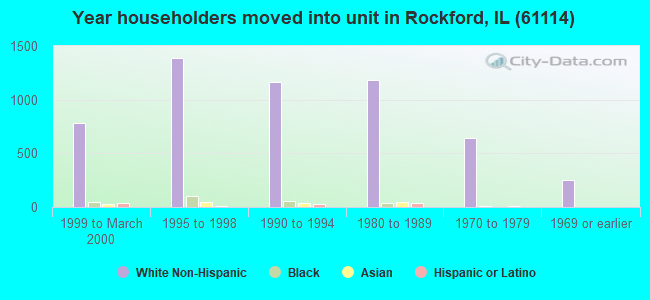
63% of the 61114 zip code residents lived in the same house 5 years ago. Out of people who lived in different houses, 66% lived in this county. Out of people who lived in different counties, 50% lived in Illinois.
90% of the 61114 zip code residents lived in the same house 1 year ago. Out of people who lived in different houses, 59% moved from this county. Out of people who lived in different houses, 26% moved from different county within same state. Out of people who lived in different houses, 14% moved from different state.
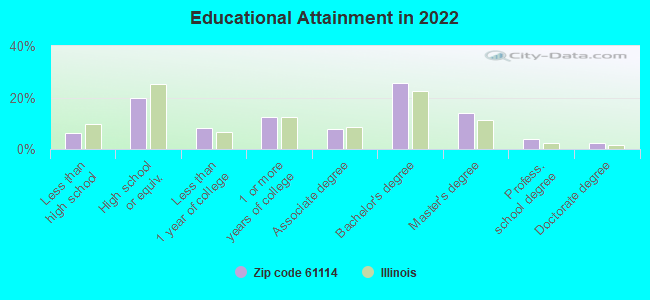
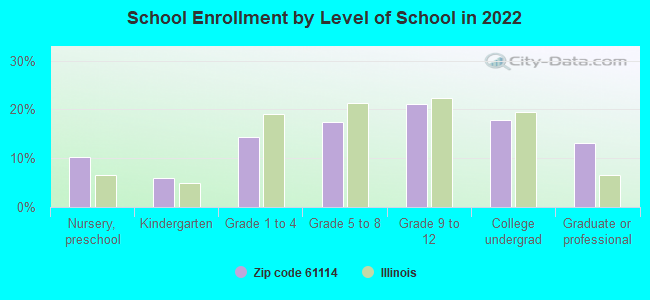
Private vs. public school enrollment:
Students in private schools in grades 1 to 8 (elementary and middle school): 433
Here:
40.8%
Illinois:
13.3%
Students in private schools in grades 9 to 12 (high school): 280
Here:
40.9%
Illinois:
9.9%
Students in private undergraduate colleges: 72
Here:
12.4%
Illinois:
27.4%
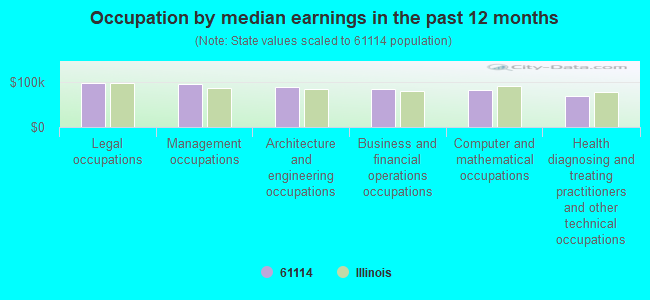
Occupation by median earnings in the past 12 months ($)
98,207Legal occupations
95,569Management occupations
89,078Architecture and engineering occupations
84,942Business and financial operations occupations
83,166Computer and mathematical occupations
68,636Health diagnosing and treating practitioners and other technical occupations
Companies with federal contracts located in this zip code:
PPC, INC (71 SPRING BROOK RD in ROCKFORD, IL; small business)
$85,800 with Air Force for Guard Services. Taking place in CA. Signed on 2005-10-31. Completion date: 2006-09-30.
FORMIDABLE BUSINESS SOLUTIONS (2625 N MULFORD RD STE 123 in ROCKFORD, IL; small business)
$17,414 with Army for Office Furniture. Signed on 2005-09-22. Completion date: 2006-03-24.
Top industries in this zip code by the number of employees in 2005:
Administrative and Support and Waste Management and Remediation Services: Professional Employer Organizations (500-999 employees: 1 establishment, 50-99 employees: 1 establishment)
2002 - 2018 National Fire Incident Reporting System (NFIRS) incidents
Based on the data from the years 2002 - 2018 the average number of fire incidents per year is 24. The highest number of fires - 36 took place in 2012, and the least - 1 in 2004. The data has a dropping trend.
When looking into fire subcategories, the most reports belonged to: Structure Fires (38.4%), and Outside Fires (30.7%).
Fire incident types reported to NFIRS in Zip Code 61114
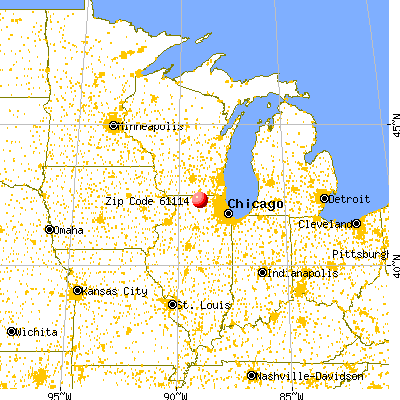


 Nearest zip codes: 61107, 61111, 61108, 61112, 61115, 61103.


 Based on the data from the years 2002 - 2018 the average number of fire incidents per year is 24. The highest number of fires - 36 took place in 2012, and the least - 1 in 2004. The data has a dropping trend.
 When looking into fire subcategories, the most reports belonged to: Structure Fires (38.4%), and Outside Fires (30.7%).