Estimated zip code population in 2022: 28,981 Zip code population in 2010: 30,439 Zip code population in 2000: 30,040
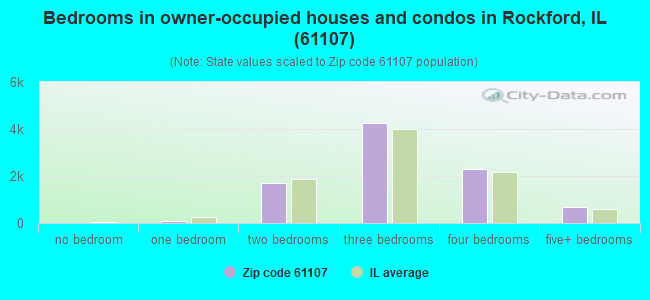
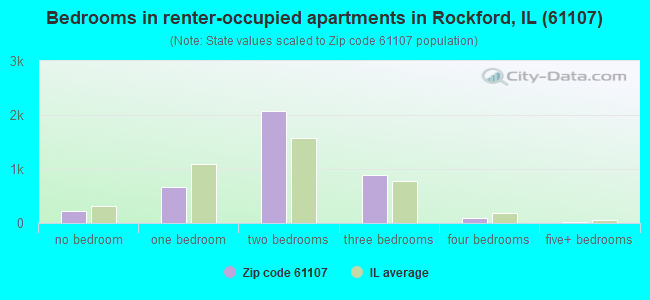
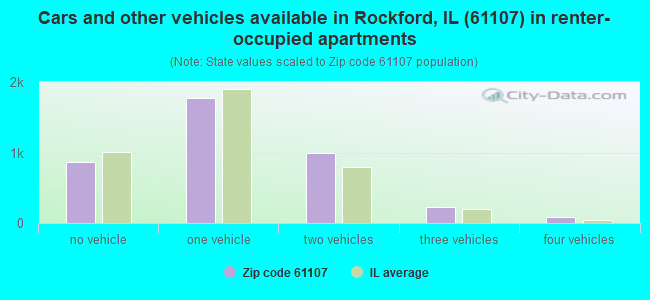
Houses and condos: 13,801 Renter-occupied apartments: 3,986
% of renters here:
31%
State:
33%
March 2022 cost of living index in zip code 61107: 84.6 (less than average, U.S. average is 100)
Land area: 14.8 sq. mi. Water area: 0.1 sq. mi.
Population density: 1,955 people per square mile
(low).
OSM Map
General Map
Google Map
MSN Map
OSM Map
General Map
Google Map
MSN Map
OSM Map
General Map
Google Map
MSN Map
OSM Map
General Map
Google Map
MSN Map
Please wait while loading the map...
Real estate property taxes paid for housing units in 2022:
This zip code:
2.7% ($4,504)
Illinois:
2.0% ($4,912)
Median real estate property taxes paid for housing units with mortgages in 2022: $4,431 (2.7%) Median real estate property taxes paid for housing units with no mortgage in 2022: $4,620 (2.7%)
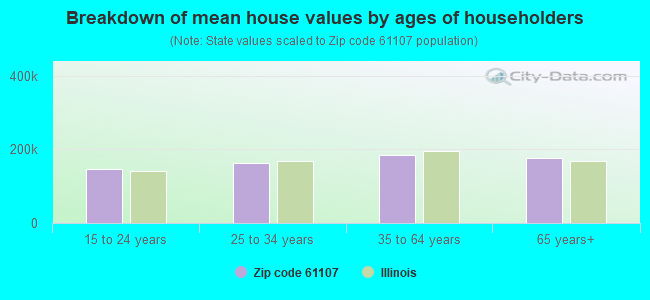
Estimated median house/condo value in 2022: $164,261
61107:
$164,261
Illinois:
$251,600
According to our research of Illinois and other state lists, there were 43 registered sex offenders living in 61107 zip code as of April 27, 2024. The ratio of all residents to sex offenders in zip code 61107 is 743 to 1. The ratio of registered sex offenders to all residents in this zip code is near the state average.
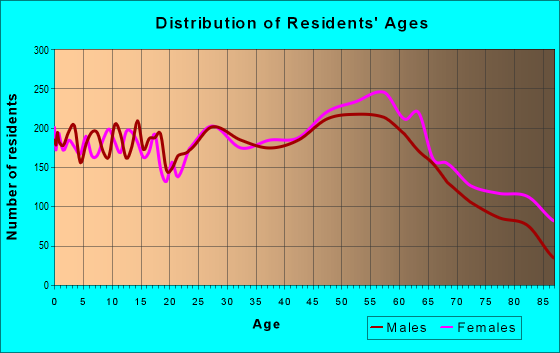
Median resident age:
This zip code:
43.6 years
Illinois median age:
39.1 years
Average household size:
This zip code:
2.2 people
Illinois:
2.4 people
Averages for the 2020 tax year for zip code 61107, filed in 2021:
Average Adjusted Gross Income (AGI) in 2020: $70,835 (Individual Income Tax Returns)
Here:
$70,835
State:
$82,626
Salary/wage: $56,883 (reported on 80.0% of returns)
Here:
$56,883
State:
$66,640
(% of AGI for various income ranges: 1065.3% for AGIs below $25k, 3434.5% for AGIs $25k-50k, 6105.1% for AGIs $50k-75k, 8558.0% for AGIs $75k-100k, 15649.4% for AGIs $100k-200k, 67904.3% for AGIs over 200k)
Taxable interest for individuals: $1,840 (reported on 29.5% of returns)
This zip code:
$1,840
Illinois:
$2,376
(% of AGI for various income ranges: 14.3% for AGIs below $25k, 25.2% for AGIs $25k-50k, 31.7% for AGIs $50k-75k, 72.5% for AGIs $75k-100k, 172.0% for AGIs $100k-200k, 1526.5% for AGIs over 200k)
Ordinary dividends: $8,824 (reported on 23.0% of returns)
Here:
$8,824
State:
$9,061
(% of AGI for various income ranges: 38.3% for AGIs below $25k, 62.5% for AGIs $25k-50k, 102.0% for AGIs $50k-75k, 211.2% for AGIs $75k-100k, 735.6% for AGIs $100k-200k, 6286.1% for AGIs over 200k)
Net capital gain/loss in AGI: +$15,577 (reported on 20.8% of returns)
Here:
+$15,577
State:
+$31,684
(% of AGI for various income ranges: 9.6% for AGIs below $25k, 38.7% for AGIs $25k-50k, 96.5% for AGIs $50k-75k, 168.8% for AGIs $75k-100k, 766.1% for AGIs $100k-200k, 15097.0% for AGIs over 200k)
Profit/loss from business: +$16,274 (reported on 13.9% of returns)
Here:
+$16,274
State:
+$12,175
(% of AGI for various income ranges: 102.2% for AGIs below $25k, 103.0% for AGIs $25k-50k, 134.1% for AGIs $50k-75k, 213.9% for AGIs $75k-100k, 377.6% for AGIs $100k-200k, 7917.8% for AGIs over 200k)
Taxable individual retirement arrangement distribution: $22,151 (reported on 12.7% of returns)
61107:
$22,151
Illinois:
$21,613
(% of AGI for various income ranges: 77.4% for AGIs below $25k, 154.9% for AGIs $25k-50k, 268.4% for AGIs $50k-75k, 439.6% for AGIs $75k-100k, 1182.0% for AGIs $100k-200k, 4992.2% for AGIs over 200k)
Self-employed (Keogh) retirement plans: $25,157 (reported on 0.5% of returns)
61107:
$25,157
Illinois:
$30,962
(% of AGI for various income ranges: 33.9% for AGIs $75k-100k, 604.8% for AGIs over 200k)
Total itemized deductions: $33,745 (reported on 6.9% of returns)
Here:
$33,745
State:
$34,948
(% of AGI for various income ranges: 56.4% for AGIs below $25k, 83.1% for AGIs $25k-50k, 258.1% for AGIs $50k-75k, 412.9% for AGIs $75k-100k, 764.0% for AGIs $100k-200k, 5319.1% for AGIs over 200k)
Charity contributions: $14,241 (reported on 5.6% of returns)
Here:
$14,241
State:
$13,122
(% of AGI for various income ranges: 3.6% for AGIs below $25k, 11.8% for AGIs $25k-50k, 45.0% for AGIs $50k-75k, 91.1% for AGIs $75k-100k, 246.2% for AGIs $100k-200k, 2974.3% for AGIs over 200k)
Taxes paid: $7,869 (reported on 6.9% of returns)
61107:
$7,869
State:
$8,563
(% of AGI for various income ranges: 7.8% for AGIs below $25k, 15.9% for AGIs $25k-50k, 74.6% for AGIs $50k-75k, 130.2% for AGIs $75k-100k, 197.6% for AGIs $100k-200k, 990.4% for AGIs over 200k)
Earned income credit: $2,357 (reported on 15.1% of returns)
Here:
$2,357
State:
$2,311
(% of AGI for various income ranges: 97.7% for AGIs below $25k, 65.1% for AGIs $25k-50k, 1.2% for AGIs $50k-75k)
Percentage of individuals using paid preparers for their 2020 taxes: 93.6%
Here:
94%
State:
93%
(% for various income ranges: 92.0% for AGIs below $25k, 94.1% for AGIs $25k-50k, 94.2% for AGIs $50k-75k, 94.2% for AGIs $75k-100k, 94.9% for AGIs $100k-200k, 94.5% for AGIs over 200k)
Averages for the 2012 tax year for zip code 61107, filed in 2013:
Average Adjusted Gross Income (AGI) in 2012: $65,343 (Individual Income Tax Returns)
Here:
$65,343
State:
$68,058
Salary/wage: $51,895 (reported on 81.1% of returns)
Here:
$51,895
State:
$55,396
(% of AGI for various income ranges: 70.8% for AGIs below $25k, 77.4% for AGIs $25k-50k, 73.2% for AGIs $50k-75k, 70.0% for AGIs $75k-100k, 68.7% for AGIs $100k-200k, 47.1% for AGIs over 200k)
Taxable interest for individuals: $1,668 (reported on 39.2% of returns)
This zip code:
$1,668
Illinois:
$1,969
(% of AGI for various income ranges: 1.5% for AGIs below $25k, 0.8% for AGIs $25k-50k, 0.8% for AGIs $50k-75k, 0.8% for AGIs $75k-100k, 1.1% for AGIs $100k-200k, 1.0% for AGIs over 200k)
Ordinary dividends: $8,207 (reported on 27.0% of returns)
Here:
$8,207
State:
$7,786
(% of AGI for various income ranges: 3.0% for AGIs below $25k, 1.8% for AGIs $25k-50k, 2.1% for AGIs $50k-75k, 2.2% for AGIs $75k-100k, 3.3% for AGIs $100k-200k, 5.4% for AGIs over 200k)
Net capital gain/loss in AGI: +$9,681 (reported on 21.9% of returns)
Here:
+$9,681
State:
+$22,183
(% of AGI for various income ranges: 0.4% for AGIs $25k-50k, 0.3% for AGIs $50k-75k, 0.6% for AGIs $75k-100k, 1.7% for AGIs $100k-200k, 9.2% for AGIs over 200k)
Profit/loss from business: +$14,166 (reported on 14.5% of returns)
Here:
+$14,166
State:
+$12,903
(% of AGI for various income ranges: 7.1% for AGIs below $25k, 2.4% for AGIs $25k-50k, 1.3% for AGIs $50k-75k, 2.4% for AGIs $75k-100k, 3.1% for AGIs $100k-200k, 3.8% for AGIs over 200k)
Taxable individual retirement arrangement distribution: $18,273 (reported on 16.4% of returns)
61107:
$18,273
Illinois:
$17,929
(% of AGI for various income ranges: 6.7% for AGIs below $25k, 4.2% for AGIs $25k-50k, 4.3% for AGIs $50k-75k, 4.7% for AGIs $75k-100k, 4.7% for AGIs $100k-200k, 4.2% for AGIs over 200k)
Self-employment retirement plans: $26,567 (reported on 0.8% of returns)
61107:
$26,567
Illinois:
$24,666
(% of AGI for various income ranges: 0.2% for AGIs $50k-75k, 0.3% for AGIs $100k-200k, 0.8% for AGIs over 200k)
Total itemized deductions: $23,110 (20% of AGI, reported on 41.1% of returns)
Here:
$23,110
State:
$26,433
Here:
20.1% of AGI
State:
19.2% of AGI
(% of AGI for various income ranges: 15.5% for AGIs below $25k, 12.9% for AGIs $25k-50k, 15.0% for AGIs $50k-75k, 15.4% for AGIs $75k-100k, 15.9% for AGIs $100k-200k, 13.2% for AGIs over 200k)
Charity contributions: $4,872 (reported on 34.0% of returns)
Here:
$4,872
State:
$4,525
(% of AGI for various income ranges: 1.2% for AGIs below $25k, 1.5% for AGIs $25k-50k, 1.9% for AGIs $50k-75k, 2.2% for AGIs $75k-100k, 3.0% for AGIs $100k-200k, 3.4% for AGIs over 200k)
Taxes paid: $10,663 (reported on 40.9% of returns)
61107:
$10,663
State:
$11,968
(% of AGI for various income ranges: 4.4% for AGIs below $25k, 4.7% for AGIs $25k-50k, 6.3% for AGIs $50k-75k, 6.8% for AGIs $75k-100k, 7.7% for AGIs $100k-200k, 7.3% for AGIs over 200k)
Earned income credit: $2,189 (reported on 14.9% of returns)
Here:
$2,189
State:
$2,349
(% of AGI for various income ranges: 5.7% for AGIs below $25k, 0.9% for AGIs $25k-50k)
Percentage of individuals using paid preparers for their 2012 taxes: 53.9%
Here:
54%
State:
57%
(% for various income ranges: 48.1% for AGIs below $25k, 51.7% for AGIs $25k-50k, 55.1% for AGIs $50k-75k, 58.2% for AGIs $75k-100k, 61.7% for AGIs $100k-200k, 80.0% for AGIs over 200k)
Averages for the 2004 tax year for zip code 61107, filed in 2005:
Average Adjusted Gross Income (AGI) in 2004: $58,611 (Individual Income Tax Returns)
Here:
$58,611
State:
$54,625
Salary/wage: $47,208 (reported on 81.7% of returns)
Here:
$47,208
State:
$46,811
(% of AGI for various income ranges: 116.2% for AGIs below $10k, 69.4% for AGIs $10k-25k, 77.3% for AGIs $25k-50k, 77.4% for AGIs $50k-75k, 75.8% for AGIs $75k-100k, 54.3% for AGIs over 100k)
Taxable interest for individuals: $3,593 (reported on 51.7% of returns)
This zip code:
$3,593
Illinois:
$2,101
(% of AGI for various income ranges: 10.0% for AGIs below $10k, 4.2% for AGIs $10k-25k, 2.1% for AGIs $25k-50k, 1.8% for AGIs $50k-75k, 2.1% for AGIs $75k-100k, 4.0% for AGIs over 100k)
Taxable dividends: $4,779 (reported on 34.8% of returns)
Here:
$4,779
State:
$4,306
(% of AGI for various income ranges: 9.9% for AGIs below $10k, 3.1% for AGIs $10k-25k, 1.8% for AGIs $25k-50k, 1.7% for AGIs $50k-75k, 2.0% for AGIs $75k-100k, 3.6% for AGIs over 100k)
Net capital gain/loss: +$13,290 (reported on 28.7% of returns)
Here:
+$13,290
State:
+$17,321
(% of AGI for various income ranges: -0.5% for AGIs below $10k, 0.1% for AGIs $10k-25k, 0.5% for AGIs $25k-50k, 1.1% for AGIs $50k-75k, 1.2% for AGIs $75k-100k, 12.4% for AGIs over 100k)
Profit/loss from business: +$14,380 (reported on 15.7% of returns)
Here:
+$14,380
State:
+$11,771
(% of AGI for various income ranges: 3.5% for AGIs below $10k, 4.6% for AGIs $10k-25k, 2.3% for AGIs $25k-50k, 2.9% for AGIs $50k-75k, 3.1% for AGIs $75k-100k, 4.7% for AGIs over 100k)
IRA payment deduction: $3,093 (reported on 2.8% of returns)
61107:
$3,093
Illinois:
$3,087
(% of AGI for various income ranges: 0.3% for AGIs below $10k, 0.2% for AGIs $10k-25k, 0.3% for AGIs $25k-50k, 0.2% for AGIs $50k-75k, 0.2% for AGIs $75k-100k, 0.1% for AGIs over 100k)
Self-employed pension: $13,153 (reported on 1.2% of returns)
Here:
$13,153
Illinois:
$16,965
(% of AGI for various income ranges: 0.1% for AGIs $25k-50k, 0.1% for AGIs $50k-75k, 0.2% for AGIs $75k-100k, 0.4% for AGIs over 100k)
Total itemized deductions: $19,765 (20% of AGI, reported on 43.6% of returns)
Here:
$19,765
State:
$20,239
Here:
19.7% of AGI
State:
19.5% of AGI
(% of AGI for various income ranges: 23.8% for AGIs below $10k, 17.1% for AGIs $10k-25k, 14.9% for AGIs $25k-50k, 15.7% for AGIs $50k-75k, 15.7% for AGIs $75k-100k, 13.6% for AGIs over 100k)
Charity contributions deductions: $4,828 (5% of AGI, reported on 39.1% of returns)
Here:
$4,828
State:
$3,719
Here:
4.5% of AGI
State:
3.4% of AGI
(% of AGI for various income ranges: 1.6% for AGIs below $10k, 1.9% for AGIs $10k-25k, 2.1% for AGIs $25k-50k, 2.4% for AGIs $50k-75k, 2.8% for AGIs $75k-100k, 4.1% for AGIs over 100k)
Total tax: $10,484 (reported on 77.2% of returns)
61107:
$10,484
State:
$9,882
(% of AGI for various income ranges: 3.5% for AGIs below $10k, 4.0% for AGIs $10k-25k, 7.3% for AGIs $25k-50k, 9.5% for AGIs $50k-75k, 10.8% for AGIs $75k-100k, 19.4% for AGIs over 100k)
Earned income credit: $1,612 (reported on 10.5% of returns)
Here:
$1,612
State:
$1,788
Percentage of individuals using paid preparers for their 2004 taxes: 58.4%
Here:
58%
State:
61%
(% for various income ranges: 50.2% for AGIs below $10k, 58.5% for AGIs $10k-25k, 58.1% for AGIs $25k-50k, 60.2% for AGIs $50k-75k, 58.5% for AGIs $75k-100k, 69.3% for AGIs over 100k)
Likely homosexual households (counted as self-reported same-sex unmarried-partner households)
Lesbian couples: 0.0% of all households
Gay men: 0.1% of all households
Household received Food Stamps/SNAP in the past 12 months: 1,754 Household did not receive Food Stamps/SNAP in the past 12 months: 11,228
Women who had a birth in the past 12 months: 351 (241 now married, 109 unmarried) Women who did not have a birth in the past 12 months: 5,869 (2,453 now married, 3,411 unmarried)
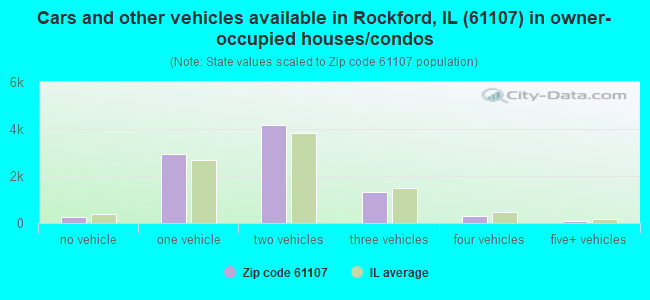
Housing units in zip code 61107 with a mortgage: 5,381 (297 second mortgage, 5 home equity loan, 270 both second mortgage and home equity loan) Houses without a mortgage: 397
Median monthly owner costs for units with a mortgage: $1,356 Median monthly owner costs for units without a mortgage: $704
Residents with income below the poverty level in 2022:
This zip code:
10.6%
Whole state:
11.9%
Residents with income below 50% of the poverty level in 2022:
This zip code:
5.7%
Whole state:
5.7%
Median number of rooms in houses and condos:
Here:
7.0
State:
6.4
Median number of rooms in apartments:
Here:
4.3
State:
4.1
Notable locations in this zip code not listed on our city pages
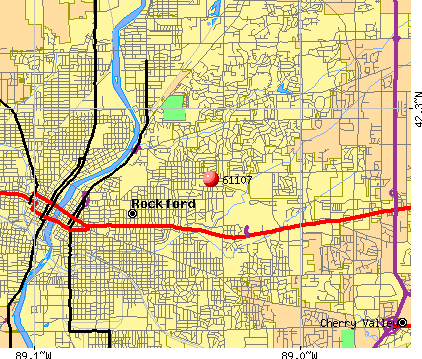
Notable locations in zip code 61107: Sinnissippi Golf Course (A), Mauh Nah Tee-See Country Club (B), OSF Lifeline Ambulance (C), Rockford Fire Department Station 5 (D), Clark Arts Center (E), Eugene and Applin Starr Science Building (F), Rockford Museum (G), Rockford Fire Department Station 10 and Ambulance Service (H). Display/hide their locations on the map
Churches in zip code 61107 include: Church of the Living God (A), First Church of Christ Scientist (B), First Evangelical Covenant Church (C), Forest City Vineyard Christian Fellowship Church (D), Gloria Dei Lutheran Church (E), Metro Christian Center (F), Mount Olive Lutheran Church (G), Our Saviors Lutheran Church (H), Saint Anskars Episcopal Church (I). Display/hide their locations on the map
Parks in zip code 61107 include: Reuben Aldeen Park (1), River Front Park (2), Sinnissippi Park (3), Highland Playground (4), Haight Park (5), Guilford County Forest Preserve (6), Beattie Park (7), Marsh Park (8), Guilford Center Park (9). Display/hide their locations on the map
3,884 married couples with children.
1,855 single-parent households (389 men, 1,466 women).
85.0% of residents of 61107 zip code speak English at home.
7.7% of residents speak Spanish at home (76% very well, 11% well, 8% not well, 6% not at all).
2.8% of residents speak other Indo-European language at home (63% very well, 34% well, 3% not well).
2.9% of residents speak Asian or Pacific Island language at home (61% very well, 22% well, 16% not well).
1.8% of residents speak other language at home (71% very well, 14% well, 16% not well).
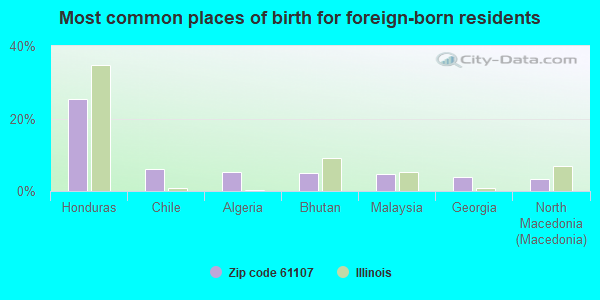
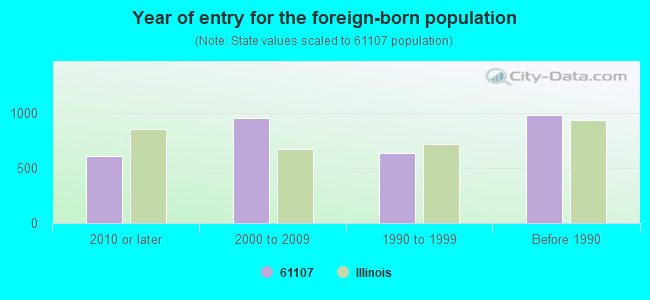
Foreign born population: 2,890 (10.0%) (60.5% of them are naturalized citizens)
Major facilities with environmental interests located in this zip code:
INGERSOLL MILLING MACHINE COMPANY (301 WATER SDTREET in ROCKFORD, IL)
AIR SYNTHETIC MINOR (AIRS/AFS) CRITERIA AND HAZARDOUS AIR POLLUTANT INVENTORY (Inventory of air pollution sources) National Pollutant Discharge Elimination System NON-MAJOR (Tracking pollutant discharge elimination systems) - permit HAZARDOUS WASTE BIENNIAL REPORTER (Resource Conservation and Recovery Act (tracking hazardous waste)) Large Quantity Generators, more that 1000 kg of hazardous waste/month (Resource Conservation and Recovery Act (tracking hazardous waste)) - notification TRI REPORTER (Tracking of toxic chemicals releasing facilities) Business SIC classification: MACHINE TOOLS, METAL CUTTING TYPES Business NAICS classification: MACHINE TOOL (METAL CUTTING TYPES) MANUFACTURING.; MACHINE TOOL (METAL CUTTING TYPES) MANUFACTURING.
ROCKFORD ARROW ANNODIZING (715 NORTH MADISON STREET in ROCKFORD, IL)
AIR MINOR (AIRS/AFS) National Pollutant Discharge Elimination System NON-MAJOR (Tracking pollutant discharge elimination systems) - permit HAZARDOUS WASTE BIENNIAL REPORTER (Resource Conservation and Recovery Act (tracking hazardous waste)) Small Quantity Generators, between 100 kg and 1000 kg of hazardous waste/month (Resource Conservation and Recovery Act (tracking hazardous waste)) - notification TRI REPORTER (Tracking of toxic chemicals releasing facilities) Business SIC and NAICS classification: ELECTROPLATING, PLATING, POLISHING, ANODIZING, AND COLORING Organizations: READETTE & DUNN PLATERS (CONTACT/OWNER)
, CHEM PROCESSING INC (CONTACT/OWNER)
Alternative names: CHEM PROCESSING, READETTE & DUNN PLATERS, ROCKFORD ARROW ANODIZING, READETTE & DUNN PLATERS
CHEMICAL PROCESSING INC (765 NORTH MADISON STREET in ROCKFORD, IL)
AIR SYNTHETIC MINOR (AIRS/AFS) National Pollutant Discharge Elimination System NON-MAJOR (Tracking pollutant discharge elimination systems) - permit HAZARDOUS WASTE BIENNIAL REPORTER (Resource Conservation and Recovery Act (tracking hazardous waste)) (Resource Conservation and Recovery Act (tracking hazardous waste)) TRI REPORTER (Tracking of toxic chemicals releasing facilities) Business SIC and NAICS classification: ELECTROPLATING, PLATING, POLISHING, ANODIZING, AND COLORING Organizations: CPI (CONTACT/OWNER)
, CHEM PROCESSING INC (CONTACT/OWNER)
KRAL LINCOLN MERCURY VOLVO (120 N 3RD ST in ROCKFORD, IL)
STATE MASTER (Illinois EPA Project) - SOLID WASTE PROGRAM, HAZARDOUS WASTE PROGRAM (Resource Conservation and Recovery Act (tracking hazardous waste)) Organizations: FUEHRER MARK (CONTACT/OWNER)
Alternative names: KRAL FRAN LINCOLN MERCURY VOLVO
ALPINE BONANZA-ROCKFORD OIL (204 N ALPINE RD in ROCKFORD, IL)
STATE MASTER (Illinois EPA Project) - SOLID WASTE PROGRAM (Resource Conservation and Recovery Act (tracking hazardous waste)) Organizations: ROCKFORD OIL CO (CONTACT/OWNER)
ILLINOIS TOLLWAY (RT 20 AND NW TOLLWAY in ROCKFORD, IL)
STATE MASTER (Illinois EPA Project) - AIR PROGRAM AIR MINOR (AIRS/AFS) CRITERIA AND HAZARDOUS AIR POLLUTANT INVENTORY (Inventory of air pollution sources) Business SIC classification: REGULATION AND ADMINISTRATION OF TRANSPORTATION PROGRAMS Alternative names: ILLINOIS STATE TOLL HIGHWAY AUTHORITY, ILLINOIS TOLLWAY - MAINTENANCE BLDG 7
NORTHERN ILLINOIS TILE (1125 N SECOND in ROCKFORD, IL)
STATE MASTER (Illinois EPA Project) - HAZARDOUS WASTE PROGRAM (Resource Conservation and Recovery Act (tracking hazardous waste)) Organizations: DAGNOLO LOU (CONTACT/OWNER)
ROCK RIVER FORD INC (224 N ALPINE RD in ROCKFORD, IL)
STATE MASTER (Illinois EPA Project) - SOLID WASTE PROGRAM, HAZARDOUS WASTE PROGRAM, SCRAP TIRE MANAGEMENT Small Quantity Generators, between 100 kg and 1000 kg of hazardous waste/month (Resource Conservation and Recovery Act (tracking hazardous waste)) - notification USED OIL PROGRAM (Resource Conservation and Recovery Act (tracking hazardous waste)) Organizations: CALCOTT JOHN R (CONTACT/OWNER)
HOLY FAMILY SCHOOL (1310 N ALPINE in ROCKFORD, IL)
STATE MASTER (Illinois EPA Project) - AIR PROGRAM AIR MINOR (AIRS/AFS) Business SIC classification: ELEMENTARY AND SECONDARY SCHOOLS
HUMPHREY CADILLAC & OLDS CO (223 N SECOND ST in ROCKFORD, IL)
STATE MASTER (Illinois EPA Project) - HAZARDOUS WASTE PROGRAM Small Quantity Generators, between 100 kg and 1000 kg of hazardous waste/month (Resource Conservation and Recovery Act (tracking hazardous waste)) - notification Organizations: JASON JOHN G (CONTACT/OWNER)
HUMPHREY CADILLAC & OLDS CO (716 MARKET in ROCKFORD, IL)
STATE MASTER (Illinois EPA Project) - HAZARDOUS WASTE PROGRAM Small Quantity Generators, between 100 kg and 1000 kg of hazardous waste/month (Resource Conservation and Recovery Act (tracking hazardous waste)) - notification Organizations: STORY INC (CONTACT/OWNER)
PINE TREE PISTOL CLUB (5454 ELEVENTH ST in ROCKFORD, IL)
STATE MASTER (Illinois EPA Project) - HAZARDOUS WASTE PROGRAM Large Quantity Generators, more that 1000 kg of hazardous waste/month (Resource Conservation and Recovery Act (tracking hazardous waste))
ROCKFORD SAND&GRAVEL-JOHNS 141 (SEC 2,T44N,R1E OF 3RD P.M. in ROCKFORD, IL)
STATE MASTER (Illinois EPA Project) - National Pollutant Discharge Elimination System Permit National Pollutant Discharge Elimination System NON-MAJOR (Tracking pollutant discharge elimination systems) - permit Business SIC classification: CRUSHED AND BROKEN LIMESTONE
Housing units lacking complete plumbing facilities: 0.8% Housing units lacking complete kitchen facilities: 1.5%
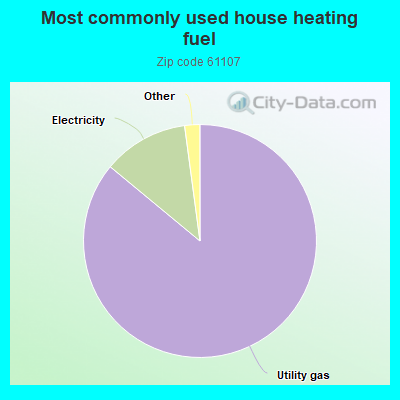
86.0%Utility gas
11.9%Electricity
0.9%Bottled, tank, or LP gas
0.5%No fuel used
Population in 1990: 28,879. Population change in the 1990s: +1,161 (+4.0%).
Place of birth for U.S.-born residents:
This state: 18,798
Northeast: 596
Midwest: 3,943
South: 1,422
West: 970
59% of the 61107 zip code residents lived in the same house 5 years ago. Out of people who lived in different houses, 66% lived in this county. Out of people who lived in different counties, 50% lived in Illinois.
88% of the 61107 zip code residents lived in the same house 1 year ago. Out of people who lived in different houses, 57% moved from this county. Out of people who lived in different houses, 24% moved from different county within same state. Out of people who lived in different houses, 17% moved from different state. Out of people who lived in different houses, 2% moved from abroad.
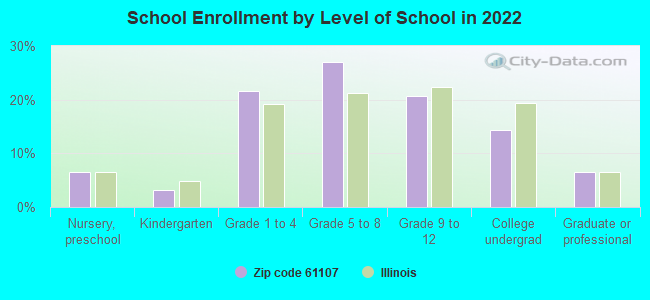
Private vs. public school enrollment:
Students in private schools in grades 1 to 8 (elementary and middle school): 624
Here:
20.2%
Illinois:
13.3%
Students in private schools in grades 9 to 12 (high school): 349
Here:
26.6%
Illinois:
9.9%
Students in private undergraduate colleges: 248
Here:
27.2%
Illinois:
27.4%
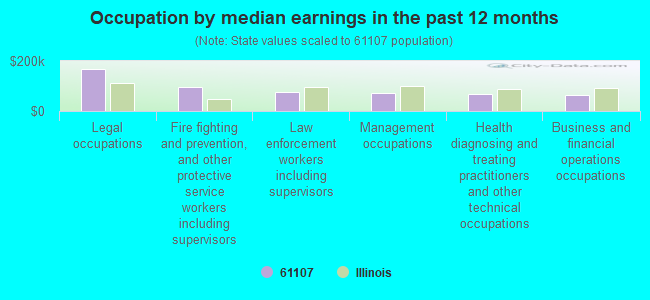
Occupation by median earnings in the past 12 months ($)
167,430Legal occupations
95,170Fire fighting and prevention, and other protective service workers including supervisors
76,151Law enforcement workers including supervisors
72,115Management occupations
67,143Health diagnosing and treating practitioners and other technical occupations
64,353Business and financial operations occupations
Companies with federal contracts located in this zip code:
SUMMIT TOOL DESIGN (205 N CALVIN PARK BLVD in ROCKFORD, IL; small business)
$21,220 with Army for ADP Software, Equipment, and Telecommunications Training. Signed on 2005-09-16. Completion date: 2005-10-20.
Top industries in this zip code by the number of employees in 2005:
Health Care and Social Assistance: Offices of Physicians (except Mental Health Specialists) (100-249 employees: 2 establishments, 50-99 employees: 3 establishments, 20-49 employees: 7 establishments, 10-19 employees: 12 establishments, 5-9 employees: 12 establishments, 1-4 employees: 18 establishments)
2002 - 2018 National Fire Incident Reporting System (NFIRS) incidents
Based on the data from the years 2002 - 2018 the average number of fire incidents per year is 63. The highest number of fires - 95 took place in 2003, and the least - 9 in 2004. The data has a growing trend.
When looking into fire subcategories, the most reports belonged to: Structure Fires (38.7%), and Outside Fires (31.2%).
Fire incident types reported to NFIRS in Zip Code 61107
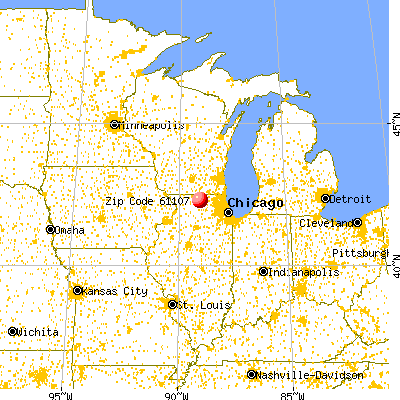


 Nearest zip codes: 61114, 61108, 61111, 61112, 61115, 61104.
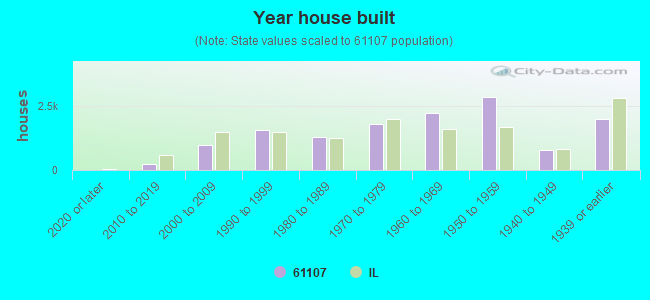


 Based on the data from the years 2002 - 2018 the average number of fire incidents per year is 63. The highest number of fires - 95 took place in 2003, and the least - 9 in 2004. The data has a growing trend.
 When looking into fire subcategories, the most reports belonged to: Structure Fires (38.7%), and Outside Fires (31.2%).