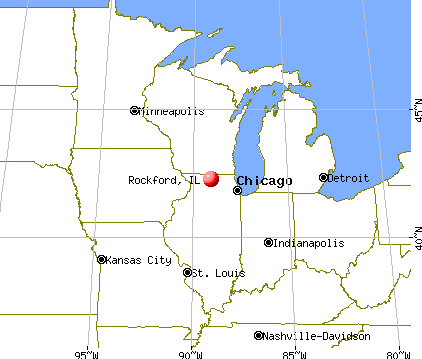
Rockford, Illinois
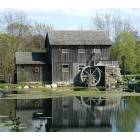
Rockford: Midway Village Millhouse - Rockford, IL.
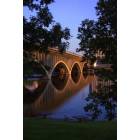
Rockford: Jefferson street bridge

Rockford: Whiteman street bridge
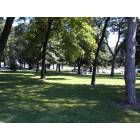
Rockford: Beattie Park

Rockford: Rock Valley College's Starlight Theatre
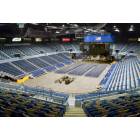
Rockford: metro center inside
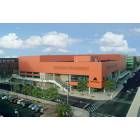
Rockford: metro center
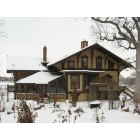
Rockford: Tinker Swiss Cottage in winter
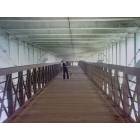
Rockford: Jefferson Bridge
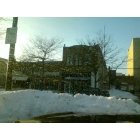
Rockford: Downtown rockford, N.Main St and Jefferson St
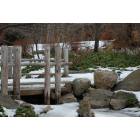
Rockford: Japanese Garden
- see
23
more - add
your
Submit your own pictures of this city and show them to the world
- OSM Map
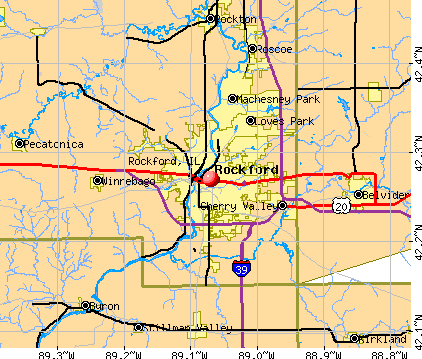
- General Map
- Google Map
- MSN Map
Population change since 2000: -2.3%
 |
| Males: 73,273 | |
| Females: 73,440 |
| Median resident age: | 37.1 years |
| Illinois median age: | 39.1 years |
Zip codes: 61088, 61101, 61102, 61104, 61107.
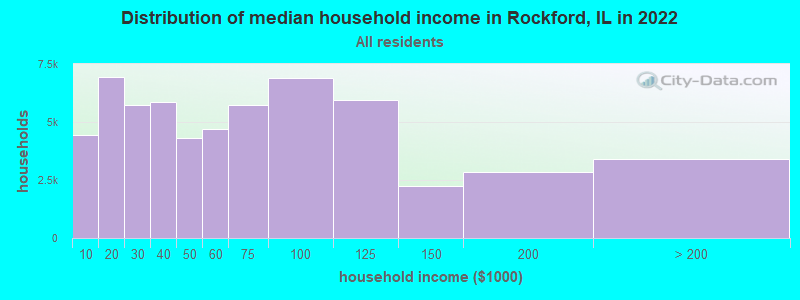
Rockford Zip Code Map| Rockford: | $53,994 |
| IL: | $76,708 |
Estimated per capita income in 2022: $30,462 (it was $19,781 in 2000)
Rockford city income, earnings, and wages data
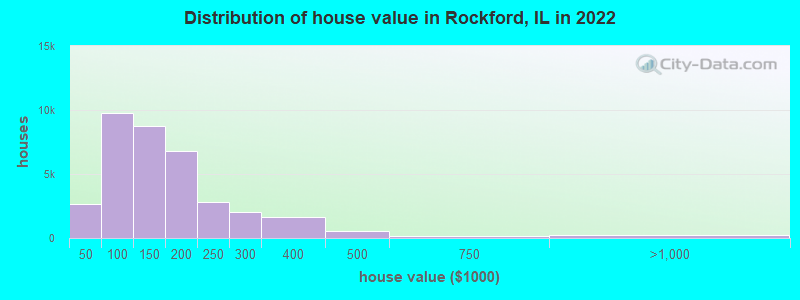
Estimated median house or condo value in 2022: $133,000 (it was $79,400 in 2000)
| Rockford: | $133,000 |
| IL: | $251,600 |
Mean prices in 2022: all housing units: $154,366; detached houses: $140,050; townhouses or other attached units: $427,021; in 2-unit structures: $117,833; in 3-to-4-unit structures: $84,323; in 5-or-more-unit structures: $116,816; mobile homes: $68,414
Median gross rent in 2022: $920.
(12.9% for White Non-Hispanic residents, 42.3% for Black residents, 17.4% for Hispanic or Latino residents, 2.2% for American Indian residents, 67.9% for Native Hawaiian and other Pacific Islander residents, 14.8% for other race residents, 28.4% for two or more races residents)
Detailed information about poverty and poor residents in Rockford, IL


Compare current foreclosures in Rockford, IL:
| Photo | Address | Area | Beds / Baths | Price | Details |
|---|---|---|---|---|---|

|
#1
Nadine Ave
Rockford, IL 61114
|
1,546 sq. feet
|
1 baths 3 beds |
$225,000
|
show details |

|
#2
Hanover Dr
Rockford, IL 61101
|
936 sq. feet
|
1 baths 3 beds |
$132,900
|
show details |

|
#3
6th Ave
Rockford, IL 61104
|
2,002 sq. feet
|
2 baths 4 beds |
$145,000
|
show details |

|
#4
N Central Ave
Rockford, IL 61101
|
1,971 sq. feet
|
3 baths 4 beds |
$134,900
|
show details |

|
#5
Trudy Rd
Rockford, IL 61108
|
1,546 sq. feet
|
1 baths 3 beds |
$225,000
|
show details |

|
#6
Sawyer Rd
Rockford, IL 61109
|
1,012 sq. feet
|
1 baths 2 beds |
show details | |

|
#7
Deanna Dr
Rockford, IL 61103
|
1,237 sq. feet
|
1 baths 3 beds |
show details | |

|
#8
17th Ave
Rockford, IL 61104
|
1,187 sq. feet
|
1 baths 2 beds |
show details | |

|
#9
Dawn Ave
Rockford, IL 61107
|
1,035 sq. feet
|
1 baths 2 beds |
show details | |

|
#10
-4115 Warren Dr
Rockford, IL 61108
|
- sq. feet
|
2 baths 4 beds |
show details |
| Photo | Address | Area | Beds / Baths | Price | Details |
|---|---|---|---|---|---|

|
#11
Elva Ln
Rockford, IL 61101
|
1,630 sq. feet
|
3 baths 2 beds |
show details | |

|
#12
Colorado Ave
Rockford, IL 61109
|
962 sq. feet
|
1 baths 3 beds |
show details | |

|
#13
N Sunset Ave
Rockford, IL 61101
|
816 sq. feet
|
1 baths 2 beds |
show details | |

|
#14
Wesleyan Ave
Rockford, IL 61108
|
1,346 sq. feet
|
2 baths 4 beds |
show details | |

|
#15
Stowmarket Ave
Rockford, IL 61109
|
1,352 sq. feet
|
1 baths 3 beds |
show details | |

|
#16
Price St
Rockford, IL 61103
|
1,392 sq. feet
|
1 baths 3 beds |
show details | |

|
#17
E State St
Rockford, IL 61104
|
- sq. feet
|
1 baths 3 beds |
show details | |

|
#18
Auburn St
Rockford, IL 61103
|
1,720 sq. feet
|
1 baths 3 beds |
show details | |

|
#19
Eggleston Rd
Rockford, IL 61108
|
- sq. feet
|
1 baths 2 beds |
show details | |

|
#20
Napoleon St
Rockford, IL 61103
|
1,200 sq. feet
|
1 baths 2 beds |
show details |
| Photo | Address | Area | Beds / Baths | Price | Details |
|---|---|---|---|---|---|

|
#21
Kennett Ave
Rockford, IL 61101
|
1,034 sq. feet
|
1 baths 3 beds |
show details | |

|
#22
Alpine Park Dr
Rockford, IL 61108
|
1,593 sq. feet
|
3 baths 4 beds |
show details | |

|
#23
Lincoln Ave
Rockford, IL 61102
|
784 sq. feet
|
1 baths 2 beds |
show details | |

|
#24
Soper Ave
Rockford, IL 61101
|
- sq. feet
|
1 baths 3 beds |
show details | |

|
#25
Amherst Ln
Rockford, IL 61109
|
- sq. feet
|
1 baths 3 beds |
show details | |

|
#26
Clifton Ave
Rockford, IL 61102
|
- sq. feet
|
- baths - beds |
$9,900
|
show details |

|
#27
Huffman Blvd
Rockford, IL 61103
|
- sq. feet
|
1 baths 3 beds |
show details | |

|
#28
Ridge Ave
Rockford, IL 61103
|
- sq. feet
|
1 baths 2 beds |
show details | |

|
#29
Parkside Ave
Rockford, IL 61101
|
- sq. feet
|
1 baths 4 beds |
show details | |

|
#30
Key Largo Ct
Rockford, IL 61103
|
- sq. feet
|
2 baths 3 beds |
show details |
| Photo | Address | Area | Beds / Baths | Price | Details |
|---|---|---|---|---|---|

|
#31
S Main St
Rockford, IL 61102
|
- sq. feet
|
- baths - beds |
show details | |

|
#32
Edgewood Hills Dr
Rockford, IL 61108
|
- sq. feet
|
- baths - beds |
show details | |

|
#33
21st Ave
Rockford, IL 61104
|
- sq. feet
|
- baths - beds |
show details | |

|
#34
13th St
Rockford, IL 61104
|
- sq. feet
|
- baths - beds |
show details | |

|
#35
10th St
Rockford, IL 61104
|
- sq. feet
|
- baths - beds |
show details | |

|
#36
21st Ave
Rockford, IL 61104
|
- sq. feet
|
- baths - beds |
show details | |

|
#37
S Bend Rd
Rockford, IL 61109
|
- sq. feet
|
- baths - beds |
show details | |

|
#38
8th Ave
Rockford, IL 61104
|
- sq. feet
|
- baths - beds |
show details | |

|
#39
Stewart Ave
Rockford, IL 61102
|
- sq. feet
|
- baths - beds |
show details | |

|
#40
Brooke Rd
Rockford, IL 61109
|
- sq. feet
|
- baths - beds |
show details |
| Photo | Address | Area | Beds / Baths | Price | Details |
|---|---|---|---|---|---|

|
#41
N Church St
Rockford, IL 61103
|
- sq. feet
|
- baths - beds |
show details | |

|
#42
19th Ave
Rockford, IL 61108
|
- sq. feet
|
- baths - beds |
show details | |

|
#43
7th Ave
Rockford, IL 61104
|
- sq. feet
|
- baths - beds |
show details | |

|
#44
29th St
Rockford, IL 61108
|
- sq. feet
|
- baths - beds |
show details | |

|
#45
Dallas Rd
Rockford, IL 61109
|
- sq. feet
|
- baths - beds |
show details | |

|
#46
N Main St Apt 210
Rockford, IL 61103
|
- sq. feet
|
- baths - beds |
show details | |

|
#47
Douglas St Apt 4
Rockford, IL 61103
|
- sq. feet
|
- baths - beds |
show details | |

|
#48
Colorado Ave
Rockford, IL 61108
|
- sq. feet
|
- baths - beds |
show details | |

|
#49
10th Ave
Rockford, IL 61104
|
- sq. feet
|
- baths - beds |
show details | |

|
Check over 1 million property listings on Foreclosure.com!
|
browse all offers | |||


- 74,91651.4%White alone
- 28,84719.8%Hispanic
- 28,08519.3%Black alone
- 8,3985.8%Two or more races
- 4,3173.0%Asian alone
- 7620.5%Other race alone
- 2420.2%American Indian alone
- 2680.2%Native Hawaiian and Other
Pacific Islander alone
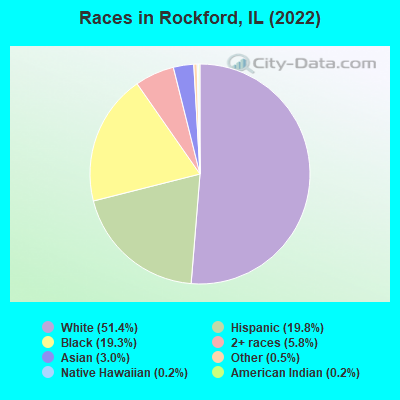
Races in Rockford detailed stats: ancestries, foreign born residents, place of birth
According to our research of Illinois and other state lists, there were 586 registered sex offenders living in Rockford, Illinois as of April 26, 2024.
The ratio of all residents to sex offenders in Rockford is 252 to 1.
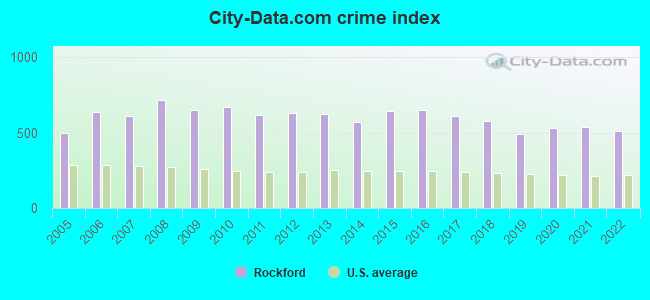
The City-Data.com crime index weighs serious crimes and violent crimes more heavily. Higher means more crime, U.S. average is 246.1. It adjusts for the number of visitors and daily workers commuting into cities.
- means the value is about the same as the state average.- means the value is bigger than the state average.
- means the value is much bigger than the state average.
Crime rate in Rockford detailed stats: murders, rapes, robberies, assaults, burglaries, thefts, arson
Full-time law enforcement employees in 2021, including police officers: 325 (282 officers - 245 male; 37 female).
| Officers per 1,000 residents here: | 1.96 |
| Illinois average: | 2.84 |
 Recent articles from our blog. Our writers, many of them Ph.D. graduates or candidates, create easy-to-read articles on a wide variety of topics.

 | Live in Chicagoland, Work in Rockford (26 replies) |
| Saint Charles to Rockford? (18 replies) |
| Took a day trip to Rockford (17 replies) |
| Best metro areas outside of Chicago? (Illinois)? *DEBATE* (32 replies) |
| Young Professional moving to Rockford Region (1 reply) |
| Moving to Rockford/Byron (12 replies) |
Latest news from Rockford, IL collected exclusively by city-data.com from local newspapers, TV, and radio stations
Ancestries: German (7.3%), Irish (4.3%), Italian (4.2%), American (3.5%), Swedish (3.4%), English (3.4%).
Current Local Time: CST time zone
Incorporated on 07/28/1880
Elevation: 740 feet
Land area: 56.0 square miles.
Population density: 2,620 people per square mile (average).
17,754 residents are foreign born (6.2% Latin America, 3.2% Asia, 1.2% Africa).
| This city: | 12.1% |
| Illinois: | 14.1% |
Median real estate property taxes paid for housing units with mortgages in 2022: $3,417 (2.5%)
Median real estate property taxes paid for housing units with no mortgage in 2022: $2,920 (2.4%)
Nearest city with pop. 200,000+: Madison, WI  (58.1 miles , pop. 208,054).
Nearest city with pop. 1,000,000+: Chicago, IL (77.3 miles , pop. 2,896,016).
Nearest cities:
), ), Latitude: 42.27 N, Longitude: 89.07 W
Daytime population change due to commuting: +19,585 (+13.4%)
Workers who live and work in this city: 41,512 (67.1%)
Area code: 815
Rockford, Illinois accommodation & food services, waste management - Economy and Business Data
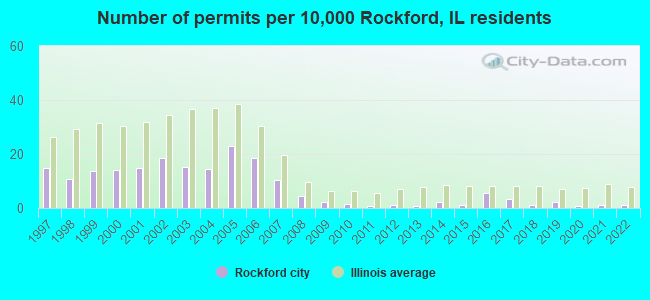
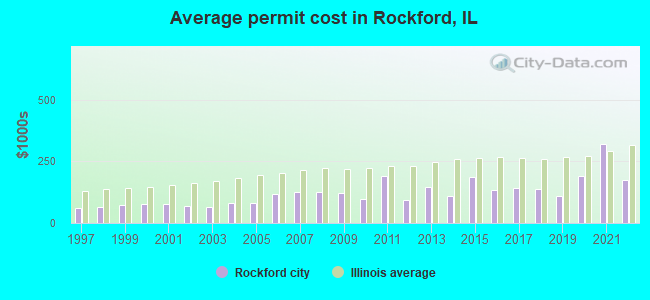
Single-family new house construction building permits:
- 2022: 17 buildings, average cost: $173,500
- 2021: 14 buildings, average cost: $319,600
- 2020: 12 buildings, average cost: $190,400
- 2019: 33 buildings, average cost: $109,600
- 2018: 16 buildings, average cost: $138,400
- 2017: 50 buildings, average cost: $143,400
- 2016: 86 buildings, average cost: $133,200
- 2015: 18 buildings, average cost: $188,400
- 2014: 33 buildings, average cost: $111,000
- 2013: 11 buildings, average cost: $144,100
- 2012: 18 buildings, average cost: $95,300
- 2011: 13 buildings, average cost: $188,700
- 2010: 24 buildings, average cost: $99,200
- 2009: 32 buildings, average cost: $122,100
- 2008: 64 buildings, average cost: $125,600
- 2007: 157 buildings, average cost: $127,000
- 2006: 276 buildings, average cost: $115,800
- 2005: 347 buildings, average cost: $80,700
- 2004: 219 buildings, average cost: $79,800
- 2003: 226 buildings, average cost: $65,400
- 2002: 280 buildings, average cost: $67,500
- 2001: 225 buildings, average cost: $79,400
- 2000: 212 buildings, average cost: $76,400
- 1999: 205 buildings, average cost: $71,200
- 1998: 160 buildings, average cost: $64,700
- 1997: 222 buildings, average cost: $59,500
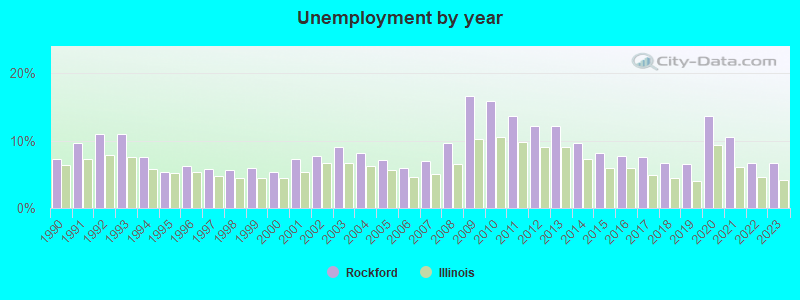
| Here: | 6.6% |
| Illinois: | 4.2% |
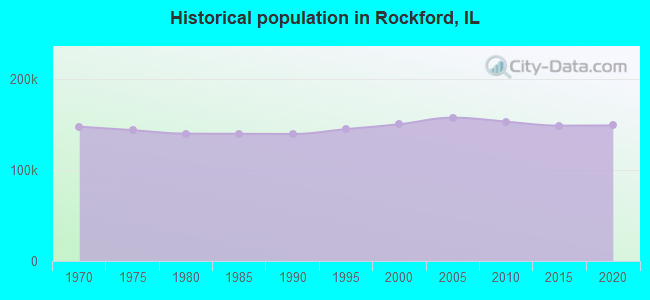

Population change in the 1990s: +5,851 (+4.1%).
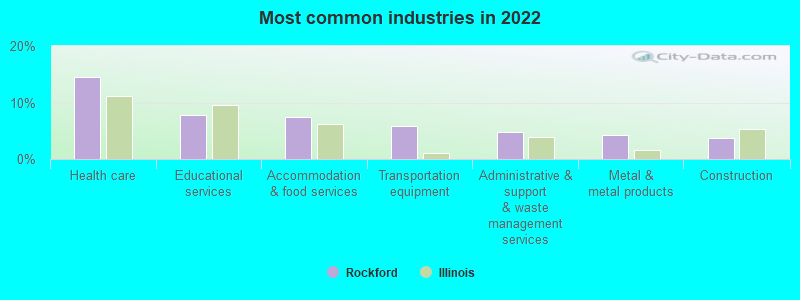
- Health care (14.6%)
- Educational services (7.8%)
- Accommodation & food services (7.5%)
- Transportation equipment (5.9%)
- Administrative & support & waste management services (4.8%)
- Metal & metal products (4.2%)
- Construction (3.7%)
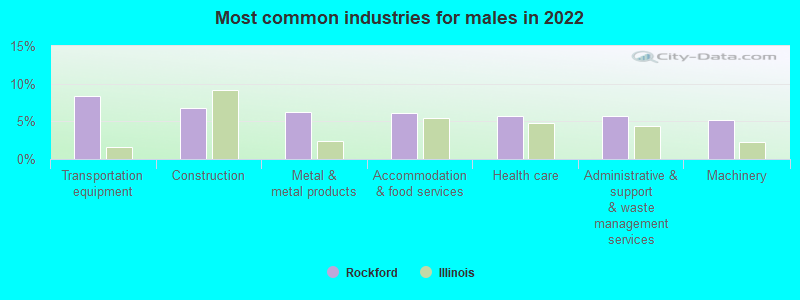
- Transportation equipment (8.4%)
- Construction (6.8%)
- Metal & metal products (6.2%)
- Accommodation & food services (6.1%)
- Health care (5.7%)
- Administrative & support & waste management services (5.7%)
- Machinery (5.2%)
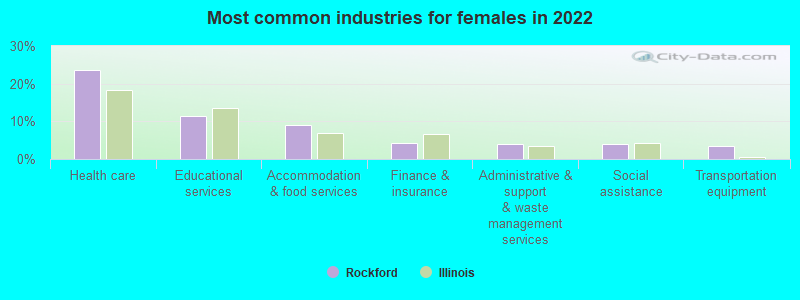
- Health care (23.5%)
- Educational services (11.5%)
- Accommodation & food services (8.9%)
- Finance & insurance (4.3%)
- Administrative & support & waste management services (4.0%)
- Social assistance (4.0%)
- Transportation equipment (3.4%)
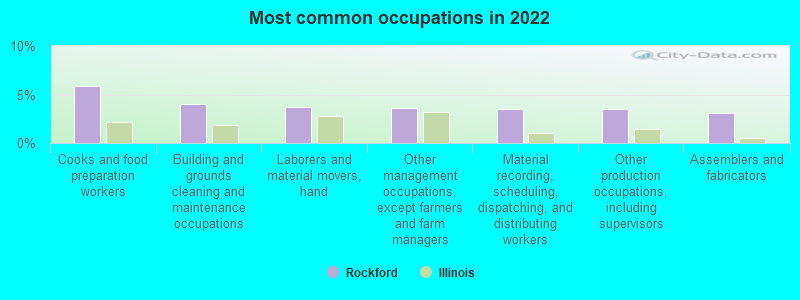
- Cooks and food preparation workers (5.9%)
- Building and grounds cleaning and maintenance occupations (4.0%)
- Laborers and material movers, hand (3.7%)
- Other management occupations, except farmers and farm managers (3.6%)
- Material recording, scheduling, dispatching, and distributing workers (3.5%)
- Other production occupations, including supervisors (3.5%)
- Assemblers and fabricators (3.1%)

- Laborers and material movers, hand (5.6%)
- Metal workers and plastic workers (5.2%)
- Cooks and food preparation workers (5.0%)
- Driver/sales workers and truck drivers (4.8%)
- Building and grounds cleaning and maintenance occupations (4.5%)
- Other production occupations, including supervisors (4.3%)
- Other management occupations, except farmers and farm managers (4.3%)
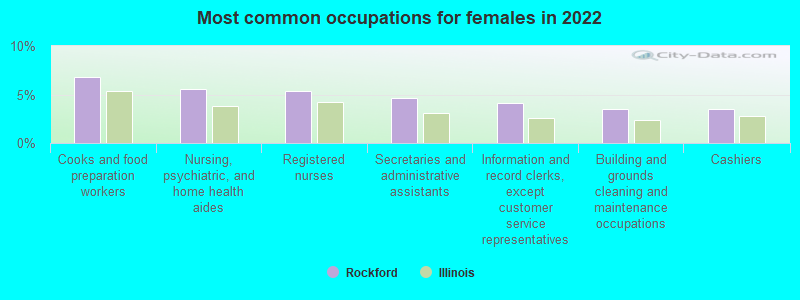
- Cooks and food preparation workers (6.8%)
- Nursing, psychiatric, and home health aides (5.5%)
- Registered nurses (5.4%)
- Secretaries and administrative assistants (4.6%)
- Information and record clerks, except customer service representatives (4.2%)
- Building and grounds cleaning and maintenance occupations (3.6%)
- Cashiers (3.5%)
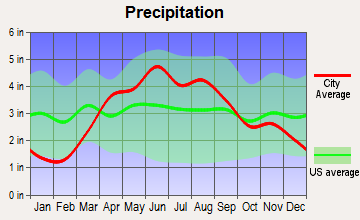
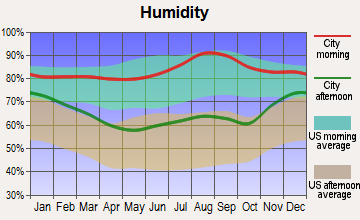
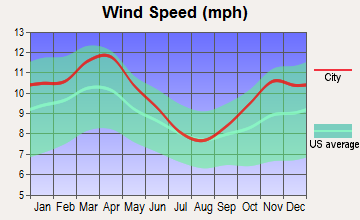
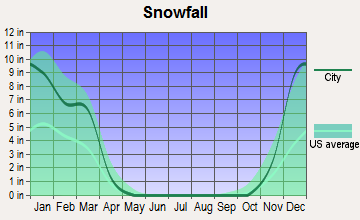
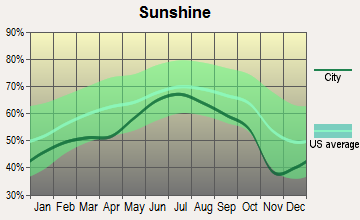
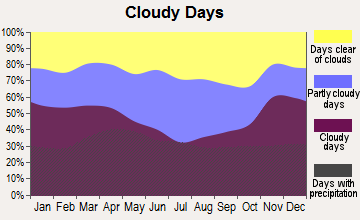
Average climate in Rockford, Illinois
Based on data reported by over 4,000 weather stations

|
|

(lower is better)
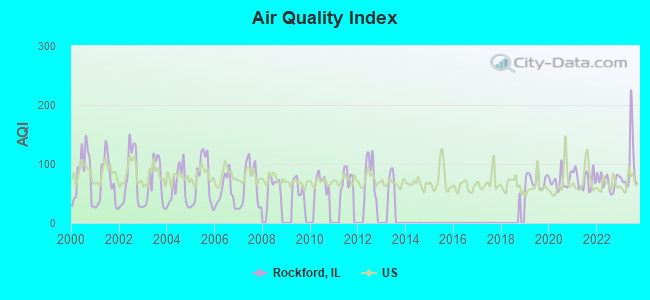
Air Quality Index (AQI) level in 2023 was 94.4. This is worse than average.
| City: | 94.4 |
| U.S.: | 72.6 |
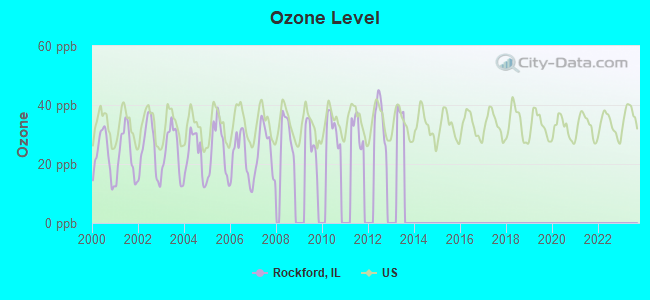
Ozone [ppb] level in 2012 was 35.8. This is about average. Closest monitor was 1.3 miles away from the city center.
| City: | 35.8 |
| U.S.: | 33.3 |
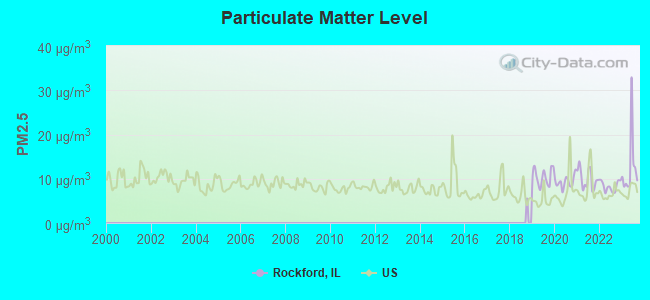
Particulate Matter (PM2.5) [µg/m3] level in 2023 was 12.5. This is significantly worse than average. Closest monitor was 1.0 miles away from the city center.
| City: | 12.5 |
| U.S.: | 8.1 |
Tornado activity:
Rockford-area historical tornado activity is slightly below Illinois state average. It is 49% greater than the overall U.S. average.
On 4/21/1967, a category F4 (max. wind speeds 207-260 mph) tornado 8.4 miles away from the Rockford city center killed 24 people and injured 450 people and caused between $50,000 and $500,000 in damages.
On 4/11/1965, a category F4 tornado 35.5 miles away from the city center killed 6 people and injured 75 people.
Earthquake activity:
Rockford-area historical earthquake activity is significantly above Illinois state average. It is 56% greater than the overall U.S. average.On 4/18/2008 at 09:36:59, a magnitude 5.4 (5.1 MB, 4.8 MS, 5.4 MW, 5.2 MW, Class: Moderate, Intensity: VI - VII) earthquake occurred 271.3 miles away from Rockford center
On 6/28/2004 at 06:10:52, a magnitude 4.2 (4.2 MW, Depth: 6.2 mi, Class: Light, Intensity: IV - V) earthquake occurred 56.7 miles away from the city center
On 6/10/1987 at 23:48:54, a magnitude 5.1 (4.9 MB, 4.4 MS, 4.6 MS, 5.1 LG) earthquake occurred 246.5 miles away from Rockford center
On 4/18/2008 at 09:36:59, a magnitude 5.2 (5.2 MW, Depth: 8.9 mi) earthquake occurred 271.4 miles away from the city center
On 2/10/2010 at 09:59:35, a magnitude 3.8 (3.8 MW, Depth: 6.2 mi, Class: Light, Intensity: II - III) earthquake occurred 36.0 miles away from the city center
On 6/18/2002 at 17:37:15, a magnitude 5.0 (4.3 MB, 4.6 MW, 5.0 LG) earthquake occurred 304.0 miles away from the city center
Magnitude types: regional Lg-wave magnitude (LG), body-wave magnitude (MB), surface-wave magnitude (MS), moment magnitude (MW)
Natural disasters:
The number of natural disasters in Winnebago County (16) is near the US average (15).Major Disasters (Presidential) Declared: 10
Emergencies Declared: 5
Causes of natural disasters: Floods: 8, Storms: 7, Snows: 2, Snowstorms: 2, Winter Storms: 2, Blizzard: 1, Hurricane: 1, Tornado: 1, Wind: 1, Other: 1 (Note: some incidents may be assigned to more than one category).
Main business address for: CLARCOR INC (MOTOR VEHICLE PARTS & ACCESSORIES), AMCORE FINANCIAL INC (NATIONAL COMMERCIAL BANKS), WOODWARD GOVERNOR CO (ELECTRICAL INDUSTRIAL APPARATUS).
Hospitals in Rockford:
- CANTERBURY PLACE (2503 CANTERBURY LANE)
- H DOUGLAS SINGER MENTAL HLTH CTR (4402 N MAIN ST)
- HEARTLAND HOSPICE SERVICES, INC (4960 E STATE ST)
- MILESTONE - ELMWOOD HEIGHTS (2662 ELMWOOD ROAD)
- NORTHERN ILLINOIS HOSPICE ASSO (4215 NEWBURG ROAD)
- ODYSSEY HEALTHCARE OF ROCKFORD (6801 SPRING CREEK ROAD, SUITE 2C)
- OSF HOSPICE (6122 MULFORD VILLAGE DRIVE)
- ROCKTON COURT (2615 NORTH ROCKTON AVENUE)
- SEARLES GROUP HOME (3310 SEARLES AVENUE)
- SWEDISH AMERICAN HOSPITAL (Voluntary non-profit - Other, 1401 EAST STATE STREET)
Airports and heliports located in Rockford:
- Chicago/Rockford International Airport (RFD) (Runways: 2, Commercial Ops: 8,003, Air Taxi Ops: 1,759, Itinerant Ops: 9,059, Local Ops: 14,466, Military Ops: 1,412)
- Cottonwood Airport (1C8) (Runways: 1, Itinerant Ops: 3,000, Local Ops: 6,000)
- Darrington Airport (LL80) (Runways: 1)
- Lz Fairwinds Airport (LL78) (Runways: 1)
- Severson Airport (LL79) (Runways: 1)
- Spickard-Marshall Airport (LL81) (Runways: 1)
- Ingersoll Heliport (1IS7)
- Rockford Memorial Hospital Heliport (LL83)
- St Anthony Medical Center Heliport (LL84)
- Swedish American Heliport (09IS)
Operable nuclear power plants near Rockford:
- 14 miles: Byron 1 and 2 in Byron, IL.
Colleges/Universities in Rockford:
- Rock Valley College (Full-time enrollment: 6,269; Location: 3301 N Mulford Rd; Public; Website: www.rockvalleycollege.edu)
- Rasmussen College-Illinois (Full-time enrollment: 1,556; Location: 6000 East State Street, 4th Floor; Private, for-profit; Website: rasmussen.edu)
- Rockford University (Full-time enrollment: 1,182; Location: 5050 E State St; Private, not-for-profit; Website: www.rockford.edu; Offers Master's degree)
- Madison Media Institute - Rockford Career College (Full-time enrollment: 546; Location: 1130 South Alpine Road; Private, for-profit; Website: www.rockfordcareercollege.edu)
- Saint Anthony College of Nursing (Full-time enrollment: 228; Location: 5658 E State St; Private, not-for-profit; Website: sacn.edu; Offers Master's degree)
- Tricoci University of Beauty Culture-Rockford (Full-time enrollment: 169; Location: 5485 E State St; Private, for-profit; Website: www.tricociuniversity.com)
- Regency Beauty Institute-Rockford (Full-time enrollment: 127; Location: 657 Highgrove Place; Private, for-profit; Website: www.regency.edu)
- Educators of Beauty College of Cosmetology-Rockford (Full-time enrollment: 69; Location: 2601 N. Mulford; Private, for-profit; Website: www.educatorsofbeauty.com)
Other colleges/universities with over 2000 students near Rockford:
- Kishwaukee College (about 25 miles; Malta, IL; Full-time enrollment: 3,356)
- Northern Illinois University (about 28 miles; Dekalb, IL; FT enrollment: 18,126)
- McHenry County College (about 37 miles; Crystal Lake, IL; FT enrollment: 4,886)
- Elgin Community College (about 43 miles; Elgin, IL; FT enrollment: 8,173)
- University of Wisconsin-Whitewater (about 43 miles; Whitewater, WI; FT enrollment: 11,124)
- Waubonsee Community College (about 46 miles; Sugar Grove, IL; FT enrollment: 7,698)
- Aurora University (about 52 miles; Aurora, IL; FT enrollment: 4,596)
Public high schools in Rockford:
- JEFFERSON HIGH SCHOOL (Students: 2,085, Location: 4145 SAMUELSON RD, Grades: 9-12)
- GUILFORD HIGH SCHOOL (Students: 1,997, Location: 5620 SPRING CREEK RD, Grades: 9-12)
- AUBURN HIGH SCHOOL (Students: 1,922, Location: 5110 AUBURN ST, Grades: 9-12)
- ROOSEVELT CENTER (Students: 441, Location: 978 HASKELL AVE, Grades: PK-12)
- REGIONAL ALTERNATIVE SCHOOL (Students: 17, Location: 5949 SAFFORD RD, Grades: 9-12)
- REG'L LEARNING CENTER STAR WINN (Location: 5949 SAFFORD RD, Grades: 9-12)
- REG'L LEARNING ACADEMY STAR WINN (Location: 5949 SAFFORD RD, Grades: 6-11)
- ROCKFORD EAST HIGH SCHOOL (Location: 2929 CHARLES ST, Grades: 9-12)
- LEGACY ACAD OF EXCELLENCE CHARTER SCH (Location: 4029 PRAIRIE RD, Grades: KG-10, Charter school)
Biggest private high schools in Rockford:
- ROCKFORD CHRISTIAN SCHOOLS (Students: 1,235, Location: 1401 N BELL SCHOOL RD, Grades: PK-12)
- BOYLAN CATHOLIC HIGH SCHOOL (Students: 1,152, Location: 4000 SAINT FRANCIS DR, Grades: 9-12)
- CHRISTIAN LIFE SCHOOLS (Students: 689, Location: 5950 SPRINGCREEK RD, Grades: PK-12)
- ROCKFORD LUTHERAN SCHOOL - JR/SR HIGH SCHOOL (Students: 596, Location: 3411 N ALPINE RD, Grades: 6-12)
- KEITH COUNTRY DAY SCHOOL (Students: 291, Location: 1 JACOBY PL, Grades: PK-12)
- BEREAN BAPTIST CHRISTIAN SCHOOL (Students: 246, Location: 5626 SAFFORD RD, Grades: PK-12)
- ROCKFORD IQRA' SCHOOL (Students: 111, Location: 5925 DARLENE DR, Grades: PK-12)
- ROCK RIVER ACADEMY (Students: 75, Location: 3445 ELMWOOD RD, Grades: 5-12)
- OUR LADY SACRED HEART ACADEMY (Students: 30, Location: 3218 11TH ST, Grades: KG-12)
- LYDIA URBAN ACADEMY-ROCKFORD (Students: 12, Location: 2323 S 6TH ST, Grades: 9-12)
Biggest public elementary/middle schools in Rockford:
- ROCKFORD ENVRNMNTL SCIENCE ACAD (Students: 1,229, Location: 1800 OGILBY RD, Grades: 6-8)
- WEST MIDDLE SCHOOL (Students: 995, Location: 1900 N ROCKTON AVE, Grades: 6-8)
- BERNARD W FLINN MIDDLE SCHOOL (Students: 918, Location: 2525 OHIO PKWY, Grades: 6-8)
- EISENHOWER MIDDLE SCHOOL (Students: 916, Location: 3525 SPRING CREEK RD, Grades: 6-8)
- ABRAHAM LINCOLN MIDDLE SCHOOL (Students: 894, Location: 1500 CHARLES ST, Grades: 6-8)
- KENNEDY MIDDLE SCHOOL (Students: 836, Location: 520 N PIERPONT AVE, Grades: 6-8)
- BARBOUR TWO-WAY LANG IMMERSION (Students: 581, Location: 1506 CLOVER AVE, Grades: KG-8)
- RIVERDAHL ELEM SCHOOL (Students: 575, Location: 3520 KISHWAUKEE ST, Grades: PK-2)
- ROLLING GREEN (Students: 572, Location: 3615 W GATE PKWY, Grades: PK-5)
- ELLIS ARTS ACADEMY (Students: 572, Location: 222 S CENTRAL AVE, Grades: KG-8)
Biggest private elementary/middle schools in Rockford:
- HOLY FAMILY CATHOLIC SCHOOL (Students: 504, Location: 4407 HIGHCREST RD, Grades: PK-8)
- ROCKFORD LUTHERAN ACADEMY (Students: 266, Location: 4700 AUGUSTANA DR, Grades: PK-5)
- ST RITA SCHOOL (Students: 251, Location: 6284 VALLEY KNOLL DR, Grades: PK-8)
- ST JAMES CATHOLIC SCHOOL (Students: 230, Location: 409 N 1ST ST, Grades: PK-8)
- ST EDWARD SCHOOL (Students: 226, Location: 3020 11TH ST, Grades: UG-8)
- ST PETER CATHEDRAL (Students: 207, Location: 1231 N COURT ST, Grades: PK-8)
- ST BERNADETTE CATHOLIC SCHOOL (Students: 200, Location: 2300 BELL AVE, Grades: PK-8)
- CATHEDRAL BAPTIST SCHOOL (Students: 174, Location: 5622 35TH ST, Grades: PK-8)
- MONTESSORI PRIVATE ACADEMY (Students: 130, Location: 8101 SAYER RD, Grades: PK-8)
- ALPINE ACADEMY (Students: 112, Location: 5001 FOREST VIEW AVE, Grades: PK-6)
User-submitted facts and corrections:
- Our Motto is We Serve. Founded in 1920 We are the oldest Lions club in District 1-D. We Built the sinnissippi Band Shelter, The original Center for Sight & Hearing and Lions Park (Handicap accessible) at Rock Cut State Park. Our two primary service projects are students with vision and or hearing loss in the Rockford Schools and the Center for Sight & Hearing, We also support the Salvation Army through Bell ringing, Lions of Illinois Foundation, Give Scholarships to Rock Valley college, Rockford college and Rockford Business School to help student with vision or hearing loss. We meet at noon the first & third Wednesdays at the Salvation Army Millennium Center 200 S Madison St
- The University of Illinois College of Medicine at Rockford should be on your list of Universities/Colleges.
- Private High School : Rockford Christian High School 1401 N. Bell School Road Rockford, IL 61107 (815) 399-3465 550 high students as of 8/05
Points of interest:
Notable locations in Rockford: East Rock Industrial Park (A), Rockford News Tower (B), Rockford Sanitary District Disposal Plant (C), Sinnissippi Golf Course (D), Rockford Pistol Range (E), Mauh Nah Tee-See Country Club (F), Sandy Hollow Golf Course (G), Chicago, Milwaukee and Saint Paul Railroad Depot (H), Rockford Country Club (I), Alpine Business Park (J), Rockford Public Library (K), Luther Center (L), Talcott Building (M), Rock River Tower (N), Rockford Trust Building (O), OSF Lifeline Ambulance (P), Regional Emergency Acute Care Transport (Q), ATS Medical Service (R), Van Matre HealthSouth Rehabilitation Hospital (S), Rockford Fire Department Station 5 (T). Display/hide their locations on the map
Shopping Centers: Lincolnwood Shopping Center (1), Marchesano Shopping Center (2), Alpine Village Shopping Center (3), Edgebrook Shopping Center (4), Eleventh Street Plaza Shopping Center (5), Fairview Shopping Center (6), Colonial Village Shopping Center (7), Forest Plaza Shopping Center (8), High Crest Shopping Center (9). Display/hide their locations on the map
Main business address in Rockford include: CLARCOR INC (A), AMCORE FINANCIAL INC (B). Display/hide their locations on the map
Churches in Rockford include: Aldersgate United Methodist Church (A), Bethlehem Lutheran Church (B), Calvary Church (C), Calvary Church of Christ (D), Broadway United Methodist Church (E), Church of Christ (F), Deliverance Church of Rockford (G), First Evangelical Free Church (H), New Life Center (I). Display/hide their locations on the map
Cemeteries: Arlington Memorial Park Cemetery (1), Mount Auburn Cemetery (2), Cedar Bluff Cemetery (3), Marsh Cemetery (4), Saint James and Saint Marys Cemetery (5), Scandinavian Cemetery (6), Guilford Union Cemetery (7). Display/hide their locations on the map
Reservoirs: Reuben Aldeen Park Lake (A), Rock River (B), Spring Lake (C), Levings Lake (D). Display/hide their locations on the map
Creeks: Kent Creek (A), Keith Creek (B), Spring Creek (C). Display/hide their locations on the map
Parks in Rockford include: Haight Village Historic District (1), Quarry Hill Park (2), Reuben Aldeen Park (3), Ridge Avenue Park (4), River Front Park (5), Searls Park Prairie Nature Preserve (6), Searls Memorial Park (7), Alpine Park (8), Andrews Park (9). Display/hide their locations on the map
Tourist attractions: Burpee Museum of Natural History (737 North Main Street) (1), Ethnic Heritage Museum (313 Loomis Street) (2), Command Post Restaurant (Museums; 1004 Samuelson Road) (3), Northern Illinois Botanical Society (Botanical Gardens; 2701 Clifton Avenue) (4), Klehn Arboretum & Bontanic Gardclarcor Pavillion (Botanical Gardens; 1403 Iris Avenue) (5), Graham Ginestra House (Cultural Attractions- Events- & Facilities; 1115 South Main Street) (6), Anderson Gardens (Cultural Attractions- Events- & Facilities; 2110 Stoneridge Close) (7), Apollo Amusements Inc (Amusement & Theme Parks; 2934 11th Street) (8), Game Play Amusements (Amusement & Theme Parks; 1310 7th Avenue) (9). Display/hide their approximate locations on the map
Hotels: Extended Stay America - Rockford East (653 Clark Rd) (1), Courtyard Rockford (7676 E State St) (2), Hampton Inn Rockford (615 Clark Drive) (3), Holiday Inn (7750 East State Street) (4), Best Western Colonial Inn (4850 East State Street) (5), EXEL Inn of Rockford (220 South Lyford Road) (6), Cliffbreakers (700 West Riverside Boulevard) (7), Candlewood Suites (7555 Walton Street) (8), Baymont Inn Rockford (662 North Lyford Road) (9). Display/hide their approximate locations on the map
Courts: Winnebago County Court House - Circuit Court Clerks- Family Division (400 West State Street Suite 619) (1), Winnebago County Court House - Circuit Court Clerks- Criminal Division (400 West State Street Suite 619) (2), Winnebago County Court House - C A S A (403 Elm Street) (3), Winnebago County Court House - Building Department (400 West State Street Suite 619) (4), Winnebago County Court House - Supervisor Of Assessments (400 West State Street Suite 619) (5), Winnebago County Court House - Board Of Review (400 West State Street Suite 619) (6), Winnebago County Court House - Auditor- Audit Division (400 West State Street Suite 619) (7), Winnebago County Court House - Treasurer (400 West State Street Suite 619) (8), Winnebago County Court House - Veteran's Assistance (400 West State Street Suite 619) (9). Display/hide their approximate locations on the map
Birthplace of: Robert C. Richardson III - General, Stewart Brand - Environmentalist, Paris Bennett - Singer, Michelle Williams (singer) - Singer, Ginger Lynn - aka Ginger Lynn Allen, (born 1962), adult film actress, Chad Knaus - NASCAR crew chief, James Cartwright - Marine Corps general, James Henry Breasted - Archaeologist, Dwight Johns - Army general in World War II, Margaret Cross Norton - First Illinois State Archivist.
Drinking water stations with addresses in Rockford and their reported violations in the past:
ROAD RANGER TRAVEL CENTER (Serves WI, Population served: 1,267, Groundwater):Past health violations:WHITE PINES FOREST STATE PARK (97287) (Population served: 750, Groundwater):Past monitoring violations:
- MCL, Monthly (TCR) - In AUG-2010, Contaminant: Coliform. Follow-up actions: St Public Notif received (AUG-12-2010), St Violation/Reminder Notice (AUG-12-2010), St Boil Water Order (AUG-12-2010), St Public Notif requested (AUG-12-2010), St Compliance achieved (AUG-23-2010)
- 2 minor monitoring violations
Past health violations:SPRINGBROOK SWIM CLUB (Population served: 396, Groundwater):
- MCL, Monthly (TCR) - Between JAN-2009 and DEC-2009, Contaminant: Coliform. Follow-up actions: St Public Notif requested (JUL-21-2009), St Compliance achieved (SEP-30-2009)
Past monitoring violations:ROCKFORD SPEEDWAY RACETRACK (Population served: 300, Groundwater):
- One regular monitoring violation
Past monitoring violations:PEARL LAKE BEACH & CAMPGROUND (98020) (Population served: 300, Groundwater):
- One regular monitoring violation
Past health violations:ROCKFORD SPEEDWAY CONVENTION C (Population served: 250, Groundwater):
- MCL, Single Sample - Between JAN-2009 and DEC-2009, Contaminant: Nitrate. Follow-up actions: St Violation/Reminder Notice (JUN-07-2010), St Compliance achieved (DEC-30-2010)
Past monitoring violations:STRONGHOLD (95620) (Population served: 200, Groundwater):
- One regular monitoring violation
Past monitoring violations:BRADLEY HEIGHTS SUBDIVISION (Population served: 192, Groundwater):
- 2 regular monitoring violations
Past health violations:Past monitoring violations:
- MCL, Monthly (TCR) - In JUN-2012, Contaminant: Coliform. Follow-up actions: St Public Notif requested (JUL-13-2012), St Violation/Reminder Notice (JUL-13-2012), St Compliance achieved (JUL-19-2012), St Public Notif received (JUL-23-2012)
- Lead Consumer Notice - In JAN-02-2010, Contaminant: Lead and Copper Rule. Follow-up actions: St Violation/Reminder Notice (JAN-12-2010), St Compliance achieved (FEB-01-2010)
Drinking water stations with addresses in Rockford that have no violations reported:
- WHITE PINES FOREST STATE PARK (93617) (Population served: 750, Primary Water Source Type: Groundwater)
- WHITE PINES FOREST STATE PARK (97311) (Population served: 750, Primary Water Source Type: Groundwater)
- I-39 SHELL EXPRESS (Population served: 500, Primary Water Source Type: Groundwater)
- PEARL LAKE BEACH & CAMPGROUND (16766) (Population served: 300, Primary Water Source Type: Groundwater)
- MAUH-NAH-TEE-SEE C C (Population served: 277, Primary Water Source Type: Groundwater)
- FREEPORT P D OAKDALE NATURE PRESERVE (Population served: 250, Primary Water Source Type: Groundwater)
- LOWDEN STATE PARK (94003) (Population served: 200, Primary Water Source Type: Groundwater)
- BILL-MAR HEIGHTS MHP (Population served: 160, Primary Water Source Type: Groundwater)
- ROAD RANGER LLC OTTAWA (Population served: 150, Primary Water Source Type: Groundwater)
- UNIVERSITY PRIMARY CARE/ROCKTON (Population served: 125, Primary Water Source Type: Groundwater)
| This city: | 2.5 people |
| Illinois: | 2.6 people |
| This city: | 61.8% |
| Whole state: | 65.8% |
| This city: | 8.2% |
| Whole state: | 6.3% |
Likely homosexual households (counted as self-reported same-sex unmarried-partner households)
- Lesbian couples: 0.3% of all households
- Gay men: 0.3% of all households
People in group quarters in Rockford in 2010:
- 1,728 people in nursing facilities/skilled-nursing facilities
- 963 people in local jails and other municipal confinement facilities
- 379 people in other noninstitutional facilities
- 253 people in group homes intended for adults
- 246 people in college/university student housing
- 229 people in emergency and transitional shelters (with sleeping facilities) for people experiencing homelessness
- 189 people in residential treatment centers for adults
- 74 people in mental (psychiatric) hospitals and psychiatric units in other hospitals
- 57 people in correctional facilities intended for juveniles
- 47 people in group homes for juveniles (non-correctional)
- 12 people in residential treatment centers for juveniles (non-correctional)
- 2 people in workers' group living quarters and job corps centers
People in group quarters in Rockford in 2000:
- 1,875 people in nursing homes
- 655 people in local jails and other confinement facilities (including police lockups)
- 407 people in other noninstitutional group quarters
- 398 people in homes for the mentally retarded
- 341 people in college dormitories (includes college quarters off campus)
- 98 people in other nonhousehold living situations
- 93 people in halfway houses
- 90 people in hospitals or wards for drug/alcohol abuse
- 88 people in mental (psychiatric) hospitals or wards
- 75 people in homes for the mentally ill
- 60 people in residential treatment centers for emotionally disturbed children
- 60 people in short-term care, detention or diagnostic centers for delinquent children
- 27 people in religious group quarters
- 24 people in schools, hospitals, or wards for the intellectually disabled
- 24 people in other group homes
- 11 people in homes or halfway houses for drug/alcohol abuse
Banks with most branches in Rockford (2011 data):
- BMO Harris Bank National Association: 11 branches. Info updated 2011/07/14: Bank assets: $97,264.0 mil, Deposits: $75,624.6 mil, headquarters in Chicago, IL, positive income, 717 total offices, Holding Company: Bank Of Montreal
- Alpine Bank & Trust Co.: 8 branches. Info updated 2009/07/22: Bank assets: $1,039.0 mil, Deposits: $928.9 mil, local headquarters, positive income, Commercial Lending Specialization, 19 total offices, Holding Company: Alpine Bancorporation, Inc.
- Associated Bank, National Association: Rockford Downtown Branch, Rockford - Edgebrook Branch, Rockford 11th St Highlander Branch, Rockford - Rockton Branch, Rockford - Five Points Branch, Rockford Perryville Branch. Info updated 2008/09/12: Bank assets: $21,715.0 mil, Deposits: $15,244.4 mil, headquarters in Green Bay, WI, positive income, Commercial Lending Specialization, 282 total offices, Holding Company: Associated Banc-Corp
- PNC Bank, National Association: Rockford Downtown Branch, Rockford Southgate Branch, Rockford East State Branch, Riverside Banking Center Branch, Eastrock Facility, Court & Jefferson Branch. Info updated 2012/03/20: Bank assets: $263,309.6 mil, Deposits: $197,343.0 mil, headquarters in Wilmington, DE, positive income, Commercial Lending Specialization, 3085 total offices, Holding Company: Pnc Financial Services Group, Inc., The
- JPMorgan Chase Bank, National Association: Rockford North Main Branch, Rockford Downtown Branch, Jefferson Drive-Up Branch, Mulford Branch, Harrison Branch. Info updated 2011/11/10: Bank assets: $1,811,678.0 mil, Deposits: $1,190,738.0 mil, headquarters in Columbus, OH, positive income, International Specialization, 5577 total offices, Holding Company: Jpmorgan Chase & Co.
- U.S. Bank National Association: Eleventh Street Branch, Perryville Branch, East State Branch, Church Street Branch, Harrison Avenue Branch. Info updated 2012/01/30: Bank assets: $330,470.8 mil, Deposits: $236,091.5 mil, headquarters in Cincinnati, OH, positive income, 3121 total offices, Holding Company: U.S. Bancorp
- Riverside Community Bank: East State Street Branch, Harrison Avenue Branch, at 6855 East Riverside Boulevard. Info updated 2009/03/04: Bank assets: $318.9 mil, Deposits: $264.7 mil, local headquarters, positive income, Commercial Lending Specialization, 4 total offices, Holding Company: Heartland Financial Usa, Inc.
- Fifth Third Bank: Rockford Branch, Rockford Alpine Branch, Rockford Riverside Banking Center Br. Info updated 2009/10/05: Bank assets: $114,540.4 mil, Deposits: $89,689.1 mil, headquarters in Cincinnati, OH, positive income, Commercial Lending Specialization, 1378 total offices, Holding Company: Fifth Third Bancorp
- Northwest Bank of Rockford: Northwest Bank Of Rockford at 3106 North Rockton Avenue, branch established on 1972/04/21; Springstead Facility at 125 Phelps Avenue, branch established on 1982/10/22. Info updated 2006/11/03: Bank assets: $245.9 mil, Deposits: $211.7 mil, local headquarters, positive income, Commercial Lending Specialization, 4 total offices, Holding Company: Foresight Financial Group, Inc.
- 9 other banks with 11 local branches
For population 15 years and over in Rockford:
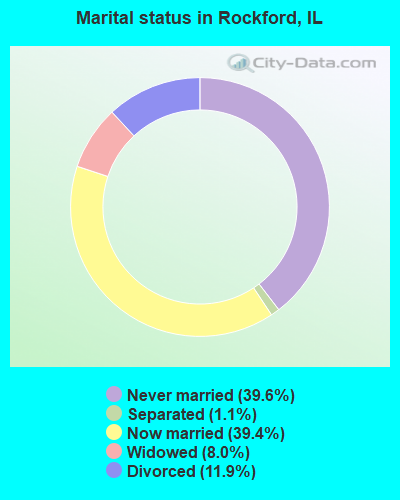
- Never married: 39.6%
- Now married: 39.4%
- Separated: 1.1%
- Widowed: 8.0%
- Divorced: 11.9%
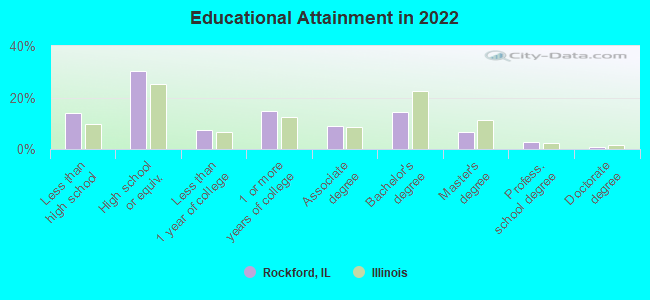
For population 25 years and over in Rockford:
- High school or higher: 85.9%
- Bachelor's degree or higher: 24.3%
- Graduate or professional degree: 10.1%
- Unemployed: 7.3%
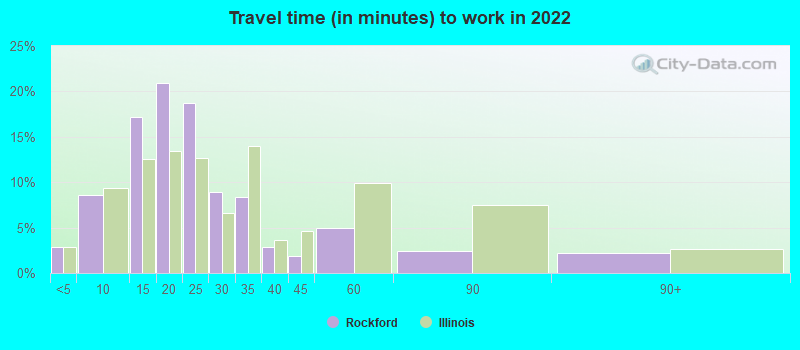
- Mean travel time to work (commute): 18.3 minutes
| Here: | 12.0 |
| Illinois average: | 12.5 |

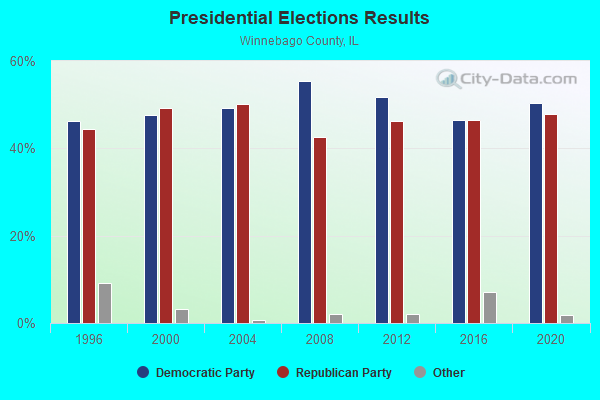
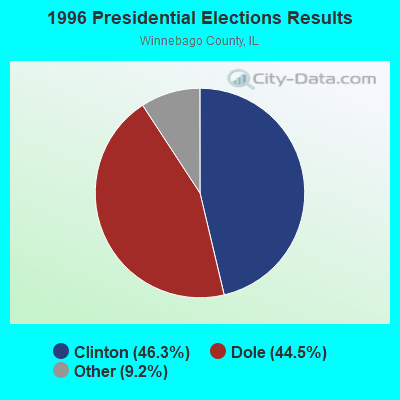
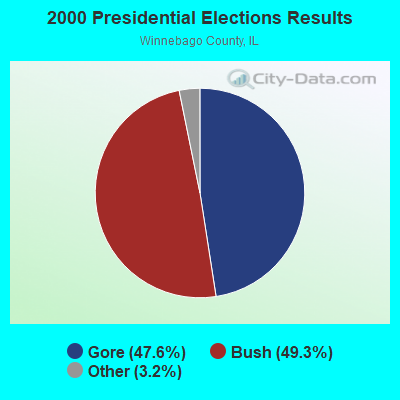

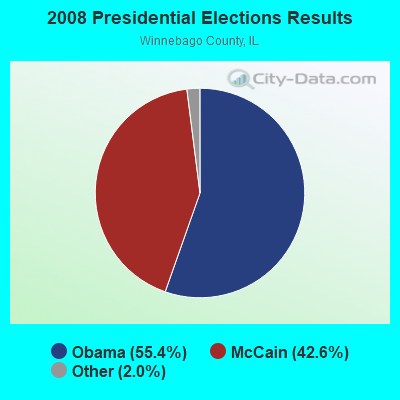
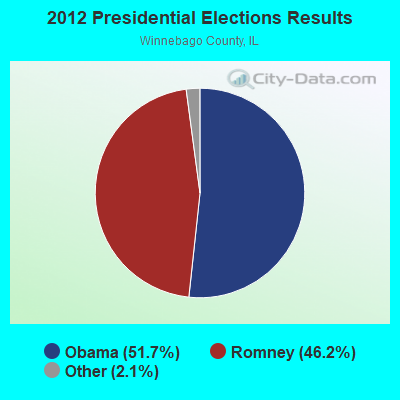
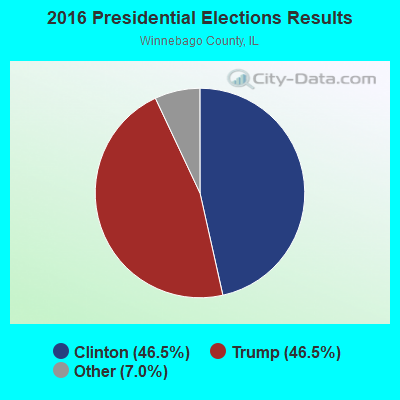
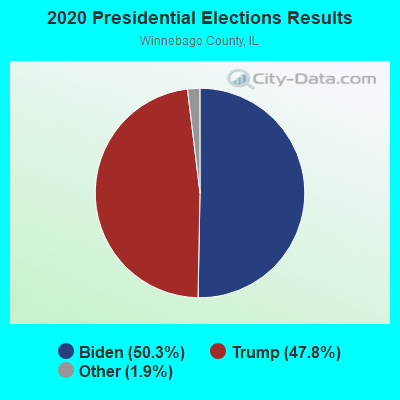
Graphs represent county-level data. Detailed 2008 Election Results
Neighborhoods in Rockford:
(Rockford, Illinois Neighborhood Map)- Airport neighborhood
- Auburn neighborhood
- Brown Hills neighborhood
- Camp Grant neighborhood
- Central Terrace neighborhood
- Champion Hills neighborhood
- Churchill's Grove neighborhood
- Downtown neighborhood
- East Rockford neighborhood
- Edgewater neighborhood
- HOPE VI neighborhood
- Haight Village neighborhood
- Lincolnwood Estates neighborhood
- Midtown North neighborhood
- Mulberry Forest neighborhood
- North End Square neighborhood
- North Rock neighborhood
- North Rockford neighborhood
- River District neighborhood
- River Oaks neighborhood
- Rolling Green neighborhood
- Seventh Street District neighborhood
- Signal Hill neighborhood
- South Rock neighborhood
- Spring Creek neighborhood
- St Paul's Place neighborhood
- Summerfield Commons neighborhood
- West Rockford neighborhood
Religion statistics for Rockford, IL (based on Winnebago County data)
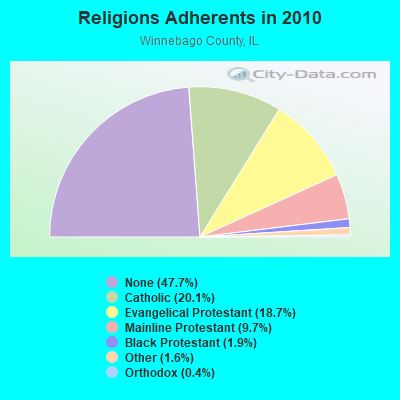
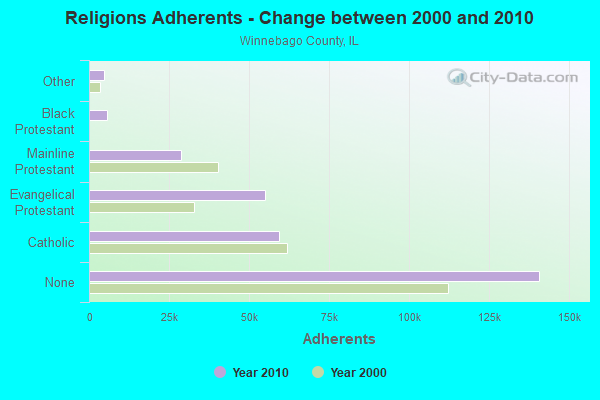
| Religion | Adherents | Congregations |
|---|---|---|
| Catholic | 59,373 | 16 |
| Evangelical Protestant | 55,069 | 149 |
| Mainline Protestant | 28,602 | 70 |
| Black Protestant | 5,544 | 18 |
| Other | 4,624 | 24 |
| Orthodox | 1,248 | 3 |
| None | 140,806 | - |
Food Environment Statistics:
| Winnebago County: | 1.78 / 10,000 pop. |
| State: | 2.24 / 10,000 pop. |
| This county: | 0.10 / 10,000 pop. |
| State: | 0.08 / 10,000 pop. |
| Winnebago County: | 0.54 / 10,000 pop. |
| Illinois: | 0.75 / 10,000 pop. |
| Winnebago County: | 3.49 / 10,000 pop. |
| Illinois: | 2.61 / 10,000 pop. |
| Here: | 7.42 / 10,000 pop. |
| State: | 6.86 / 10,000 pop. |
| Winnebago County: | 8.6% |
| Illinois: | 8.3% |
| This county: | 26.1% |
| State: | 25.2% |
| This county: | 15.9% |
| Illinois: | 14.5% |
Health and Nutrition:
| Rockford: | 48.0% |
| Illinois: | 49.5% |
| Rockford: | 44.5% |
| State: | 47.2% |
| Rockford: | 28.8 |
| Illinois: | 28.6 |
| This city: | 21.2% |
| Illinois: | 20.5% |
| Here: | 11.3% |
| Illinois: | 10.8% |
| Rockford: | 6.8 |
| State: | 6.8 |
| This city: | 33.3% |
| State: | 33.4% |
| Rockford: | 54.4% |
| State: | 56.4% |
| Rockford: | 78.7% |
| Illinois: | 79.9% |
More about Health and Nutrition of Rockford, IL Residents
| Local government employment and payroll (March 2022) | |||||
| Function | Full-time employees | Monthly full-time payroll | Average yearly full-time wage | Part-time employees | Monthly part-time payroll |
|---|---|---|---|---|---|
| Police Protection - Officers | 280 | $2,624,580 | $112,482 | 0 | $0 |
| Firefighters | 261 | $2,264,229 | $104,102 | 1 | $863 |
| Welfare | 87 | $353,225 | $48,721 | 0 | $0 |
| Streets and Highways | 58 | $135,579 | $28,051 | 0 | $0 |
| Other and Unallocable | 57 | $267,264 | $56,266 | 0 | $0 |
| Fire - Other | 56 | $379,152 | $81,247 | 1 | $1,718 |
| Local Libraries | 50 | $210,178 | $50,443 | 17 | $23,556 |
| Financial Administration | 40 | $208,300 | $62,490 | 0 | $0 |
| Police - Other | 40 | $180,562 | $54,169 | 2 | $4,275 |
| Water Supply | 32 | $189,981 | $71,243 | 0 | $0 |
| Other Government Administration | 30 | $193,121 | $77,248 | 0 | $0 |
| Sewerage | 26 | $133,561 | $61,644 | 0 | $0 |
| Housing and Community Development (Local) | 23 | $122,926 | $64,135 | 0 | $0 |
| Judicial and Legal | 13 | $78,614 | $72,567 | 1 | $257 |
| Totals for Government | 1,053 | $7,341,272 | $83,661 | 22 | $30,669 |
Rockford government finances - Expenditure in 2021 (per resident):
- Construction - Regular Highways: $35,170,000 ($239.72)
Central Staff Services: $5,888,000 ($40.13)
- Current Operations - Police Protection: $59,826,000 ($407.78)
Local Fire Protection: $55,851,000 ($380.68)
Housing and Community Development: $23,894,000 ($162.86)
Public Welfare - Other: $21,180,000 ($144.36)
Water Utilities: $19,232,000 ($131.09)
Central Staff Services: $16,915,000 ($115.29)
Regular Highways: $10,868,000 ($74.08)
Parks and Recreation: $10,811,000 ($73.69)
Transit Utilities: $9,864,000 ($67.23)
Libraries: $8,477,000 ($57.78)
Financial Administration: $7,781,000 ($53.04)
General - Other: $4,409,000 ($30.05)
Parking Facilities: $1,788,000 ($12.19)
Protective Inspection and Regulation - Other: $1,679,000 ($11.44)
- General - Interest on Debt: $5,114,000 ($34.86)
- Total Salaries and Wages: $87,403,000 ($595.74)
Rockford government finances - Revenue in 2021 (per resident):
- Charges - Other: $19,723,000 ($134.43)
Solid Waste Management: $13,696,000 ($93.35)
Parks and Recreation: $9,649,000 ($65.77)
Parking Facilities: $1,592,000 ($10.85)
- Federal Intergovernmental - Public Welfare: $26,478,000 ($180.47)
Housing and Community Development: $3,267,000 ($22.27)
Transit Utilities: $2,295,000 ($15.64)
Other: $1,998,000 ($13.62)
- Local Intergovernmental - Other: $18,639,000 ($127.04)
- Miscellaneous - General Revenue - Other: $9,053,000 ($61.71)
Fines and Forfeits: $2,313,000 ($15.77)
Interest Earnings: $917,000 ($6.25)
- Revenue - Water Utilities: $30,222,000 ($205.99)
Transit Utilities: $1,371,000 ($9.34)
- State Intergovernmental - General Local Government Support: $48,534,000 ($330.81)
Transit Utilities: $10,722,000 ($73.08)
Other: $6,837,000 ($46.60)
Highways: $5,563,000 ($37.92)
Housing and Community Development: $496,000 ($3.38)
- Tax - Property: $59,563,000 ($405.98)
General Sales and Gross Receipts: $20,707,000 ($141.14)
Public Utilities Sales: $11,013,000 ($75.06)
Other Selective Sales: $7,392,000 ($50.38)
Other License: $6,704,000 ($45.69)
Rockford government finances - Debt in 2021 (per resident):
- Long Term Debt - Outstanding Unspecified Public Purpose: $99,935,000 ($681.16)
Beginning Outstanding - Unspecified Public Purpose: $98,720,000 ($672.88)
Issue, Unspecified Public Purpose: $10,020,000 ($68.30)
Retired Unspecified Public Purpose: $8,805,000 ($60.02)
Rockford government finances - Cash and Securities in 2021 (per resident):
- Other Funds - Cash and Securities: $75,368,000 ($513.71)
| Businesses in Rockford, IL | ||||
| Name | Count | Name | Count | |
|---|---|---|---|---|
| ALDI | 2 | Kroger | 7 | |
| AT&T | 2 | La-Z-Boy | 2 | |
| Abercrombie & Fitch | 1 | Lane Bryant | 1 | |
| Ace Hardware | 2 | Lane Furniture | 2 | |
| Advance Auto Parts | 3 | LensCrafters | 1 | |
| Aeropostale | 1 | Little Caesars Pizza | 1 | |
| American Eagle Outfitters | 1 | Long John Silver's | 1 | |
| Ann Taylor | 1 | Lowe's | 1 | |
| Applebee's | 2 | Macy's | 1 | |
| Arby's | 4 | Marriott | 3 | |
| Ashley Furniture | 1 | Marshalls | 1 | |
| AutoZone | 4 | MasterBrand Cabinets | 9 | |
| BMW | 1 | Maurices | 1 | |
| Barnes & Noble | 1 | Mazda | 1 | |
| Baskin-Robbins | 2 | McDonald's | 14 | |
| Bath & Body Works | 1 | Men's Wearhouse | 2 | |
| Baymont Inn | 1 | Menards | 1 | |
| Bed Bath & Beyond | 1 | Motel 6 | 1 | |
| Best Western | 1 | Motherhood Maternity | 3 | |
| Blockbuster | 1 | New Balance | 2 | |
| Buffalo Wild Wings | 1 | Nike | 9 | |
| Burger King | 8 | Nissan | 1 | |
| Burlington Coat Factory | 1 | Office Depot | 1 | |
| CVS | 4 | OfficeMax | 1 | |
| Carson Pirie Scott | 1 | Old Country Buffet | 1 | |
| Casual Male XL | 1 | Old Navy | 1 | |
| Catherines | 1 | Olive Garden | 1 | |
| Charlotte Russe | 1 | Outback | 1 | |
| Chico's | 1 | Outback Steakhouse | 1 | |
| Chipotle | 1 | Pac Sun | 1 | |
| Chuck E. Cheese's | 1 | Panda Express | 2 | |
| Cinnabon | 1 | Panera Bread | 1 | |
| Circle K | 1 | Papa John's Pizza | 3 | |
| Cold Stone Creamery | 1 | Payless | 4 | |
| Coldwater Creek | 1 | Penske | 2 | |
| Comfort Inn | 1 | PetSmart | 1 | |
| Cracker Barrel | 1 | Pier 1 Imports | 1 | |
| Cricket Wireless | 7 | Pizza Hut | 3 | |
| Curves | 3 | Plato's Closet | 1 | |
| DHL | 5 | Popeyes | 2 | |
| Dairy Queen | 3 | Quality | 1 | |
| Days Inn | 1 | Quiznos | 2 | |
| Deb | 1 | RadioShack | 4 | |
| Dennys | 2 | Red Lobster | 1 | |
| Discount Tire | 1 | Red Robin | 1 | |
| Domino's Pizza | 3 | Red Roof Inn | 1 | |
| DressBarn | 1 | Ruby Tuesday | 1 | |
| Dressbarn | 1 | Rue21 | 1 | |
| Dunkin Donuts | 1 | Ryder Rental & Truck Leasing | 1 | |
| Eddie Bauer | 1 | SAS Shoes | 1 | |
| Ethan Allen | 1 | Sam's Club | 1 | |
| Express | 1 | Sears | 3 | |
| Extended Stay America | 1 | Shoe Carnival | 1 | |
| Famous Footwear | 1 | Sleep Inn | 1 | |
| FedEx | 33 | Slumberland | 1 | |
| Finish Line | 1 | Spencer Gifts | 1 | |
| Firestone Complete Auto Care | 2 | Sprint Nextel | 2 | |
| Foot Locker | 1 | Starbucks | 3 | |
| GNC | 1 | Steak 'n Shake | 1 | |
| GameStop | 4 | Studio Plus Deluxe Studios | 1 | |
| Goodwill | 2 | Subaru | 1 | |
| Gymboree | 1 | Super 8 | 1 | |
| H&R Block | 10 | T-Mobile | 8 | |
| Hilton | 1 | T.G.I. Driday's | 1 | |
| Hobby Lobby | 1 | Taco Bell | 5 | |
| Holiday Inn | 3 | Talbots | 1 | |
| Hollister Co. | 1 | Target | 1 | |
| Home Depot | 1 | The Limited | 1 | |
| Hot Topic | 1 | The Room Place | 2 | |
| Howard Johnson | 1 | Toys"R"Us | 2 | |
| Hyundai | 1 | U-Haul | 11 | |
| IHOP | 1 | U.S. Cellular | 8 | |
| JCPenney | 1 | UPS | 48 | |
| JoS. A. Bank | 1 | Vans | 3 | |
| Jones New York | 4 | Verizon Wireless | 3 | |
| Journeys | 1 | Victoria's Secret | 1 | |
| Just Tires | 1 | Volkswagen | 1 | |
| Justice | 1 | Walgreens | 10 | |
| KFC | 4 | Walmart | 3 | |
| Kincaid | 2 | Wendy's | 3 | |
| Kmart | 2 | Wet Seal | 1 | |
| Kohl's | 1 | YMCA | 5 | |
Strongest AM radio stations in Rockford:
- WROK (1440 AM; 5 kW; ROCKFORD, IL; Owner: CUMULUS LICENSING CORP.)
- WNTA (1330 AM; 1 kW; ROCKFORD, IL; Owner: AIRPLAY BROADCASTING CORP.)
- WSCR (670 AM; 50 kW; CHICAGO, IL; Owner: INFINITY BROADCASTING OPERATIONS, INC.)
- WTMJ (620 AM; 50 kW; MILWAUKEE, WI; Owner: JOURNAL BROADCAST CORPORATION)
- WGN (720 AM; 50 kW; CHICAGO, IL; Owner: WGN CONTINENTAL BROADCASTING CO.)
- WTJK (1380 AM; 5 kW; SOUTH BELOIT, IL; Owner: GOOD KARMA BROADCASTING, L.L.C.)
- WBBM (780 AM; 50 kW; CHICAGO, IL; Owner: INFINITY BROADCASTING OPERATIONS, INC.)
- WLUV (1520 AM; 0 kW; LOVES PARK, IL; Owner: ANGELO JOSEPH SALVI)
- WMVP (1000 AM; 50 kW; CHICAGO, IL; Owner: ABC, INC.)
- WISN (1130 AM; 50 kW; MILWAUKEE, WI; Owner: CAPSTAR TX LIMITED PARTNERSHIP)
- WLS (890 AM; 50 kW; CHICAGO, IL; Owner: WLS, INC.)
- WYLL (1160 AM; 50 kW; CHICAGO, IL; Owner: SCA LICENSE CORPORATION)
- WFRL (1570 AM; 5 kW; FREEPORT, IL; Owner: MAYFAIR BROADCASTING CORPORATION)
Strongest FM radio stations in Rockford:
- W233AD (94.5 FM; ROCKFORD, IL; Owner: FAMILY STATIONS, INC.)
- W289AB (105.7 FM; ROCKFORD, IL; Owner: NORTHERN ILLINOIS UNIVERSITY)
- WZOK (97.5 FM; ROCKFORD, IL; Owner: CUMULUS LICENSING CORP.)
- WGSL (91.1 FM; LOVES PARK, IL; Owner: CHRISTIAN LIFE CENTER SCHOOL)
- WQFL (100.9 FM; ROCKFORD, IL; Owner: QUEST FOR LIFE, INC.)
- WYHY (95.3 FM; WINNEBAGO, IL; Owner: AIRPLAY BROADCASTING CORPORATION)
- WFEN (88.3 FM; ROCKFORD, IL; Owner: FAITH ACADEMY, DBA WFEN)
- WGFB (103.1 FM; ROCKTON, IL; Owner: WRWC, Inc.)
- WKMQ-FM (96.7 FM; LOVES PARK, IL; Owner: CUMULUS LICENSING CORP.)
- WXRX (104.9 FM; BELVIDERE, IL; Owner: AIRPLAY BROADCASTING CORP.)
- W220BL (91.9 FM; ROCKFORD, IL; Owner: PENSACOLA CHRISTIAN COLLEGE, INC.)
- WNIU (89.5 FM; DEKALB, IL; Owner: NORTHERN ILLINOIS UNIVERSITY)
- WYCH (106.3 FM; GENOA, IL; Owner: DONTRON, INC.)
- WNIJ (90.5 FM; ROCKFORD, IL; Owner: NORTHERN ILLINOIS UNIVERSITY)
- WSEY (95.7 FM; OREGON, IL; Owner: NEWRADIO GROUP, LLC)
- WXXQ (98.5 FM; FREEPORT, IL; Owner: CUMULUS LICENSING CORP.)
- WSJY (107.3 FM; FORT ATKINSON, WI; Owner: NEWRADIO GROUP, LLC)
- WNIE (89.1 FM; FREEPORT, IL; Owner: NORTHERN ILLINOIS UNIVERSITY)
- WDKB (94.9 FM; DEKALB, IL; Owner: DEKALB COUNTY RADIO, LIMITED)
TV broadcast stations around Rockford:
- W25CL (Channel 25; ROCKFORD, IL; Owner: TRINITY BROADCASTING NETWORK)
- WQFL-CA (Channel 8; ROCKFORD, IL; Owner: FAMILY VALUES ORGANIZATION, INC.)
- WTVO (Channel 17; ROCKFORD, IL; Owner: WINNEBAGO TELEVISION CORPORATION)
- WIFR (Channel 23; FREEPORT, IL; Owner: GRAY MIDAMERICA TV LICENSEE CORP.)
- WQRF-TV (Channel 39; ROCKFORD, IL; Owner: QUORUM OF ROCKFORD LICENSE, LLC)
- WFBN-LP (Channel 33; ROCKFORD, IL; Owner: WEIGEL BROADCASTING COMPANY)
- WCFC-CA (Channel 51; ROCKFORD, IL; Owner: CHRISTIAN COMMUNICATIONS OF CHICAGOLAND, INC.)
- WREX-TV (Channel 13; ROCKFORD, IL; Owner: WREX TELEVISION, LLC)
Medal of Honor Recipients
Medal of Honor Recipients born in Rockford: Fred E. Smith, Jerry Wayne Wickam, Leonard B. Keller.
- National Bridge Inventory (NBI) Statistics
- 279Number of bridges
- 2,851ft / 869mTotal length
- $29,013,000Total costs
- 2,631,685Total average daily traffic
- 378,691Total average daily truck traffic
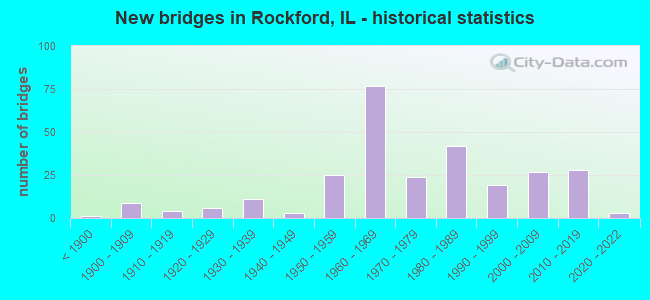
- New bridges - historical statistics
- 1Before 1900
- 91900-1909
- 41910-1919
- 61920-1929
- 111930-1939
- 31940-1949
- 251950-1959
- 771960-1969
- 241970-1979
- 421980-1989
- 191990-1999
- 272000-2009
- 282010-2019
- 32020-2022
FCC Registered Antenna Towers: 695 (See the full list of FCC Registered Antenna Towers)
FCC Registered Commercial Land Mobile Towers: 8 (See the full list of FCC Registered Commercial Land Mobile Towers in Rockford, IL)
FCC Registered Private Land Mobile Towers: 8 (See the full list of FCC Registered Private Land Mobile Towers)
FCC Registered Broadcast Land Mobile Towers: 182 (See the full list of FCC Registered Broadcast Land Mobile Towers)
FCC Registered Microwave Towers: 197 (See the full list of FCC Registered Microwave Towers in this town)
FCC Registered Paging Towers: 26 (See the full list of FCC Registered Paging Towers)
FCC Registered Maritime Coast & Aviation Ground Towers: 26 (See the full list of FCC Registered Maritime Coast & Aviation Ground Towers)
FCC Registered Amateur Radio Licenses: 681 (See the full list of FCC Registered Amateur Radio Licenses in Rockford)
FAA Registered Aircraft Manufacturers and Dealers: 1 (See the full list of FAA Registered Manufacturers and Dealers in Rockford)
FAA Registered Aircraft: 155 (See the full list of FAA Registered Aircraft)
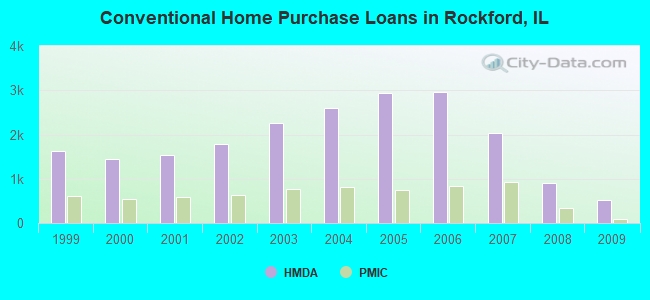
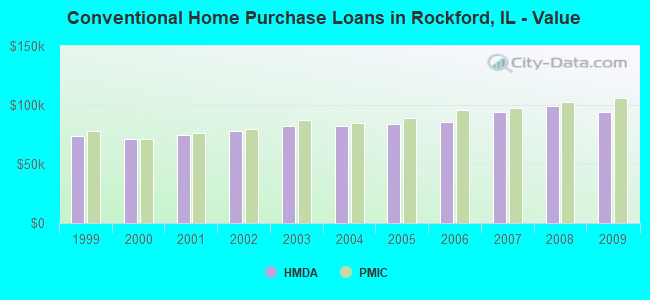
| Home Mortgage Disclosure Act Aggregated Statistics For Year 2009 (Based on 39 full and 16 partial tracts) | ||||||||||||||
| A) FHA, FSA/RHS & VA Home Purchase Loans | B) Conventional Home Purchase Loans | C) Refinancings | D) Home Improvement Loans | E) Loans on Dwellings For 5+ Families | F) Non-occupant Loans on < 5 Family Dwellings (A B C & D) | G) Loans On Manufactured Home Dwelling (A B C & D) | ||||||||
|---|---|---|---|---|---|---|---|---|---|---|---|---|---|---|
| Number | Average Value | Number | Average Value | Number | Average Value | Number | Average Value | Number | Average Value | Number | Average Value | Number | Average Value | |
| LOANS ORIGINATED | 574 | $95,309 | 528 | $94,322 | 3,471 | $105,308 | 161 | $28,542 | 18 | $438,848 | 431 | $63,023 | 3 | $57,033 |
| APPLICATIONS APPROVED, NOT ACCEPTED | 37 | $94,235 | 50 | $126,934 | 343 | $113,801 | 24 | $35,501 | 0 | $0 | 30 | $65,843 | 0 | $0 |
| APPLICATIONS DENIED | 88 | $80,539 | 101 | $73,335 | 881 | $105,183 | 160 | $21,647 | 2 | $366,000 | 83 | $66,516 | 4 | $26,265 |
| APPLICATIONS WITHDRAWN | 44 | $93,148 | 57 | $80,781 | 609 | $106,643 | 15 | $54,156 | 1 | $99,000 | 38 | $74,227 | 0 | $0 |
| FILES CLOSED FOR INCOMPLETENESS | 14 | $102,184 | 10 | $57,942 | 128 | $107,887 | 7 | $47,183 | 0 | $0 | 9 | $76,111 | 0 | $0 |
Detailed mortgage data for all 54 tracts in Rockford, IL
| Private Mortgage Insurance Companies Aggregated Statistics For Year 2009 (Based on 34 full and 16 partial tracts) | ||||||
| A) Conventional Home Purchase Loans | B) Refinancings | C) Non-occupant Loans on < 5 Family Dwellings (A & B) | ||||
|---|---|---|---|---|---|---|
| Number | Average Value | Number | Average Value | Number | Average Value | |
| LOANS ORIGINATED | 96 | $106,354 | 133 | $120,035 | 0 | $0 |
| APPLICATIONS APPROVED, NOT ACCEPTED | 28 | $107,310 | 48 | $128,271 | 5 | $92,610 |
| APPLICATIONS DENIED | 18 | $94,058 | 17 | $127,295 | 0 | $0 |
| APPLICATIONS WITHDRAWN | 9 | $175,444 | 17 | $134,548 | 0 | $0 |
| FILES CLOSED FOR INCOMPLETENESS | 5 | $79,558 | 4 | $109,465 | 2 | $65,595 |
2002 - 2018 National Fire Incident Reporting System (NFIRS) incidents
- Fire incident types reported to NFIRS in Rockford, IL
- 4,98947.8%Structure Fires
- 3,26131.3%Outside Fires
- 2,00519.2%Mobile Property/Vehicle Fires
- 1801.7%Other
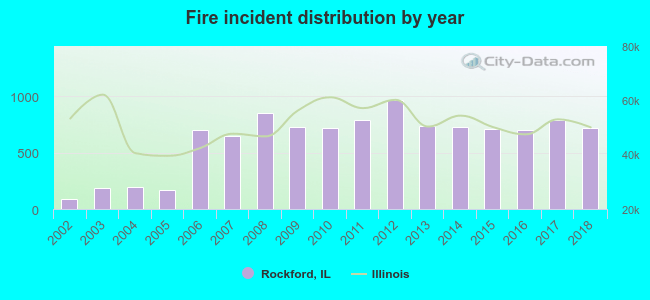 Based on the data from the years 2002 - 2018 the average number of fires per year is 614. The highest number of fires - 964 took place in 2012, and the least - 85 in 2002. The data has an increasing trend.
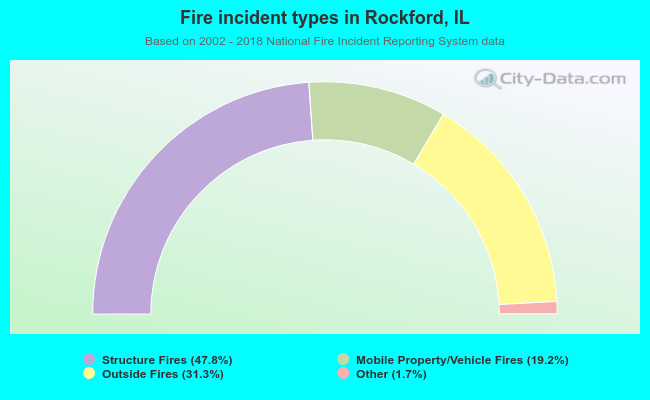 When looking into fire subcategories, the most reports belonged to: Structure Fires (47.8%), and Outside Fires (31.3%).
Fire-safe hotels and motels in Rockford, Illinois:
- Howard Johnson Hotel, 3909 11TH St, Rockford, Illinois 61109 , Phone: (815) 397-9000, Fax: (815) 397-4669
- Best Western Clock Tower Resort & Conf CTR, 7801 E State St, Rockford, Illinois 61108 , Phone: (815) 398-6000
- Super 8, 7646 Colosseum Dr, Rockford, Illinois 61107 , Phone: (815) 229-5522, Fax: (815) 229-5547
- Hampton Inn Rockford, 615 Clark Dr, Rockford, Illinois 61107 , Phone: (815) 229-0404, Fax: (815) 229-0175
- Courtyard Inn By Marriott, 7676 E State St, Rockford, Illinois 61108 , Phone: (815) 397-6222, Fax: (815) 397-6254
- Motel 6, 7712 Potawatomi Trl, Rockford, Illinois 61107 , Phone: (815) 397-8000, Fax: (815) 397-8183
- Red Roof Inn Of Rockford, 7434 E State St, Rockford, Illinois 61108 , Phone: (815) 398-9750, Fax: (815) 398-9761
- Comfort Inn Rockford, 7392 Argus Dr, Rockford, Illinois 61107 , Phone: (815) 398-7061, Fax: (815) 398-7061
- 16 other hotels and motels
| Most common first names in Rockford, IL among deceased individuals | ||
| Name | Count | Lived (average) |
|---|---|---|
| John | 1,334 | 75.6 years |
| Mary | 1,229 | 79.8 years |
| Robert | 1,099 | 71.2 years |
| William | 909 | 74.4 years |
| James | 709 | 70.8 years |
| Helen | 678 | 80.5 years |
| Charles | 671 | 74.7 years |
| George | 617 | 75.8 years |
| Joseph | 570 | 75.8 years |
| Ruth | 554 | 80.8 years |
| Most common last names in Rockford, IL among deceased individuals | ||
| Last name | Count | Lived (average) |
|---|---|---|
| Johnson | 1,595 | 78.6 years |
| Anderson | 777 | 79.5 years |
| Carlson | 548 | 80.6 years |
| Peterson | 518 | 79.1 years |
| Smith | 465 | 75.0 years |
| Nelson | 464 | 78.8 years |
| Larson | 305 | 79.8 years |
| Olson | 277 | 79.5 years |
| Brown | 255 | 75.9 years |
| Williams | 242 | 72.7 years |
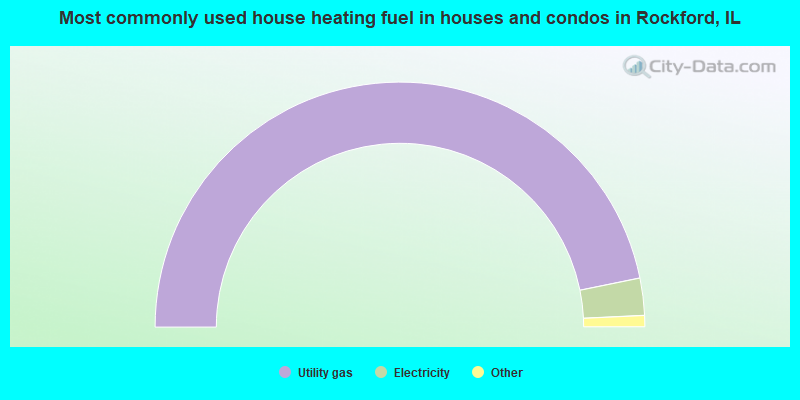
- 93.6%Utility gas
- 4.9%Electricity
- 1.0%Bottled, tank, or LP gas
- 0.3%No fuel used
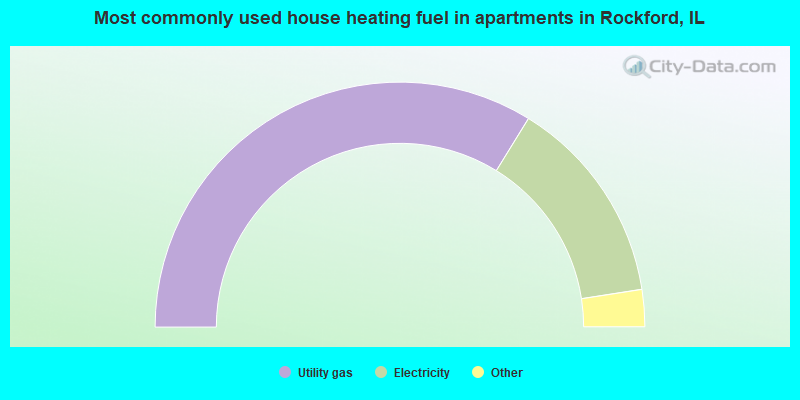
- 67.6%Utility gas
- 27.5%Electricity
- 2.6%No fuel used
- 1.2%Bottled, tank, or LP gas
- 1.0%Other fuel
Rockford compared to Illinois state average:
- Median house value below state average.
- Unemployed percentage below state average.
- Length of stay since moving in below state average.
Rockford, IL compared to other similar cities:
Rockford on our top lists:
- #9 on the list of "Top 100 high-educated but low-earning cities"
- #10 on the list of "Top 101 cities with largest percentage of females in occupations: installation, maintenance, and repair occupations (population 50,000+)"
- #14 on the list of "Top 101 cities with the highest number of assaults per 100,000 residents, excludes tourist destinations and others with a lot of outsiders visiting based on city industries data (population 50,000+)"
- #16 on the list of "Top 101 cities with largest percentage of females in industries: manufacturing (population 50,000+)"
- #20 on the list of "Top 101 cities with largest percentage of males in industries: manufacturing (population 50,000+)"
- #24 on the list of "Top 101 cities with the highest number of rapes per 100,000 residents, excludes tourist destinations and others with a lot of outsiders visiting based on city industries data (population 50,000+)"
- #29 on the list of "Top 101 cities with the largest percentage of high school students in private schools (3,000+ students)"
- #30 on the list of "Top 101 cities with largest percentage of males in occupations: production occupations (population 50,000+)"
- #35 on the list of "Top 100 least-safe cities (highest city-data.com crime index) (pop. 50,000+)"
- #37 on the list of "Top 101 cities with the highest city-data.com crime index, excludes tourist destinations and others with a lot of outsiders visiting based on city industries data (population 50,000+)"
- #38 on the list of "Top 101 cities with the coldest winters (population 50,000+)"
- #39 on the list of "Top 101 cities with the lowest cost per building permit (population 50,000+)"
- #42 on the list of "Top 101 cities with the largest city-data.com crime index per police officer (population 50,000+)"
- #45 on the list of "Top 101 cities with the lowest daily low temperatures (population 50,000+)"
- #46 on the list of "Top 101 cities with the largest temperature differences during a year (population 50,000+)"
- #49 on the list of "Top 101 cities with largest percentage of females in occupations: healthcare support occupations (population 50,000+)"
- #59 on the list of "Top 101 cities with the largest wind speed differences during a year (population 50,000+)"
- #60 on the list of "Top 101 cities with largest percentage of males in occupations: material moving occupations (population 50,000+)"
- #62 on the list of "Top 101 cities with the highest number of arson incidents per 100,000 residents, excludes tourist destinations and others with a lot of outsiders visiting based on city industries data (population 50,000+)"
- #62 on the list of "Top 101 cities with the highest average snowfall in a year (population 50,000+)"
- #36 (61107) on the list of "Top 101 zip codes with the largest percentage of Swedish first ancestries (pop 5,000+)"
- #3 on the list of "Top 101 counties with the lowest percentage of residents relocating from foreign countries between 2010 and 2011"
- #15 on the list of "Top 101 counties with the largest number of people moving out compared to moving in (pop. 50,000+)"
- #39 on the list of "Top 101 counties with the lowest percentage of residents relocating from other counties between 2010 and 2011 (pop. 50,000+)"
- #41 on the list of "Top 101 counties with the lowest percentage of residents relocating to foreign countries in 2011"
- #63 on the list of "Top 101 counties with the largest decrease in the number of infant deaths per 1000 residents 2000-2006 to 2007-2013 (pop. 50,000+)"
State forum archive:
- Illinois Pages: 2 3 4 5 6 7 8 9 10 11 12 13 14 15 16 17 18 19
- Chicago Pages: 2 3 4 5 6 7 8 9 10 11 12 13 14 15 16 17 18 19 20 21 22 23 24 25 26 27 28 29 30 31 32 33 34 35 36 37 38 39 40 41 42 43 44 45 46 47 48 49 50 51 52 53 54 55 56 57 58 59 60 61 62 63 64 65 66 67 68 69 70 71 72 73 74 75 76 77 78 79 80 81 82 83 84
- Chicago Suburbs Pages: 2 3 4 5 6 7 8 9 10 11 12 13 14 15 16 17 18 19 20 21 22 23 24 25 26 27 28 29 30 31 32 33 34 35 36 37 38 39 40 41 42 43 44 45 46 47 48 49 50 51 52

|
|
Total of 1147 patent applications in 2008-2024.