Belvidere, Illinois Submit your own pictures of this city and show them to the world
OSM Map
General Map
Google Map
MSN Map
OSM Map
General Map
Google Map
MSN Map
OSM Map
General Map
Google Map
MSN Map
OSM Map
General Map
Google Map
MSN Map
Please wait while loading the map...
Population in 2022: 25,169 (99% urban, 1% rural). Population change since 2000: +20.9%Males: 12,510 Females: 12,659
March 2022 cost of living index in Belvidere: 84.7 (less than average, U.S. average is 100) Percentage of residents living in poverty in 2022: 14.4%for White Non-Hispanic residents , 10.1% for Black residents , 16.7% for Hispanic or Latino residents , 100.0% for American Indian residents , 26.3% for other race residents , 12.7% for two or more races residents )
Profiles of local businesses
Business Search - 14 Million verified businesses
Data:
Median household income ($)
Median household income (% change since 2000)
Household income diversity
Ratio of average income to average house value (%)
Ratio of average income to average rent
Median household income ($) - White
Median household income ($) - Black or African American
Median household income ($) - Asian
Median household income ($) - Hispanic or Latino
Median household income ($) - American Indian and Alaska Native
Median household income ($) - Multirace
Median household income ($) - Other Race
Median household income for houses/condos with a mortgage ($)
Median household income for apartments without a mortgage ($)
Races - White alone (%)
Races - White alone (% change since 2000)
Races - Black alone (%)
Races - Black alone (% change since 2000)
Races - American Indian alone (%)
Races - American Indian alone (% change since 2000)
Races - Asian alone (%)
Races - Asian alone (% change since 2000)
Races - Hispanic (%)
Races - Hispanic (% change since 2000)
Races - Native Hawaiian and Other Pacific Islander alone (%)
Races - Native Hawaiian and Other Pacific Islander alone (% change since 2000)
Races - Two or more races (%)
Races - Two or more races (% change since 2000)
Races - Other race alone (%)
Races - Other race alone (% change since 2000)
Racial diversity
Unemployment (%)
Unemployment (% change since 2000)
Unemployment (%) - White
Unemployment (%) - Black or African American
Unemployment (%) - Asian
Unemployment (%) - Hispanic or Latino
Unemployment (%) - American Indian and Alaska Native
Unemployment (%) - Multirace
Unemployment (%) - Other Race
Population density (people per square mile)
Population - Males (%)
Population - Females (%)
Population - Males (%) - White
Population - Males (%) - Black or African American
Population - Males (%) - Asian
Population - Males (%) - Hispanic or Latino
Population - Males (%) - American Indian and Alaska Native
Population - Males (%) - Multirace
Population - Males (%) - Other Race
Population - Females (%) - White
Population - Females (%) - Black or African American
Population - Females (%) - Asian
Population - Females (%) - Hispanic or Latino
Population - Females (%) - American Indian and Alaska Native
Population - Females (%) - Multirace
Population - Females (%) - Other Race
Coronavirus confirmed cases (Apr 27, 2024)
Deaths caused by coronavirus (Apr 27, 2024)
Coronavirus confirmed cases (per 100k population) (Apr 27, 2024)
Deaths caused by coronavirus (per 100k population) (Apr 27, 2024)
Daily increase in number of cases (Apr 27, 2024)
Weekly increase in number of cases (Apr 27, 2024)
Cases doubled (in days) (Apr 27, 2024)
Hospitalized patients (Apr 18, 2022)
Negative test results (Apr 18, 2022)
Total test results (Apr 18, 2022)
COVID Vaccine doses distributed (per 100k population) (Sep 19, 2023)
COVID Vaccine doses administered (per 100k population) (Sep 19, 2023)
COVID Vaccine doses distributed (Sep 19, 2023)
COVID Vaccine doses administered (Sep 19, 2023)
Likely homosexual households (%)
Likely homosexual households (% change since 2000)
Likely homosexual households - Lesbian couples (%)
Likely homosexual households - Lesbian couples (% change since 2000)
Likely homosexual households - Gay men (%)
Likely homosexual households - Gay men (% change since 2000)
Cost of living index
Median gross rent ($)
Median contract rent ($)
Median monthly housing costs ($)
Median house or condo value ($)
Median house or condo value ($ change since 2000)
Mean house or condo value by units in structure - 1, detached ($)
Mean house or condo value by units in structure - 1, attached ($)
Mean house or condo value by units in structure - 2 ($)
Mean house or condo value by units in structure by units in structure - 3 or 4 ($)
Mean house or condo value by units in structure - 5 or more ($)
Mean house or condo value by units in structure - Boat, RV, van, etc. ($)
Mean house or condo value by units in structure - Mobile home ($)
Median house or condo value ($) - White
Median house or condo value ($) - Black or African American
Median house or condo value ($) - Asian
Median house or condo value ($) - Hispanic or Latino
Median house or condo value ($) - American Indian and Alaska Native
Median house or condo value ($) - Multirace
Median house or condo value ($) - Other Race
Median resident age
Resident age diversity
Median resident age - Males
Median resident age - Females
Median resident age - White
Median resident age - Black or African American
Median resident age - Asian
Median resident age - Hispanic or Latino
Median resident age - American Indian and Alaska Native
Median resident age - Multirace
Median resident age - Other Race
Median resident age - Males - White
Median resident age - Males - Black or African American
Median resident age - Males - Asian
Median resident age - Males - Hispanic or Latino
Median resident age - Males - American Indian and Alaska Native
Median resident age - Males - Multirace
Median resident age - Males - Other Race
Median resident age - Females - White
Median resident age - Females - Black or African American
Median resident age - Females - Asian
Median resident age - Females - Hispanic or Latino
Median resident age - Females - American Indian and Alaska Native
Median resident age - Females - Multirace
Median resident age - Females - Other Race
Commute - mean travel time to work (minutes)
Travel time to work - Less than 5 minutes (%)
Travel time to work - Less than 5 minutes (% change since 2000)
Travel time to work - 5 to 9 minutes (%)
Travel time to work - 5 to 9 minutes (% change since 2000)
Travel time to work - 10 to 19 minutes (%)
Travel time to work - 10 to 19 minutes (% change since 2000)
Travel time to work - 20 to 29 minutes (%)
Travel time to work - 20 to 29 minutes (% change since 2000)
Travel time to work - 30 to 39 minutes (%)
Travel time to work - 30 to 39 minutes (% change since 2000)
Travel time to work - 40 to 59 minutes (%)
Travel time to work - 40 to 59 minutes (% change since 2000)
Travel time to work - 60 to 89 minutes (%)
Travel time to work - 60 to 89 minutes (% change since 2000)
Travel time to work - 90 or more minutes (%)
Travel time to work - 90 or more minutes (% change since 2000)
Marital status - Never married (%)
Marital status - Now married (%)
Marital status - Separated (%)
Marital status - Widowed (%)
Marital status - Divorced (%)
Median family income ($)
Median family income (% change since 2000)
Median non-family income ($)
Median non-family income (% change since 2000)
Median per capita income ($)
Median per capita income (% change since 2000)
Median family income ($) - White
Median family income ($) - Black or African American
Median family income ($) - Asian
Median family income ($) - Hispanic or Latino
Median family income ($) - American Indian and Alaska Native
Median family income ($) - Multirace
Median family income ($) - Other Race
Median year house/condo built
Median year apartment built
Year house built - Built 2005 or later (%)
Year house built - Built 2000 to 2004 (%)
Year house built - Built 1990 to 1999 (%)
Year house built - Built 1980 to 1989 (%)
Year house built - Built 1970 to 1979 (%)
Year house built - Built 1960 to 1969 (%)
Year house built - Built 1950 to 1959 (%)
Year house built - Built 1940 to 1949 (%)
Year house built - Built 1939 or earlier (%)
Average household size
Household density (households per square mile)
Average household size - White
Average household size - Black or African American
Average household size - Asian
Average household size - Hispanic or Latino
Average household size - American Indian and Alaska Native
Average household size - Multirace
Average household size - Other Race
Occupied housing units (%)
Vacant housing units (%)
Owner occupied housing units (%)
Renter occupied housing units (%)
Vacancy status - For rent (%)
Vacancy status - For sale only (%)
Vacancy status - Rented or sold, not occupied (%)
Vacancy status - For seasonal, recreational, or occasional use (%)
Vacancy status - For migrant workers (%)
Vacancy status - Other vacant (%)
Residents with income below the poverty level (%)
Residents with income below 50% of the poverty level (%)
Children below poverty level (%)
Poor families by family type - Married-couple family (%)
Poor families by family type - Male, no wife present (%)
Poor families by family type - Female, no husband present (%)
Poverty status for native-born residents (%)
Poverty status for foreign-born residents (%)
Poverty among high school graduates not in families (%)
Poverty among people who did not graduate high school not in families (%)
Residents with income below the poverty level (%) - White
Residents with income below the poverty level (%) - Black or African American
Residents with income below the poverty level (%) - Asian
Residents with income below the poverty level (%) - Hispanic or Latino
Residents with income below the poverty level (%) - American Indian and Alaska Native
Residents with income below the poverty level (%) - Multirace
Residents with income below the poverty level (%) - Other Race
Air pollution - Air Quality Index (AQI)
Air pollution - CO
Air pollution - NO2
Air pollution - SO2
Air pollution - Ozone
Air pollution - PM10
Air pollution - PM25
Air pollution - Pb
Crime - Murders per 100,000 population
Crime - Rapes per 100,000 population
Crime - Robberies per 100,000 population
Crime - Assaults per 100,000 population
Crime - Burglaries per 100,000 population
Crime - Thefts per 100,000 population
Crime - Auto thefts per 100,000 population
Crime - Arson per 100,000 population
Crime - City-data.com crime index
Crime - Violent crime index
Crime - Property crime index
Crime - Murders per 100,000 population (5 year average)
Crime - Rapes per 100,000 population (5 year average)
Crime - Robberies per 100,000 population (5 year average)
Crime - Assaults per 100,000 population (5 year average)
Crime - Burglaries per 100,000 population (5 year average)
Crime - Thefts per 100,000 population (5 year average)
Crime - Auto thefts per 100,000 population (5 year average)
Crime - Arson per 100,000 population (5 year average)
Crime - City-data.com crime index (5 year average)
Crime - Violent crime index (5 year average)
Crime - Property crime index (5 year average)
1996 Presidential Elections Results (%) - Democratic Party (Clinton)
1996 Presidential Elections Results (%) - Republican Party (Dole)
1996 Presidential Elections Results (%) - Other
2000 Presidential Elections Results (%) - Democratic Party (Gore)
2000 Presidential Elections Results (%) - Republican Party (Bush)
2000 Presidential Elections Results (%) - Other
2004 Presidential Elections Results (%) - Democratic Party (Kerry)
2004 Presidential Elections Results (%) - Republican Party (Bush)
2004 Presidential Elections Results (%) - Other
2008 Presidential Elections Results (%) - Democratic Party (Obama)
2008 Presidential Elections Results (%) - Republican Party (McCain)
2008 Presidential Elections Results (%) - Other
2012 Presidential Elections Results (%) - Democratic Party (Obama)
2012 Presidential Elections Results (%) - Republican Party (Romney)
2012 Presidential Elections Results (%) - Other
2016 Presidential Elections Results (%) - Democratic Party (Clinton)
2016 Presidential Elections Results (%) - Republican Party (Trump)
2016 Presidential Elections Results (%) - Other
2020 Presidential Elections Results (%) - Democratic Party (Biden)
2020 Presidential Elections Results (%) - Republican Party (Trump)
2020 Presidential Elections Results (%) - Other
Ancestries Reported - Arab (%)
Ancestries Reported - Czech (%)
Ancestries Reported - Danish (%)
Ancestries Reported - Dutch (%)
Ancestries Reported - English (%)
Ancestries Reported - French (%)
Ancestries Reported - French Canadian (%)
Ancestries Reported - German (%)
Ancestries Reported - Greek (%)
Ancestries Reported - Hungarian (%)
Ancestries Reported - Irish (%)
Ancestries Reported - Italian (%)
Ancestries Reported - Lithuanian (%)
Ancestries Reported - Norwegian (%)
Ancestries Reported - Polish (%)
Ancestries Reported - Portuguese (%)
Ancestries Reported - Russian (%)
Ancestries Reported - Scotch-Irish (%)
Ancestries Reported - Scottish (%)
Ancestries Reported - Slovak (%)
Ancestries Reported - Subsaharan African (%)
Ancestries Reported - Swedish (%)
Ancestries Reported - Swiss (%)
Ancestries Reported - Ukrainian (%)
Ancestries Reported - United States (%)
Ancestries Reported - Welsh (%)
Ancestries Reported - West Indian (%)
Ancestries Reported - Other (%)
Educational Attainment - No schooling completed (%)
Educational Attainment - Less than high school (%)
Educational Attainment - High school or equivalent (%)
Educational Attainment - Less than 1 year of college (%)
Educational Attainment - 1 or more years of college (%)
Educational Attainment - Associate degree (%)
Educational Attainment - Bachelor's degree (%)
Educational Attainment - Master's degree (%)
Educational Attainment - Professional school degree (%)
Educational Attainment - Doctorate degree (%)
School Enrollment - Nursery, preschool (%)
School Enrollment - Kindergarten (%)
School Enrollment - Grade 1 to 4 (%)
School Enrollment - Grade 5 to 8 (%)
School Enrollment - Grade 9 to 12 (%)
School Enrollment - College undergrad (%)
School Enrollment - Graduate or professional (%)
School Enrollment - Not enrolled in school (%)
School enrollment - Public schools (%)
School enrollment - Private schools (%)
School enrollment - Not enrolled (%)
Median number of rooms in houses and condos
Median number of rooms in apartments
Housing units lacking complete plumbing facilities (%)
Housing units lacking complete kitchen facilities (%)
Density of houses
Urban houses (%)
Rural houses (%)
Households with people 60 years and over (%)
Households with people 65 years and over (%)
Households with people 75 years and over (%)
Households with one or more nonrelatives (%)
Households with no nonrelatives (%)
Population in households (%)
Family households (%)
Nonfamily households (%)
Population in families (%)
Family households with own children (%)
Median number of bedrooms in owner occupied houses
Mean number of bedrooms in owner occupied houses
Median number of bedrooms in renter occupied houses
Mean number of bedrooms in renter occupied houses
Median number of vehichles in owner occupied houses
Mean number of vehichles in owner occupied houses
Median number of vehichles in renter occupied houses
Mean number of vehichles in renter occupied houses
Mortgage status - with mortgage (%)
Mortgage status - with second mortgage (%)
Mortgage status - with home equity loan (%)
Mortgage status - with both second mortgage and home equity loan (%)
Mortgage status - without a mortgage (%)
Average family size
Average family size - White
Average family size - Black or African American
Average family size - Asian
Average family size - Hispanic or Latino
Average family size - American Indian and Alaska Native
Average family size - Multirace
Average family size - Other Race
Geographical mobility - Same house 1 year ago (%)
Geographical mobility - Moved within same county (%)
Geographical mobility - Moved from different county within same state (%)
Geographical mobility - Moved from different state (%)
Geographical mobility - Moved from abroad (%)
Place of birth - Born in state of residence (%)
Place of birth - Born in other state (%)
Place of birth - Native, outside of US (%)
Place of birth - Foreign born (%)
Housing units in structures - 1, detached (%)
Housing units in structures - 1, attached (%)
Housing units in structures - 2 (%)
Housing units in structures - 3 or 4 (%)
Housing units in structures - 5 to 9 (%)
Housing units in structures - 10 to 19 (%)
Housing units in structures - 20 to 49 (%)
Housing units in structures - 50 or more (%)
Housing units in structures - Mobile home (%)
Housing units in structures - Boat, RV, van, etc. (%)
House/condo owner moved in on average (years ago)
Renter moved in on average (years ago)
Year householder moved into unit - Moved in 1999 to March 2000 (%)
Year householder moved into unit - Moved in 1995 to 1998 (%)
Year householder moved into unit - Moved in 1990 to 1994 (%)
Year householder moved into unit - Moved in 1980 to 1989 (%)
Year householder moved into unit - Moved in 1970 to 1979 (%)
Year householder moved into unit - Moved in 1969 or earlier (%)
Means of transportation to work - Drove car alone (%)
Means of transportation to work - Carpooled (%)
Means of transportation to work - Public transportation (%)
Means of transportation to work - Bus or trolley bus (%)
Means of transportation to work - Streetcar or trolley car (%)
Means of transportation to work - Subway or elevated (%)
Means of transportation to work - Railroad (%)
Means of transportation to work - Ferryboat (%)
Means of transportation to work - Taxicab (%)
Means of transportation to work - Motorcycle (%)
Means of transportation to work - Bicycle (%)
Means of transportation to work - Walked (%)
Means of transportation to work - Other means (%)
Working at home (%)
Industry diversity
Most Common Industries - Agriculture, forestry, fishing and hunting, and mining (%)
Most Common Industries - Agriculture, forestry, fishing and hunting (%)
Most Common Industries - Mining, quarrying, and oil and gas extraction (%)
Most Common Industries - Construction (%)
Most Common Industries - Manufacturing (%)
Most Common Industries - Wholesale trade (%)
Most Common Industries - Retail trade (%)
Most Common Industries - Transportation and warehousing, and utilities (%)
Most Common Industries - Transportation and warehousing (%)
Most Common Industries - Utilities (%)
Most Common Industries - Information (%)
Most Common Industries - Finance and insurance, and real estate and rental and leasing (%)
Most Common Industries - Finance and insurance (%)
Most Common Industries - Real estate and rental and leasing (%)
Most Common Industries - Professional, scientific, and management, and administrative and waste management services (%)
Most Common Industries - Professional, scientific, and technical services (%)
Most Common Industries - Management of companies and enterprises (%)
Most Common Industries - Administrative and support and waste management services (%)
Most Common Industries - Educational services, and health care and social assistance (%)
Most Common Industries - Educational services (%)
Most Common Industries - Health care and social assistance (%)
Most Common Industries - Arts, entertainment, and recreation, and accommodation and food services (%)
Most Common Industries - Arts, entertainment, and recreation (%)
Most Common Industries - Accommodation and food services (%)
Most Common Industries - Other services, except public administration (%)
Most Common Industries - Public administration (%)
Occupation diversity
Most Common Occupations - Management, business, science, and arts occupations (%)
Most Common Occupations - Management, business, and financial occupations (%)
Most Common Occupations - Management occupations (%)
Most Common Occupations - Business and financial operations occupations (%)
Most Common Occupations - Computer, engineering, and science occupations (%)
Most Common Occupations - Computer and mathematical occupations (%)
Most Common Occupations - Architecture and engineering occupations (%)
Most Common Occupations - Life, physical, and social science occupations (%)
Most Common Occupations - Education, legal, community service, arts, and media occupations (%)
Most Common Occupations - Community and social service occupations (%)
Most Common Occupations - Legal occupations (%)
Most Common Occupations - Education, training, and library occupations (%)
Most Common Occupations - Arts, design, entertainment, sports, and media occupations (%)
Most Common Occupations - Healthcare practitioners and technical occupations (%)
Most Common Occupations - Health diagnosing and treating practitioners and other technical occupations (%)
Most Common Occupations - Health technologists and technicians (%)
Most Common Occupations - Service occupations (%)
Most Common Occupations - Healthcare support occupations (%)
Most Common Occupations - Protective service occupations (%)
Most Common Occupations - Fire fighting and prevention, and other protective service workers including supervisors (%)
Most Common Occupations - Law enforcement workers including supervisors (%)
Most Common Occupations - Food preparation and serving related occupations (%)
Most Common Occupations - Building and grounds cleaning and maintenance occupations (%)
Most Common Occupations - Personal care and service occupations (%)
Most Common Occupations - Sales and office occupations (%)
Most Common Occupations - Sales and related occupations (%)
Most Common Occupations - Office and administrative support occupations (%)
Most Common Occupations - Natural resources, construction, and maintenance occupations (%)
Most Common Occupations - Farming, fishing, and forestry occupations (%)
Most Common Occupations - Construction and extraction occupations (%)
Most Common Occupations - Installation, maintenance, and repair occupations (%)
Most Common Occupations - Production, transportation, and material moving occupations (%)
Most Common Occupations - Production occupations (%)
Most Common Occupations - Transportation occupations (%)
Most Common Occupations - Material moving occupations (%)
People in Group quarters - Institutionalized population (%)
People in Group quarters - Correctional institutions (%)
People in Group quarters - Federal prisons and detention centers (%)
People in Group quarters - Halfway houses (%)
People in Group quarters - Local jails and other confinement facilities (including police lockups) (%)
People in Group quarters - Military disciplinary barracks (%)
People in Group quarters - State prisons (%)
People in Group quarters - Other types of correctional institutions (%)
People in Group quarters - Nursing homes (%)
People in Group quarters - Hospitals/wards, hospices, and schools for the handicapped (%)
People in Group quarters - Hospitals/wards and hospices for chronically ill (%)
People in Group quarters - Hospices or homes for chronically ill (%)
People in Group quarters - Military hospitals or wards for chronically ill (%)
People in Group quarters - Other hospitals or wards for chronically ill (%)
People in Group quarters - Hospitals or wards for drug/alcohol abuse (%)
People in Group quarters - Mental (Psychiatric) hospitals or wards (%)
People in Group quarters - Schools, hospitals, or wards for the mentally retarded (%)
People in Group quarters - Schools, hospitals, or wards for the physically handicapped (%)
People in Group quarters - Institutions for the deaf (%)
People in Group quarters - Institutions for the blind (%)
People in Group quarters - Orthopedic wards and institutions for the physically handicapped (%)
People in Group quarters - Wards in general hospitals for patients who have no usual home elsewhere (%)
People in Group quarters - Wards in military hospitals for patients who have no usual home elsewhere (%)
People in Group quarters - Juvenile institutions (%)
People in Group quarters - Long-term care (%)
People in Group quarters - Homes for abused, dependent, and neglected children (%)
People in Group quarters - Residential treatment centers for emotionally disturbed children (%)
People in Group quarters - Training schools for juvenile delinquents (%)
People in Group quarters - Short-term care, detention or diagnostic centers for delinquent children (%)
People in Group quarters - Type of juvenile institution unknown (%)
People in Group quarters - Noninstitutionalized population (%)
People in Group quarters - College dormitories (includes college quarters off campus) (%)
People in Group quarters - Military quarters (%)
People in Group quarters - On base (%)
People in Group quarters - Barracks, unaccompanied personnel housing (UPH), (Enlisted/Officer), ;and similar group living quarters for military personnel (%)
People in Group quarters - Transient quarters for temporary residents (%)
People in Group quarters - Military ships (%)
People in Group quarters - Group homes (%)
People in Group quarters - Homes or halfway houses for drug/alcohol abuse (%)
People in Group quarters - Homes for the mentally ill (%)
People in Group quarters - Homes for the mentally retarded (%)
People in Group quarters - Homes for the physically handicapped (%)
People in Group quarters - Other group homes (%)
People in Group quarters - Religious group quarters (%)
People in Group quarters - Dormitories (%)
People in Group quarters - Agriculture workers' dormitories on farms (%)
People in Group quarters - Job Corps and vocational training facilities (%)
People in Group quarters - Other workers' dormitories (%)
People in Group quarters - Crews of maritime vessels (%)
People in Group quarters - Other nonhousehold living situations (%)
People in Group quarters - Other noninstitutional group quarters (%)
Residents speaking English at home (%)
Residents speaking English at home - Born in the United States (%)
Residents speaking English at home - Native, born elsewhere (%)
Residents speaking English at home - Foreign born (%)
Residents speaking Spanish at home (%)
Residents speaking Spanish at home - Born in the United States (%)
Residents speaking Spanish at home - Native, born elsewhere (%)
Residents speaking Spanish at home - Foreign born (%)
Residents speaking other language at home (%)
Residents speaking other language at home - Born in the United States (%)
Residents speaking other language at home - Native, born elsewhere (%)
Residents speaking other language at home - Foreign born (%)
Class of Workers - Employee of private company (%)
Class of Workers - Self-employed in own incorporated business (%)
Class of Workers - Private not-for-profit wage and salary workers (%)
Class of Workers - Local government workers (%)
Class of Workers - State government workers (%)
Class of Workers - Federal government workers (%)
Class of Workers - Self-employed workers in own not incorporated business and Unpaid family workers (%)
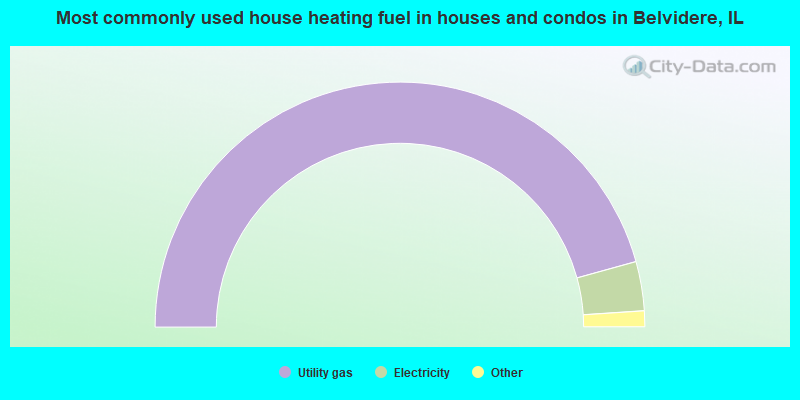
House heating fuel used in houses and condos - Utility gas (%)
House heating fuel used in houses and condos - Bottled, tank, or LP gas (%)
House heating fuel used in houses and condos - Electricity (%)
House heating fuel used in houses and condos - Fuel oil, kerosene, etc. (%)
House heating fuel used in houses and condos - Coal or coke (%)
House heating fuel used in houses and condos - Wood (%)
House heating fuel used in houses and condos - Solar energy (%)
House heating fuel used in houses and condos - Other fuel (%)
House heating fuel used in houses and condos - No fuel used (%)
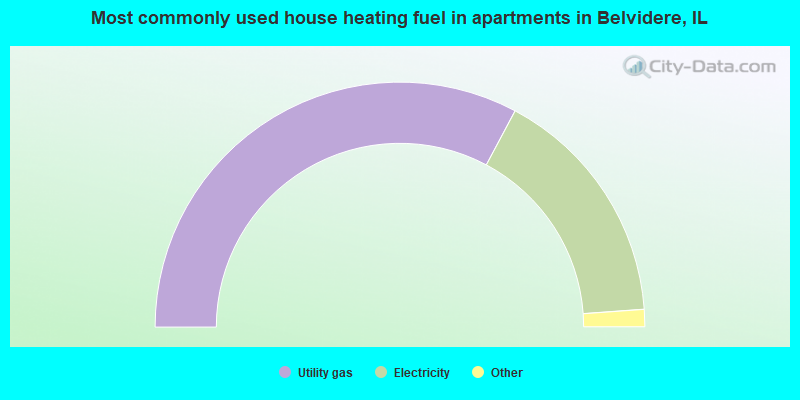
House heating fuel used in apartments - Utility gas (%)
House heating fuel used in apartments - Bottled, tank, or LP gas (%)
House heating fuel used in apartments - Electricity (%)
House heating fuel used in apartments - Fuel oil, kerosene, etc. (%)
House heating fuel used in apartments - Coal or coke (%)
House heating fuel used in apartments - Wood (%)
House heating fuel used in apartments - Solar energy (%)
House heating fuel used in apartments - Other fuel (%)
House heating fuel used in apartments - No fuel used (%)
Armed forces status - In Armed Forces (%)
Armed forces status - Civilian (%)
Armed forces status - Civilian - Veteran (%)
Armed forces status - Civilian - Nonveteran (%)
Fatal accidents locations in years 2005-2021
Fatal accidents locations in 2005
Fatal accidents locations in 2006
Fatal accidents locations in 2007
Fatal accidents locations in 2008
Fatal accidents locations in 2009
Fatal accidents locations in 2010
Fatal accidents locations in 2011
Fatal accidents locations in 2012
Fatal accidents locations in 2013
Fatal accidents locations in 2014
Fatal accidents locations in 2015
Fatal accidents locations in 2016
Fatal accidents locations in 2017
Fatal accidents locations in 2018
Fatal accidents locations in 2019
Fatal accidents locations in 2020
Fatal accidents locations in 2021
Alcohol use - People drinking some alcohol every month (%)
Alcohol use - People not drinking at all (%)
Alcohol use - Average days/month drinking alcohol
Alcohol use - Average drinks/week
Alcohol use - Average days/year people drink much
Audiometry - Average condition of hearing (%)
Audiometry - People that can hear a whisper from across a quiet room (%)
Audiometry - People that can hear normal voice from across a quiet room (%)
Audiometry - Ears ringing, roaring, buzzing (%)
Audiometry - Had a job exposure to loud noise (%)
Audiometry - Had off-work exposure to loud noise (%)
Blood Pressure & Cholesterol - Has high blood pressure (%)
Blood Pressure & Cholesterol - Checking blood pressure at home (%)
Blood Pressure & Cholesterol - Frequently checking blood cholesterol (%)
Blood Pressure & Cholesterol - Has high cholesterol level (%)
Consumer Behavior - Money monthly spent on food at supermarket/grocery store
Consumer Behavior - Money monthly spent on food at other stores
Consumer Behavior - Money monthly spent on eating out
Consumer Behavior - Money monthly spent on carryout/delivered foods
Consumer Behavior - Income spent on food at supermarket/grocery store (%)
Consumer Behavior - Income spent on food at other stores (%)
Consumer Behavior - Income spent on eating out (%)
Consumer Behavior - Income spent on carryout/delivered foods (%)
Current Health Status - General health condition (%)
Current Health Status - Blood donors (%)
Current Health Status - Has blood ever tested for HIV virus (%)
Current Health Status - Left-handed people (%)
Dermatology - People using sunscreen (%)
Diabetes - Diabetics (%)
Diabetes - Had a blood test for high blood sugar (%)
Diabetes - People taking insulin (%)
Diet Behavior & Nutrition - Diet health (%)
Diet Behavior & Nutrition - Milk product consumption (# of products/month)
Diet Behavior & Nutrition - Meals not home prepared (#/week)
Diet Behavior & Nutrition - Meals from fast food or pizza place (#/week)
Diet Behavior & Nutrition - Ready-to-eat foods (#/month)
Diet Behavior & Nutrition - Frozen meals/pizza (#/month)
Drug Use - People that ever used marijuana or hashish (%)
Drug Use - Ever used hard drugs (%)
Drug Use - Ever used any form of cocaine (%)
Drug Use - Ever used heroin (%)
Drug Use - Ever used methamphetamine (%)
Health Insurance - People covered by health insurance (%)
Kidney Conditions-Urology - Avg. # of times urinating at night
Medical Conditions - People with asthma (%)
Medical Conditions - People with anemia (%)
Medical Conditions - People with psoriasis (%)
Medical Conditions - People with overweight (%)
Medical Conditions - Elderly people having difficulties in thinking or remembering (%)
Medical Conditions - People who ever received blood transfusion (%)
Medical Conditions - People having trouble seeing even with glass/contacts (%)
Medical Conditions - People with arthritis (%)
Medical Conditions - People with gout (%)
Medical Conditions - People with congestive heart failure (%)
Medical Conditions - People with coronary heart disease (%)
Medical Conditions - People with angina pectoris (%)
Medical Conditions - People who ever had heart attack (%)
Medical Conditions - People who ever had stroke (%)
Medical Conditions - People with emphysema (%)
Medical Conditions - People with thyroid problem (%)
Medical Conditions - People with chronic bronchitis (%)
Medical Conditions - People with any liver condition (%)
Medical Conditions - People who ever had cancer or malignancy (%)
Mental Health - People who have little interest in doing things (%)
Mental Health - People feeling down, depressed, or hopeless (%)
Mental Health - People who have trouble sleeping or sleeping too much (%)
Mental Health - People feeling tired or having little energy (%)
Mental Health - People with poor appetite or overeating (%)
Mental Health - People feeling bad about themself (%)
Mental Health - People who have trouble concentrating on things (%)
Mental Health - People moving or speaking slowly or too fast (%)
Mental Health - People having thoughts they would be better off dead (%)
Oral Health - Average years since last visit a dentist
Oral Health - People embarrassed because of mouth (%)
Oral Health - People with gum disease (%)
Oral Health - General health of teeth and gums (%)
Oral Health - Average days a week using dental floss/device
Oral Health - Average days a week using mouthwash for dental problem
Oral Health - Average number of teeth
Pesticide Use - Households using pesticides to control insects (%)
Pesticide Use - Households using pesticides to kill weeds (%)
Physical Activity - People doing vigorous-intensity work activities (%)
Physical Activity - People doing moderate-intensity work activities (%)
Physical Activity - People walking or bicycling (%)
Physical Activity - People doing vigorous-intensity recreational activities (%)
Physical Activity - People doing moderate-intensity recreational activities (%)
Physical Activity - Average hours a day doing sedentary activities
Physical Activity - Average hours a day watching TV or videos
Physical Activity - Average hours a day using computer
Physical Functioning - People having limitations keeping them from working (%)
Physical Functioning - People limited in amount of work they can do (%)
Physical Functioning - People that need special equipment to walk (%)
Physical Functioning - People experiencing confusion/memory problems (%)
Physical Functioning - People requiring special healthcare equipment (%)
Prescription Medications - Average number of prescription medicines taking
Preventive Aspirin Use - Adults 40+ taking low-dose aspirin (%)
Reproductive Health - Vaginal deliveries (%)
Reproductive Health - Cesarean deliveries (%)
Reproductive Health - Deliveries resulted in a live birth (%)
Reproductive Health - Pregnancies resulted in a delivery (%)
Reproductive Health - Women breastfeeding newborns (%)
Reproductive Health - Women that had a hysterectomy (%)
Reproductive Health - Women that had both ovaries removed (%)
Reproductive Health - Women that have ever taken birth control pills (%)
Reproductive Health - Women taking birth control pills (%)
Reproductive Health - Women that have ever used Depo-Provera or injectables (%)
Reproductive Health - Women that have ever used female hormones (%)
Sexual Behavior - People 18+ that ever had sex (vaginal, anal, or oral) (%)
Sexual Behavior - Males 18+ that ever had vaginal sex with a woman (%)
Sexual Behavior - Males 18+ that ever performed oral sex on a woman (%)
Sexual Behavior - Males 18+ that ever had anal sex with a woman (%)
Sexual Behavior - Males 18+ that ever had any sex with a man (%)
Sexual Behavior - Females 18+ that ever had vaginal sex with a man (%)
Sexual Behavior - Females 18+ that ever performed oral sex on a man (%)
Sexual Behavior - Females 18+ that ever had anal sex with a man (%)
Sexual Behavior - Females 18+ that ever had any kind of sex with a woman (%)
Sexual Behavior - Average age people first had sex
Sexual Behavior - Average number of female sex partners in lifetime (males 18+)
Sexual Behavior - Average number of female vaginal sex partners in lifetime (males 18+)
Sexual Behavior - Average age people first performed oral sex on a woman (18+)
Sexual Behavior - Average number of woman performed oral sex on in lifetime (18+)
Sexual Behavior - Average number of male sex partners in lifetime (males 18+)
Sexual Behavior - Average number of male anal sex partners in lifetime (males 18+)
Sexual Behavior - Average age people first performed oral sex on a man (18+)
Sexual Behavior - Average number of male oral sex partners in lifetime (18+)
Sexual Behavior - People using protection when performing oral sex (%)
Sexual Behavior - Average number of times people have vaginal or anal sex a year
Sexual Behavior - People having sex without condom (%)
Sexual Behavior - Average number of male sex partners in lifetime (females 18+)
Sexual Behavior - Average number of male vaginal sex partners in lifetime (females 18+)
Sexual Behavior - Average number of female sex partners in lifetime (females 18+)
Sexual Behavior - Circumcised males 18+ (%)
Sleep Disorders - Average hours sleeping at night
Sleep Disorders - People that has trouble sleeping (%)
Smoking-Cigarette Use - People smoking cigarettes (%)
Taste & Smell - People 40+ having problems with smell (%)
Taste & Smell - People 40+ having problems with taste (%)
Taste & Smell - People 40+ that ever had wisdom teeth removed (%)
Taste & Smell - People 40+ that ever had tonsils teeth removed (%)
Taste & Smell - People 40+ that ever had a loss of consciousness because of a head injury (%)
Taste & Smell - People 40+ that ever had a broken nose or other serious injury to face or skull (%)
Taste & Smell - People 40+ that ever had two or more sinus infections (%)
Weight - Average height (inches)
Weight - Average weight (pounds)
Weight - Average BMI
Weight - People that are obese (%)
Weight - People that ever were obese (%)
Weight - People trying to lose weight (%)
Officers per 1,000 residents here:
1.60Illinois average:
2.76
Latest news from Belvidere, IL collected exclusively by city-data.com from local newspapers, TV, and radio stations
Ancestries: German (11.9%), Italian (4.4%), English (3.2%), Irish (3.2%), Norwegian (2.3%), Swedish (2.1%).
Current Local Time:
Incorporated on 05/30/1881
Land area: 9.07 square miles.
Population density: 2,775 people per square mile (average).
4,106 residents are foreign born (14.3% Latin America ).
This city:
16.4%Illinois:
14.1%
Median real estate property taxes paid for housing units with mortgages in 2022: $3,208 (2.0%)Median real estate property taxes paid for housing units with no mortgage in 2022: $2,799 (2.1%)
Nearest city with pop. 50,000+: Rockford, IL
Nearest city with pop. 200,000+: Madison, WI
Nearest city with pop. 1,000,000+: Chicago, IL
Nearest cities:
Caledonia, IL (2.9 miles),
Latitude: 42.25 N, Longitude: 88.84 W
Daytime population change due to commuting: -864 (-3.5%)Workers who live and work in this city: 4,449 (35.8%)
Single-family new house construction building permits:
2022: 103 buildings , average cost: $160,7002021: 61 buildings , average cost: $153,4002020: 6 buildings , average cost: $117,8002019: 9 buildings , average cost: $115,2002018: 7 buildings , average cost: $99,3002017: 14 buildings , average cost: $99,4002016: 8 buildings , average cost: $157,9002014: 5 buildings , average cost: $157,9002013: 12 buildings , average cost: $291,5002012: 21 buildings , average cost: $117,4002011: 4 buildings , average cost: $117,3002010: 8 buildings , average cost: $138,0002009: 12 buildings , average cost: $260,1002008: 14 buildings , average cost: $252,7002007: 106 buildings , average cost: $204,9002006: 196 buildings , average cost: $189,0002005: 200 buildings , average cost: $143,0002004: 202 buildings , average cost: $130,3002003: 171 buildings , average cost: $146,7002002: 160 buildings , average cost: $125,6002001: 232 buildings , average cost: $116,4002000: 152 buildings , average cost: $121,5001999: 169 buildings , average cost: $106,5001998: 95 buildings , average cost: $105,6001997: 80 buildings , average cost: $96,700Unemployment in December 2023:
Population change in the 1990s: +4,919 (+30.9%).
Most common occupations in Belvidere, IL (%)
Both Males Females
Metal workers and plastic workers (7.1%)
Other production occupations, including supervisors (7.0%)
Assemblers and fabricators (6.1%)
Material recording, scheduling, dispatching, and distributing workers (4.4%)
Laborers and material movers, hand (4.1%)
Building and grounds cleaning and maintenance occupations (3.7%)
Other office and administrative support workers, including supervisors (3.3%)
Metal workers and plastic workers (10.9%)
Other production occupations, including supervisors (8.4%)
Assemblers and fabricators (5.9%)
Laborers and material movers, hand (5.5%)
Electrical equipment mechanics and other installation, maintenance, and repair workers, including supervisors (4.9%)
Driver/sales workers and truck drivers (4.9%)
Vehicle and mobile equipment mechanics, installers, and repairers (4.3%)
Assemblers and fabricators (6.3%)
Other office and administrative support workers, including supervisors (6.3%)
Other production occupations, including supervisors (5.4%)
Material recording, scheduling, dispatching, and distributing workers (5.2%)
Cashiers (5.2%)
Secretaries and administrative assistants (4.7%)
Information and record clerks, except customer service representatives (4.0%)
Air pollution and air quality trends(lower is better)
AQI Ozone PM2.5
Tornado activity:
Belvidere-area historical tornado activity is slightly below Illinois state average. It is 48% greater than the overall U.S. average.
On 4/21/1967, a category F4 (max. wind speeds 207-260 mph) tornado 4.6 miles away from the Belvidere city center killed 24 people and injured 450 people and caused between $50,000 and $500,000 in damages.
On 4/11/1965, a category F4 tornado 23.9 miles away from the city center killed 6 people and injured 75 people .
Earthquake activity:
Belvidere-area historical earthquake activity is significantly above Illinois state average. It is 51% greater than the overall U.S. average. On 4/18/2008 at 09:36:59, a magnitude 5.4 (5.1 MB, 4.8 MS, 5.4 MW, 5.2 MW, Class: Moderate, Intensity: VI - VII) earthquake occurred 267.8 miles away from the city center On 6/28/2004 at 06:10:52, a magnitude 4.2 (4.2 MW, Depth: 6.2 mi, Class: Light, Intensity: IV - V) earthquake occurred 55.0 miles away from Belvidere center On 6/10/1987 at 23:48:54, a magnitude 5.1 (4.9 MB, 4.4 MS, 4.6 MS, 5.1 LG) earthquake occurred 242.8 miles away from Belvidere center On 4/18/2008 at 09:36:59, a magnitude 5.2 (5.2 MW, Depth: 8.9 mi) earthquake occurred 267.9 miles away from Belvidere center On 2/10/2010 at 09:59:35, a magnitude 3.8 (3.8 MW, Depth: 6.2 mi, Class: Light, Intensity: II - III) earthquake occurred 26.6 miles away from the city center On 6/18/2002 at 17:37:15, a magnitude 5.0 (4.3 MB, 4.6 MW, 5.0 LG) earthquake occurred 300.5 miles away from the city center Magnitude types: regional Lg-wave magnitude (LG), body-wave magnitude (MB), surface-wave magnitude (MS), moment magnitude (MW) Natural disasters: The number of natural disasters in Boone County (10) is smaller than the US average (15).Major Disasters (Presidential) Declared: 4Emergencies Declared: 5Floods: 2, Snows: 2, Snowstorms: 2, Storms: 2, Winter Storms: 2, Blizzard: 1, Hurricane: 1, Tornado: 1, Other: 1 (Note: some incidents may be assigned to more than one category). Hospitals and medical centers in Belvidere: NORTHWEST SUBURBAN COMMUNITY HOSPITAL (1625 S STATE ST) SAINT JOSEPH HOSPITAL (1005 JULIEN ST) HOME BRIDGE CENTER (1701 WEST 5TH AVENUE)
MAPLE CREST CARE CENTRE (4452 SQUAW PRAIRIE ROAD)
NORTHWOODS CARE CENTRE (2250 PEARL STREET)
SAINT JOSEPH HOSPITAL SKILLED CR UNIT (1005 JULIEN ST)
Amtrak stations near Belvidere: 8 miles: ROCKFORD (7559 WALTON ST.) - Bus Station Services: enclosed waiting area, public restrooms, public payphones, paid short-term parking, paid long-term parking, call for taxi service.
20 miles: BELOIT (HWY. 75 & HWY. 51) - Bus Station Services: call for taxi service.
Colleges/universities with over 2000 students nearest to Belvidere:
Rock Valley College (about 9 miles; Rockford, IL ; Full-time enrollment: 6,269)
Kishwaukee College (about 22 miles; Malta, IL ; FT enrollment: 3,356)
Northern Illinois University (about 23 miles; Dekalb, IL ; FT enrollment: 18,126)
McHenry County College (about 25 miles; Crystal Lake, IL ; FT enrollment: 4,886)
Elgin Community College (about 32 miles; Elgin, IL ; FT enrollment: 8,173)
Waubonsee Community College (about 38 miles; Sugar Grove, IL ; FT enrollment: 7,698)
University of Wisconsin-Whitewater (about 41 miles; Whitewater, WI ; FT enrollment: 11,124)
Public high schools in Belvidere: BELVIDERE HIGH SCHOOL Students: 1,337, Location: 1500 EAST AVE, Grades: 9-12)BELVIDERE NORTH HIGH SCH Students: 1,289, Location: 9393 BELOIT RD, Grades: 9-12)REG'L LEARNING CENTER STAR BOONE Location: 1320 EAST AVE, Grades: 9-12)
REGL LEARNING ACADEMY STAR BOONE Location: 1320 EAST AVE, Grades: 6-12)
Public elementary/middle schools in Belvidere: BELVIDERE CENTRAL MIDDLE SCHOOL Students: 1,144, Location: 8787 BELOIT RD, Grades: 6-8)WASHINGTON ACADEMY Students: 1,131, Location: 1031 5TH AVE, Grades: PK-8)BELVIDERE SOUTH MIDDLE SCHOOL Students: 966, Location: 919 E 6TH ST, Grades: 6-8)SETH WHITMAN ELEM SCH Students: 705, Location: 8989 BELOIT RD, Grades: KG-5)MEEHAN ELEMENTARY SCHOOL Students: 654, Location: 1401 E 6TH ST, Grades: KG-5)LINCOLN ELEM SCHOOL Location: 1011 BONUS AVE, Grades: KG-5)
PERRY ELEM SCHOOL Location: 633 W PERRY ST, Grades: KG-5)
Private elementary/middle schools in Belvidere: IMMANUEL LUTHERAN SCHOOL Students: 303, Location: 1225 E 2ND ST, Grades: PK-8)
ST JAMES SCHOOL Students: 173, Location: 320 LOGAN AVE, Grades: PK-8)
OPEN BIBLE ACADEMY Students: 36, Location: 8567 TOWN HALL RD, Grades: PK-4)
See full list of schools located in Belvidere Library in Belvidere: IDA PUBLIC LIBRARY Operating income: $727,397; Location: 320 NORTH STATE STREET; 82,049 books ; 5,957 e-books ; 2,705 audio materials ; 4,818 video materials ; 2 local licensed databases ; 16 state licensed databases ; 1 other licensed databases ; 267 print serial subscriptions )
Notable locations in Belvidere: (A) , Boone County Rural Fire Protection District 2 Station 1 (B) , Belvidere Fire Department Station 2 (C) , Belvidere Fire Department Station 1 Headquarters (D) , Ida Public Library (E) , Boone County Courthouse (F) , Belvidere City Hall (G) , Lifeline Ambulance Service - Boone County Fire District 2 (H) . Display/hide their locations on the map
Churches in Belvidere include: (A) , First Presbyterian Church (B) , Immanuel Evangelical Lutheran Church (C) , Mission Covenant Church (D) , Pettit Memorial Chapel (E) , Saint James Roman Catholic Church (F) , Saint Johns Evangelical Church (G) , Trinity Episcopal Church (H) , Zion Evangelical Lutheran Church (I) . Display/hide their locations on the map
Cemetery: (1) . Display/hide its location on the map
Parks in Belvidere include: (1) , Spencer Park (2) . Display/hide their locations on the map
Tourist attractions: (1) , Concordia Lanes Limited (Amusement & Theme Parks; 1205 Logan Avenue) (2) . Display/hide their approximate locations on the map
Hotels: (1) , Cambridge Inn (1605 North State Street) (2) , Budget Inn (1345 North State Street) (3) . Display/hide their approximate locations on the map
Courts: (1) , Boone County - Court Reporter (601 North Main Street) (2) , Boone County - Circuit Court Clerk (601 North Main Street) (3) . Display/hide their approximate locations on the map
Birthplace of: Horace Mann Towner - Politician, Joe Charboneau - Baseball player, Kasey James - Profesional wrestler, Damon M. Cummings - Soilder, Frank Bishop (baseball) - Baseball player, Fred Schulte - Baseball player, Jack D. Franks - Politician, Ronald A. Wait - Politician.
Boone County has a predicted average indoor radon screening level greater than 4 pCi/L (pico curies per liter) - Highest Potential Drinking water stations with addresses in Belvidere and their reported violations in the past:
BELVIDERE (Address: 401 WHITNEY BLVD. Population served: 23,500, Groundwater):
Past monitoring violations:
One regular monitoring violation
Population served: 140, Groundwater):
Past monitoring violations:
One regular monitoring violation
Population served: 25, Groundwater):
Past monitoring violations:
One regular monitoring violation
Drinking water stations with addresses in Belvidere that have no violations reported:
NEDS RESTAURANT (Population served: 240, Primary Water Source Type: Groundwater)
SWAN HILLS GOLF COURSE (Population served: 125, Primary Water Source Type: Groundwater)
FARM & FLEET OF BELVIDERE (Population served: 100, Primary Water Source Type: Groundwater)
SPENCER PARK (106211) (Population served: 25, Primary Water Source Type: Groundwater)
Average household size: This city:
2.9 peopleIllinois:
2.6 people
Percentage of family households: This city:
71.4%Whole state:
65.8%
Percentage of households with unmarried partners: This city:
7.6%Whole state:
6.3%
Likely homosexual households (counted as self-reported same-sex unmarried-partner households)
Lesbian couples: 0.3% of all households Gay men: 0.2% of all households
People in group quarters in Belvidere in 2010:
150 people in nursing facilities/skilled-nursing facilities
71 people in local jails and other municipal confinement facilities
9 people in other noninstitutional facilities
People in group quarters in Belvidere in 2000:
182 people in nursing homes
53 people in local jails and other confinement facilities (including police lockups)
8 people in homes for the mentally retarded
2 people in other noninstitutional group quarters
Banks with branches in Belvidere (2011 data):
Alpine Bank & Trust Co.: Logan Avenue Facility, North State Street Drive-Up Facility, Belvidere Office, Gateway Center Branch, Bucs Branch, Blue Thunder Branch. Info updated 2009/07/22: Bank assets: $1,039.0 mil, Deposits: $928.9 mil, headquarters in Rockford, IL, positive income , Commercial Lending Specialization, 19 total offices , Holding Company: Alpine Bancorporation, Inc.
PNC Bank, National Association: Belvidere Motor Branch at 1004 North State Street, branch established on 1974/11/05; Belvidere Facility at 130 South State Street, branch established on 1884/01/01. Info updated 2012/03/20: Bank assets: $263,309.6 mil, Deposits: $197,343.0 mil, headquarters in Wilmington, DE, positive income , Commercial Lending Specialization, 3085 total offices , Holding Company: Pnc Financial Services Group, Inc., The
BMO Harris Bank National Association: Pacemaker Supermarket Branch at 401 Southtowne Drive, branch established on 1995/04/03; Belvidere Branch at 782 Beloit Road, branch established on 2006/03/20. Info updated 2011/07/14: Bank assets: $97,264.0 mil, Deposits: $75,624.6 mil, headquarters in Chicago, IL, positive income , 717 total offices , Holding Company: Bank Of Montreal
First National Bank of Omaha: Belvidere Branch at 1725 South State Street, branch established on 2007/08/13. Info updated 2010/10/13: Bank assets: $13,433.1 mil, Deposits: $10,746.6 mil, headquarters in Omaha, NE, positive income , Commercial Lending Specialization, 102 total offices , Holding Company: Lauritzen Corporation
Blackhawk Bank: Belvidere Branch at 2141 North State Street, branch established on 1993/10/12. Info updated 2011/08/25: Bank assets: $558.2 mil, Deposits: $476.1 mil, headquarters in Beloit, WI, positive income , Commercial Lending Specialization, 8 total offices , Holding Company: Blackhawk Bancorp, Inc.
Union Savings Bank: 1320 North State Street Branch at 1320 North State Street, branch established on 1987/06/30. Info updated 2006/11/03: Bank assets: $170.5 mil, Deposits: $145.7 mil, headquarters in Freeport, IL, positive income , 5 total offices , Holding Company: Union Bancshares, Mhc
For population 15 years and over in Belvidere:
Never married: 37.0%Now married: 41.3%Separated: 2.0%Widowed: 6.9%Divorced: 12.9% For population 25 years and over in Belvidere:
High school or higher: 77.2%Bachelor's degree or higher: 12.4%Graduate or professional degree: 4.4%Unemployed: 5.6%Mean travel time to work (commute): 21.3 minutes
Education Gini index (Inequality in education) Here:
16.4Illinois average:
12.5
Religion statistics for Belvidere, IL (based on Boone County data)
Religion Adherents Congregations Catholic 10,420 1 Mainline Protestant 5,824 16 Evangelical Protestant 4,054 19 Other 254 2 None 33,613 -
Source: Clifford Grammich, Kirk Hadaway, Richard Houseal, Dale E.Jones, Alexei Krindatch, Richie Stanley and Richard H.Taylor. 2012. 2010 U.S.Religion Census: Religious Congregations & Membership Study. Association of Statisticians of American Religious Bodies. Jones, Dale E., et al. 2002. Congregations and Membership in the United States 2000. Nashville, TN: Glenmary Research Center. Graphs represent county-level data
Food Environment Statistics: Number of grocery stores : 7This county :
1.31 / 10,000 pop.Illinois :
2.24 / 10,000 pop.
Number of convenience stores (no gas) : 3Here :
0.56 / 10,000 pop.Illinois :
0.75 / 10,000 pop.
Number of convenience stores (with gas) : 17This county :
3.19 / 10,000 pop.Illinois :
2.61 / 10,000 pop.
Number of full-service restaurants : 26Here :
4.88 / 10,000 pop.Illinois :
6.86 / 10,000 pop.
Low-income preschool obesity rate : Boone County :
19.4%Illinois :
14.5%
Health and Nutrition: Healthy diet rate : Belvidere:
46.5%Illinois:
49.5%
Average overall health of teeth and gums : This city:
43.1%Illinois:
47.2%
Average BMI : Belvidere:
28.7Illinois:
28.6
People feeling badly about themselves : People not drinking alcohol at all : This city:
10.8%State:
10.8%
Average hours sleeping at night : Belvidere:
6.8Illinois:
6.8
Overweight people : Belvidere:
32.5%Illinois:
33.4%
General health condition : This city:
53.9%Illinois:
56.4%
Average condition of hearing : Belvidere:
78.2%Illinois:
79.9%
More about Health and Nutrition of Belvidere, IL Residents
Local government employment and payroll (March 2022)
Function
Full-time employees
Monthly full-time payroll
Average yearly full-time wage
Part-time employees
Monthly part-time payroll
Police Protection - Officers
42 $315,827 $90,236 0 $0 Firefighters
29 $231,880 $95,950 0 $0 Water Supply
12 $72,866 $72,866 0 $0 Streets and Highways
11 $69,732 $76,071 0 $0 Local Libraries
8 $26,769 $40,154 15 $13,721 Sewerage
7 $20,888 $35,808 0 $0 Other Government Administration
5 $23,803 $57,127 10 $6,049 Police - Other
3 $10,845 $43,380 0 $0 Other and Unallocable
3 $13,915 $55,660 2 $3,100 Financial Administration
1 $7,018 $84,216 1 $465 Fire - Other
1 $2,245 $26,940 0 $0 Judicial and Legal
1 $10,405 $124,860 0 $0
Totals for Government
123 $806,194 $78,653 28 $23,335
Belvidere government finances - Expenditure in 2018 (per resident):
Construction - Water Utilities: $1,884,000 ($74.85)
Housing and Community Development: $75,000 ($2.98)Regular Highways: $23,000 ($0.91)Current Operations - Police Protection: $6,287,000 ($249.79)
Local Fire Protection: $4,068,000 ($161.63)Regular Highways: $3,598,000 ($142.95)Central Staff Services: $2,044,000 ($81.21)Water Utilities: $1,961,000 ($77.91)Sewerage: $1,772,000 ($70.40)General - Other: $1,587,000 ($63.05)Libraries: $725,000 ($28.81)Solid Waste Management: $581,000 ($23.08)Public Welfare - Other: $331,000 ($13.15)Health - Other: $25,000 ($0.99)General - Interest on Debt: $1,324,000 ($52.60)
Other Capital Outlay - Housing and Community Development: $914,000 ($36.31)
Local Fire Protection: $575,000 ($22.85)Water Utilities: $401,000 ($15.93)Police Protection: $158,000 ($6.28)Total Salaries and Wages: $9,724,000 ($386.35)
Belvidere government finances - Revenue in 2018 (per resident):
Charges - Sewerage: $3,543,000 ($140.77)
Other: $1,048,000 ($41.64)Parks and Recreation: $50,000 ($1.99)Miscellaneous - Fines and Forfeits: $1,028,000 ($40.84)
General Revenue - Other: $638,000 ($25.35)Interest Earnings: $143,000 ($5.68)Revenue - Water Utilities: $2,290,000 ($90.98)
State Intergovernmental - General Local Government Support: $6,661,000 ($264.65)
Highways: $682,000 ($27.10)Other: $262,000 ($10.41)Tax - Property: $5,844,000 ($232.19)
Public Utilities Sales: $2,097,000 ($83.32)Other Selective Sales: $731,000 ($29.04)Other License: $337,000 ($13.39)
Belvidere government finances - Debt in 2018 (per resident):
Long Term Debt - Beginning Outstanding - Unspecified Public Purpose: $33,097,000 ($1314.99)
Outstanding Unspecified Public Purpose: $30,214,000 ($1200.44)Retired Unspecified Public Purpose: $3,212,000 ($127.62)Issue, Unspecified Public Purpose: $329,000 ($13.07)
Belvidere government finances - Cash and Securities in 2018 (per resident):
Other Funds - Cash and Securities: $18,269,000 ($725.85)
Businesses in Belvidere, IL
Name Count Name Count
7-Eleven 1 MasterBrand Cabinets 6 ALDI 1 McDonald's 3 Ace Hardware 1 Nike 1 Advance Auto Parts 1 Panda Express 1 Applebee's 1 Penske 1 Arby's 1 Pizza Hut 1 AutoZone 1 RadioShack 1 Burger King 1 SONIC Drive-In 1 Circle K 1 Sears 1 Cricket Wireless 2 Starbucks 2 Curves 1 T-Mobile 2 FedEx 3 Taco Bell 1 H&R Block 1 U-Haul 3 Jones New York 1 U.S. Cellular 2 KFC 1 UPS 6 Kmart 1 Verizon Wireless 1 La-Z-Boy 1 Walgreens 1 Little Caesars Pizza 1 Walmart 1 Long John Silver's 1 YMCA 1
Strongest AM radio stations in Belvidere:
WROK (1440 AM; 5 kW; ROCKFORD, IL; Owner: CUMULUS LICENSING CORP.)
WSCR (670 AM; 50 kW; CHICAGO, IL; Owner: INFINITY BROADCASTING OPERATIONS, INC.)
WGN (720 AM; 50 kW; CHICAGO, IL; Owner: WGN CONTINENTAL BROADCASTING CO.)
WBBM (780 AM; 50 kW; CHICAGO, IL; Owner: INFINITY BROADCASTING OPERATIONS, INC.)
WTMJ (620 AM; 50 kW; MILWAUKEE, WI; Owner: JOURNAL BROADCAST CORPORATION)
WMVP (1000 AM; 50 kW; CHICAGO, IL; Owner: ABC, INC.)
WISN (1130 AM; 50 kW; MILWAUKEE, WI; Owner: CAPSTAR TX LIMITED PARTNERSHIP)
WTJK (1380 AM; 5 kW; SOUTH BELOIT, IL; Owner: GOOD KARMA BROADCASTING, L.L.C.)
WLS (890 AM; 50 kW; CHICAGO, IL; Owner: WLS, INC.)
WYLL (1160 AM; 50 kW; CHICAGO, IL; Owner: SCA LICENSE CORPORATION)
WNVR (1030 AM; 5 kW; VERNON HILLS, IL; Owner: POLNET COMMUNICATIONS, LTD.)
WNTA (1330 AM; 1 kW; ROCKFORD, IL; Owner: AIRPLAY BROADCASTING CORP.)
WAIT (850 AM; daytime; 2 kW; CRYSTAL LAKE, IL; Owner: NM LICENSING, LLC)
Strongest FM radio stations in Belvidere:
WXRX (104.9 FM; BELVIDERE, IL; Owner: AIRPLAY BROADCASTING CORP.)
WGSL (91.1 FM; LOVES PARK, IL; Owner: CHRISTIAN LIFE CENTER SCHOOL)
WQFL (100.9 FM; ROCKFORD, IL; Owner: QUEST FOR LIFE, INC.)
WZOK (97.5 FM; ROCKFORD, IL; Owner: CUMULUS LICENSING CORP.)
WGFB (103.1 FM; ROCKTON, IL; Owner: WRWC, Inc.)
WYCH (106.3 FM; GENOA, IL; Owner: DONTRON, INC.)
WFEN (88.3 FM; ROCKFORD, IL; Owner: FAITH ACADEMY, DBA WFEN)
WKMQ-FM (96.7 FM; LOVES PARK, IL; Owner: CUMULUS LICENSING CORP.)
WYHY (95.3 FM; WINNEBAGO, IL; Owner: AIRPLAY BROADCASTING CORPORATION)
W233AD (94.5 FM; ROCKFORD, IL; Owner: FAMILY STATIONS, INC.)
WNIU (89.5 FM; DEKALB, IL; Owner: NORTHERN ILLINOIS UNIVERSITY)
WZSR (105.5 FM; WOODSTOCK, IL; Owner: NM LICENSING, LLC)
WNIJ (90.5 FM; ROCKFORD, IL; Owner: NORTHERN ILLINOIS UNIVERSITY)
WDEK (92.5 FM; DEKALB, IL; Owner: SPANISH BROADCASTING SYSTEM OF ILLINOIS, INC.)
WDKB (94.9 FM; DEKALB, IL; Owner: DEKALB COUNTY RADIO, LIMITED)
W289AB (105.7 FM; ROCKFORD, IL; Owner: NORTHERN ILLINOIS UNIVERSITY)
W220BL (91.9 FM; ROCKFORD, IL; Owner: PENSACOLA CHRISTIAN COLLEGE, INC.)
TV broadcast stations around Belvidere:
WQFL-CA (Channel 8; ROCKFORD, IL; Owner: FAMILY VALUES ORGANIZATION, INC.)
WCFC-CA (Channel 51; ROCKFORD, IL; Owner: CHRISTIAN COMMUNICATIONS OF CHICAGOLAND, INC.)
WIFR (Channel 23; FREEPORT, IL; Owner: GRAY MIDAMERICA TV LICENSEE CORP.)
WTVO (Channel 17; ROCKFORD, IL; Owner: WINNEBAGO TELEVISION CORPORATION)
WFBN-LP (Channel 33; ROCKFORD, IL; Owner: WEIGEL BROADCASTING COMPANY)
WQRF-TV (Channel 39; ROCKFORD, IL; Owner: QUORUM OF ROCKFORD LICENSE, LLC)
WREX-TV (Channel 13; ROCKFORD, IL; Owner: WREX TELEVISION, LLC)
W34CK (Channel 34; ARLINGTON HEIGHTS, IL; Owner: FIRST UNITED, INC.)
W64CQ (Channel 64; ARLINGTON HEIGHTS, IL; Owner: TRINITY BROADCASTING NETWORK)
W25CL (Channel 25; ROCKFORD, IL; Owner: TRINITY BROADCASTING NETWORK)
National Bridge Inventory (NBI) Statistics 57 Number of bridges705ft / 215m Total length $3,793,000 Total costs831,650 Total average daily traffic200,593 Total average daily truck traffic
New bridges - historical statistics
1 1900-1909 1 1940-1949 8 1950-1959 11 1960-1969 4 1970-1979 7 1980-1989 2 1990-1999 2 2000-2009 20 2010-2019 1 2020-2022
See full National Bridge Inventory statistics for Belvidere, IL
Home Mortgage Disclosure Act Aggregated Statistics For Year 2009(Based on 1 full and 2 partial tracts) A) FHA, FSA/RHS & VA B) Conventional C) Refinancings D) Home Improvement Loans E) Loans on Dwellings For 5+ Families F) Non-occupant Loans on G) Loans On Manufactured Number Average Value Number Average Value Number Average Value Number Average Value Number Average Value Number Average Value Number Average Value
LOANS ORIGINATED 64 $107,180 55 $83,111 374 $113,023 9 $30,931 1 $528,910 34 $85,479 16 $55,250 APPLICATIONS APPROVED, NOT ACCEPTED 5 $94,024 22 $82,079 42 $130,980 4 $9,020 0 $0 3 $71,293 17 $64,353 APPLICATIONS DENIED 22 $105,389 33 $54,377 157 $126,446 12 $23,281 0 $0 6 $76,568 31 $52,100 APPLICATIONS WITHDRAWN 5 $120,390 2 $118,755 97 $123,236 4 $9,790 0 $0 3 $81,557 0 $0 FILES CLOSED FOR INCOMPLETENESS 5 $93,820 2 $106,190 24 $113,115 1 $91,920 0 $0 1 $79,900 1 $28,280
Aggregated Statistics For Year 2008(Based on 1 full and 2 partial tracts) A) FHA, FSA/RHS & VA B) Conventional C) Refinancings D) Home Improvement Loans E) Loans on Dwellings For 5+ Families F) Non-occupant Loans on G) Loans On Manufactured Number Average Value Number Average Value Number Average Value Number Average Value Number Average Value Number Average Value Number Average Value
LOANS ORIGINATED 48 $130,307 88 $112,802 292 $111,046 38 $38,101 2 $253,360 35 $121,500 20 $34,800 APPLICATIONS APPROVED, NOT ACCEPTED 6 $141,547 25 $87,690 49 $120,718 11 $44,727 0 $0 6 $81,295 13 $49,923 APPLICATIONS DENIED 15 $145,978 34 $83,857 241 $133,305 27 $45,454 1 $3,630,960 14 $117,033 26 $50,418 APPLICATIONS WITHDRAWN 6 $129,603 10 $119,545 72 $141,871 2 $15,500 0 $0 6 $96,857 1 $39,000 FILES CLOSED FOR INCOMPLETENESS 2 $119,820 4 $153,632 13 $121,142 1 $39,600 0 $0 2 $86,405 0 $0
Aggregated Statistics For Year 2007(Based on 1 full and 2 partial tracts) A) FHA, FSA/RHS & VA B) Conventional C) Refinancings D) Home Improvement Loans E) Loans on Dwellings For 5+ Families F) Non-occupant Loans on G) Loans On Manufactured Number Average Value Number Average Value Number Average Value Number Average Value Number Average Value Number Average Value Number Average Value
LOANS ORIGINATED 37 $137,116 225 $119,195 339 $109,149 54 $37,717 2 $2,770,770 50 $97,031 26 $45,115 APPLICATIONS APPROVED, NOT ACCEPTED 3 $178,160 47 $104,266 56 $121,117 7 $33,444 0 $0 6 $114,022 21 $70,762 APPLICATIONS DENIED 13 $123,554 75 $98,721 289 $126,615 38 $52,791 0 $0 28 $98,921 22 $52,250 APPLICATIONS WITHDRAWN 4 $153,352 30 $142,370 108 $125,118 3 $159,413 1 $478,000 4 $104,482 0 $0 FILES CLOSED FOR INCOMPLETENESS 1 $128,000 8 $116,896 26 $134,500 2 $87,420 0 $0 1 $138,000 0 $0
Aggregated Statistics For Year 2006(Based on 1 full and 2 partial tracts) A) FHA, FSA/RHS & VA B) Conventional C) Refinancings D) Home Improvement Loans E) Loans on Dwellings For 5+ Families F) Non-occupant Loans on G) Loans On Manufactured Number Average Value Number Average Value Number Average Value Number Average Value Number Average Value Number Average Value Number Average Value
LOANS ORIGINATED 35 $138,705 410 $110,523 403 $107,430 50 $37,386 1 $1,260,050 65 $90,021 37 $47,990 APPLICATIONS APPROVED, NOT ACCEPTED 2 $109,160 74 $107,556 77 $110,026 8 $58,120 0 $0 14 $86,430 23 $43,449 APPLICATIONS DENIED 6 $143,395 150 $85,586 299 $117,170 47 $36,891 1 $106,070 23 $105,481 53 $38,203 APPLICATIONS WITHDRAWN 2 $122,485 63 $130,778 161 $120,679 4 $89,848 1 $161,930 15 $88,767 1 $70,000 FILES CLOSED FOR INCOMPLETENESS 0 $0 18 $94,626 38 $117,802 0 $0 0 $0 0 $0 0 $0
Aggregated Statistics For Year 2005(Based on 1 full and 2 partial tracts) A) FHA, FSA/RHS & VA B) Conventional C) Refinancings D) Home Improvement Loans E) Loans on Dwellings For 5+ Families F) Non-occupant Loans on G) Loans On Manufactured Number Average Value Number Average Value Number Average Value Number Average Value Number Average Value Number Average Value Number Average Value
LOANS ORIGINATED 51 $131,378 464 $99,008 426 $102,805 62 $66,573 1 $571,340 69 $93,903 38 $41,868 APPLICATIONS APPROVED, NOT ACCEPTED 4 $120,395 57 $96,990 72 $114,209 9 $76,558 0 $0 7 $86,474 12 $52,386 APPLICATIONS DENIED 10 $148,111 189 $78,685 398 $117,147 70 $29,068 0 $0 22 $86,910 71 $44,800 APPLICATIONS WITHDRAWN 3 $127,007 53 $105,998 222 $132,989 30 $132,377 0 $0 13 $115,063 0 $0 FILES CLOSED FOR INCOMPLETENESS 3 $156,187 9 $118,066 35 $99,325 2 $110,340 0 $0 2 $105,500 0 $0
Aggregated Statistics For Year 2004(Based on 1 full and 2 partial tracts) A) FHA, FSA/RHS & VA B) Conventional C) Refinancings D) Home Improvement Loans E) Loans on Dwellings For 5+ Families F) Non-occupant Loans on G) Loans On Manufactured Number Average Value Number Average Value Number Average Value Number Average Value Number Average Value Number Average Value Number Average Value
LOANS ORIGINATED 53 $117,597 378 $101,016 453 $103,478 58 $35,858 9 $815,613 77 $100,707 38 $35,210 APPLICATIONS APPROVED, NOT ACCEPTED 2 $100,475 55 $96,698 80 $107,057 3 $54,743 0 $0 4 $98,322 15 $47,131 APPLICATIONS DENIED 13 $127,023 92 $75,459 308 $108,518 68 $30,454 0 $0 17 $82,809 60 $44,394 APPLICATIONS WITHDRAWN 6 $129,983 43 $112,423 207 $114,182 9 $67,327 1 $479,410 10 $73,270 1 $41,000 FILES CLOSED FOR INCOMPLETENESS 2 $153,900 14 $123,291 29 $122,448 1 $28,280 0 $0 3 $95,533 0 $0
Aggregated Statistics For Year 2003(Based on 1 full and 2 partial tracts) A) FHA, FSA/RHS & VA B) Conventional C) Refinancings D) Home Improvement Loans E) Loans on Dwellings For 5+ Families F) Non-occupant Loans on Number Average Value Number Average Value Number Average Value Number Average Value Number Average Value Number Average Value
LOANS ORIGINATED 93 $118,024 359 $103,711 896 $93,960 45 $16,912 2 $356,875 87 $76,347 APPLICATIONS APPROVED, NOT ACCEPTED 11 $126,906 38 $106,984 93 $101,676 1 $2,000 0 $0 4 $75,420 APPLICATIONS DENIED 6 $113,040 112 $72,876 286 $95,379 50 $22,632 0 $0 18 $101,101 APPLICATIONS WITHDRAWN 11 $112,214 39 $100,383 153 $99,379 2 $18,640 0 $0 4 $74,235 FILES CLOSED FOR INCOMPLETENESS 7 $115,687 7 $151,063 40 $108,953 2 $23,775 0 $0 1 $99,000
Aggregated Statistics For Year 2002(Based on 1 full and 2 partial tracts) A) FHA, FSA/RHS & VA B) Conventional C) Refinancings D) Home Improvement Loans E) Loans on Dwellings For 5+ Families F) Non-occupant Loans on Number Average Value Number Average Value Number Average Value Number Average Value Number Average Value Number Average Value
LOANS ORIGINATED 124 $112,449 291 $95,570 642 $90,316 33 $18,401 5 $1,305,240 63 $76,481 APPLICATIONS APPROVED, NOT ACCEPTED 8 $117,574 44 $68,713 60 $89,732 7 $22,983 0 $0 3 $56,123 APPLICATIONS DENIED 4 $114,955 98 $60,433 211 $82,357 25 $15,854 0 $0 7 $108,970 APPLICATIONS WITHDRAWN 3 $112,970 16 $83,487 110 $94,148 0 $0 0 $0 5 $66,070 FILES CLOSED FOR INCOMPLETENESS 1 $113,790 10 $104,701 29 $104,103 1 $12,000 0 $0 0 $0
Aggregated Statistics For Year 2001(Based on 1 full and 2 partial tracts) A) FHA, FSA/RHS & VA B) Conventional C) Refinancings D) Home Improvement Loans E) Loans on Dwellings For 5+ Families F) Non-occupant Loans on Number Average Value Number Average Value Number Average Value Number Average Value Number Average Value Number Average Value
LOANS ORIGINATED 98 $102,192 248 $95,145 635 $83,985 68 $20,034 4 $643,535 52 $73,408 APPLICATIONS APPROVED, NOT ACCEPTED 2 $61,645 19 $80,692 66 $77,496 11 $21,784 0 $0 1 $65,760 APPLICATIONS DENIED 11 $109,926 116 $47,446 224 $72,256 35 $14,289 0 $0 4 $48,928 APPLICATIONS WITHDRAWN 7 $121,157 15 $104,312 124 $87,463 7 $38,947 0 $0 2 $49,925 FILES CLOSED FOR INCOMPLETENESS 4 $109,120 3 $139,173 22 $96,902 2 $10,305 0 $0 0 $0
Aggregated Statistics For Year 2000(Based on 1 full and 2 partial tracts) A) FHA, FSA/RHS & VA B) Conventional C) Refinancings D) Home Improvement Loans E) Loans on Dwellings For 5+ Families F) Non-occupant Loans on Number Average Value Number Average Value Number Average Value Number Average Value Number Average Value Number Average Value
LOANS ORIGINATED 112 $98,588 251 $95,179 177 $81,026 68 $15,022 1 $910,300 24 $68,464 APPLICATIONS APPROVED, NOT ACCEPTED 8 $94,961 28 $55,543 38 $66,547 18 $18,578 2 $381,605 5 $57,518 APPLICATIONS DENIED 12 $91,482 92 $48,689 138 $66,487 43 $21,983 0 $0 6 $36,897 APPLICATIONS WITHDRAWN 6 $92,732 16 $80,841 86 $76,684 8 $20,250 0 $0 1 $42,550 FILES CLOSED FOR INCOMPLETENESS 2 $98,500 5 $78,358 38 $88,137 0 $0 0 $0 3 $52,333
Aggregated Statistics For Year 1999(Based on 1 full and 2 partial tracts) A) FHA, FSA/RHS & VA B) Conventional C) Refinancings D) Home Improvement Loans E) Loans on Dwellings For 5+ Families F) Non-occupant Loans on Number Average Value Number Average Value Number Average Value Number Average Value Number Average Value Number Average Value
LOANS ORIGINATED 122 $94,186 200 $84,683 274 $73,490 63 $15,670 1 $882,620 36 $65,826 APPLICATIONS APPROVED, NOT ACCEPTED 6 $84,883 34 $73,305 58 $64,076 14 $20,466 0 $0 2 $87,910 APPLICATIONS DENIED 9 $98,653 66 $46,771 168 $71,984 55 $17,359 0 $0 6 $52,048 APPLICATIONS WITHDRAWN 7 $90,481 19 $84,339 159 $74,837 9 $25,889 0 $0 5 $71,750 FILES CLOSED FOR INCOMPLETENESS 2 $87,105 3 $91,243 47 $104,678 3 $17,327 0 $0 6 $80,332
Detailed HMDA statistics for the following Tracts:
0101.00
, 0102.00 , 0103.00
Private Mortgage Insurance Companies Aggregated Statistics For Year 2009(Based on 1 full and 2 partial tracts) A) Conventional B) Refinancings Number Average Value Number Average Value
LOANS ORIGINATED 10 $120,540 15 $139,547 APPLICATIONS APPROVED, NOT ACCEPTED 4 $122,765 8 $139,046 APPLICATIONS DENIED 2 $204,910 3 $119,380 APPLICATIONS WITHDRAWN 1 $79,200 1 $111,010 FILES CLOSED FOR INCOMPLETENESS 0 $0 0 $0
Aggregated Statistics For Year 2008(Based on 1 full and 2 partial tracts) A) Conventional B) Refinancings C) Non-occupant Loans on Number Average Value Number Average Value Number Average Value
LOANS ORIGINATED 31 $125,093 22 $140,763 4 $114,385 APPLICATIONS APPROVED, NOT ACCEPTED 14 $159,534 11 $131,604 2 $94,940 APPLICATIONS DENIED 2 $192,695 2 $126,430 0 $0 APPLICATIONS WITHDRAWN 1 $104,540 0 $0 0 $0 FILES CLOSED FOR INCOMPLETENESS 0 $0 1 $82,730 0 $0
Aggregated Statistics For Year 2007(Based on 1 full and 2 partial tracts) A) Conventional B) Refinancings C) Non-occupant Loans on Number Average Value Number Average Value Number Average Value
LOANS ORIGINATED 91 $140,537 44 $146,190 7 $130,130 APPLICATIONS APPROVED, NOT ACCEPTED 13 $149,660 11 $129,145 1 $123,740 APPLICATIONS DENIED 5 $104,356 1 $135,000 1 $135,000 APPLICATIONS WITHDRAWN 4 $188,158 2 $95,395 0 $0 FILES CLOSED FOR INCOMPLETENESS 0 $0 0 $0 0 $0
Aggregated Statistics For Year 2006(Based on 1 full and 2 partial tracts) A) Conventional B) Refinancings C) Non-occupant Loans on Number Average Value Number Average Value Number Average Value
LOANS ORIGINATED 100 $138,476 34 $134,353 9 $95,080 APPLICATIONS APPROVED, NOT ACCEPTED 7 $129,870 10 $122,534 0 $0 APPLICATIONS DENIED 0 $0 0 $0 0 $0 APPLICATIONS WITHDRAWN 3 $127,130 0 $0 0 $0 FILES CLOSED FOR INCOMPLETENESS 0 $0 0 $0 0 $0
Aggregated Statistics For Year 2005(Based on 1 full and 2 partial tracts) A) Conventional B) Refinancings C) Non-occupant Loans on Number Average Value Number Average Value Number Average Value
LOANS ORIGINATED 80 $128,803 39 $138,814 5 $114,226 APPLICATIONS APPROVED, NOT ACCEPTED 11 $124,329 7 $121,823 0 $0 APPLICATIONS DENIED 3 $145,867 0 $0 0 $0 APPLICATIONS WITHDRAWN 7 $145,004 2 $136,085 0 $0 FILES CLOSED FOR INCOMPLETENESS 1 $173,950 0 $0 0 $0
Aggregated Statistics For Year 2004(Based on 1 full and 2 partial tracts) A) Conventional B) Refinancings C) Non-occupant Loans on Number Average Value Number Average Value Number Average Value
LOANS ORIGINATED 108 $123,167 51 $120,119 9 $98,490 APPLICATIONS APPROVED, NOT ACCEPTED 11 $119,278 17 $120,418 3 $79,057 APPLICATIONS DENIED 3 $136,467 1 $110,000 1 $110,000 APPLICATIONS WITHDRAWN 4 $110,772 3 $114,377 0 $0 FILES CLOSED FOR INCOMPLETENESS 0 $0 0 $0 0 $0
Aggregated Statistics For Year 2003(Based on 1 full and 2 partial tracts) A) Conventional B) Refinancings C) Non-occupant Loans on Number Average Value Number Average Value Number Average Value
LOANS ORIGINATED 122 $123,494 140 $115,644 13 $87,988 APPLICATIONS APPROVED, NOT ACCEPTED 18 $115,005 24 $112,103 2 $138,305 APPLICATIONS DENIED 0 $0 2 $155,600 0 $0 APPLICATIONS WITHDRAWN 4 $91,878 4 $107,785 0 $0 FILES CLOSED FOR INCOMPLETENESS 1 $149,910 2 $92,300 0 $0
Aggregated Statistics For Year 2002(Based on 1 full and 2 partial tracts) A) Conventional B) Refinancings C) Non-occupant Loans on Number Average Value Number Average Value Number Average Value
LOANS ORIGINATED 116 $120,770 131 $111,327 6 $85,608 APPLICATIONS APPROVED, NOT ACCEPTED 12 $116,966 13 $91,492 0 $0 APPLICATIONS DENIED 1 $48,080 0 $0 0 $0 APPLICATIONS WITHDRAWN 4 $124,178 4 $118,930 1 $90,000 FILES CLOSED FOR INCOMPLETENESS 0 $0 0 $0 0 $0
Aggregated Statistics For Year 2001(Based on 1 full and 2 partial tracts) A) Conventional B) Refinancings C) Non-occupant Loans on Number Average Value Number Average Value Number Average Value
LOANS ORIGINATED 90 $117,724 119 $100,043 7 $74,764 APPLICATIONS APPROVED, NOT ACCEPTED 10 $129,454 14 $98,663 1 $35,000 APPLICATIONS DENIED 2 $117,140 1 $79,000 0 $0 APPLICATIONS WITHDRAWN 5 $122,414 3 $89,363 0 $0 FILES CLOSED FOR INCOMPLETENESS 0 $0 1 $81,410 0 $0
Aggregated Statistics For Year 2000(Based on 1 full and 2 partial tracts) A) Conventional B) Refinancings C) Non-occupant Loans on Number Average Value Number Average Value Number Average Value
LOANS ORIGINATED 67 $103,254 23 $92,726 2 $74,470 APPLICATIONS APPROVED, NOT ACCEPTED 8 $91,261 3 $85,000 0 $0 APPLICATIONS DENIED 3 $110,000 1 $79,200 0 $0 APPLICATIONS WITHDRAWN 1 $67,530 0 $0 0 $0 FILES CLOSED FOR INCOMPLETENESS 1 $142,830 0 $0 0 $0
Aggregated Statistics For Year 1999(Based on 1 full and 2 partial tracts) A) Conventional B) Refinancings C) Non-occupant Loans on Number Average Value Number Average Value Number Average Value
LOANS ORIGINATED 74 $92,173 41 $88,423 1 $65,670 APPLICATIONS APPROVED, NOT ACCEPTED 6 $82,370 4 $87,448 0 $0 APPLICATIONS DENIED 2 $69,160 1 $123,570 0 $0 APPLICATIONS WITHDRAWN 0 $0 1 $91,690 0 $0 FILES CLOSED FOR INCOMPLETENESS 0 $0 0 $0 0 $0
Detailed PMIC statistics for the following Tracts:
0101.00
, 0102.00 , 0103.00
Most common first names in Belvidere, IL among deceased individuals Name Count Lived (average)
Robert 144 74.9 years William 134 73.8 years John 125 74.6 years Mary 111 79.4 years George 99 78.7 years Charles 93 75.7 years Helen 85 83.6 years James 80 68.0 years Dorothy 75 78.1 years Harold 68 75.8 years
Most common last names in Belvidere, IL among deceased individuals Last name Count Lived (average)
Johnson 103 78.3 years Smith 78 77.7 years Anderson 61 74.2 years Nelson 52 77.9 years Peterson 45 76.9 years Larson 36 79.9 years Swanson 30 74.4 years Jones 28 75.0 years Miller 24 78.5 years Schwebke 24 80.5 years
Belvidere compared to Illinois state average:
Median house value below state average. Unemployed percentage below state average. Black race population percentage significantly below state average. Hispanic race population percentage above state average. Median age below state average. Length of stay since moving in above state average. Percentage of population with a bachelor's degree or higher below state average.
#34 on the list of "Top 101 cities with the smallest racial income disparities between White and Black householders (with at least 200 householders)"
#91 on the list of "Top 101 cities with the most residents born in Other South America (population 500+)"
#97 on the list of "Top 101 cities with largest percentage of males in industries: manufacturing (population 5,000+)"
#100 on the list of "Top 101 cities with largest percentage of males in occupations: production occupations (population 5,000+)"
Top Patent Applicants
David S. Behling (19)
Scott Trenhaile (14)
James Z. Liu (12)
Adam Michael White (11)
Adam M. White (10)
Timothy Michael Mayer (6)
Joseph A. Binka (5)
Michael N. Kloos (5)
George W. Knoll (4)
Don Peterson (4)
Total of 185 patent applications in 2008-2024.


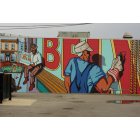

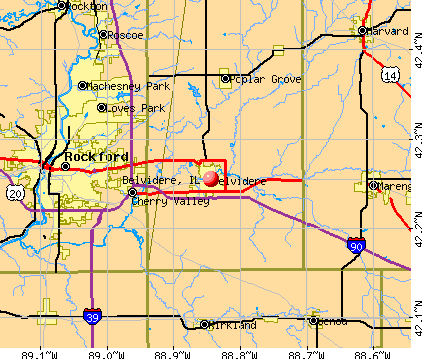


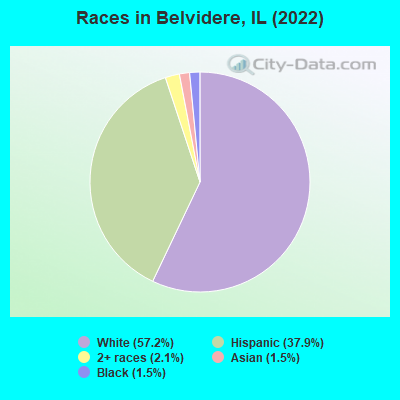
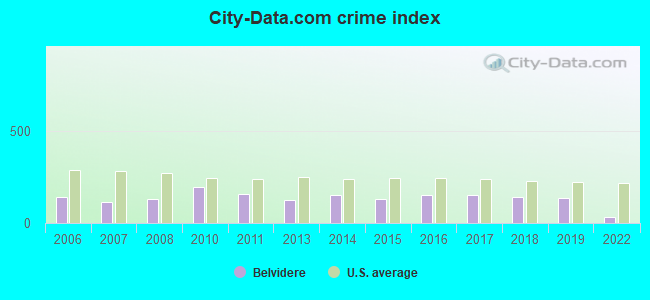
 Recent articles from our blog. Our writers, many of them Ph.D. graduates or candidates, create easy-to-read articles on a wide variety of topics.

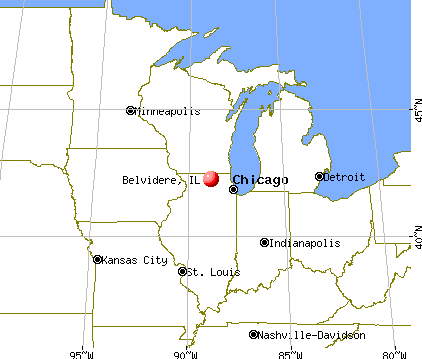
 (11.6 miles
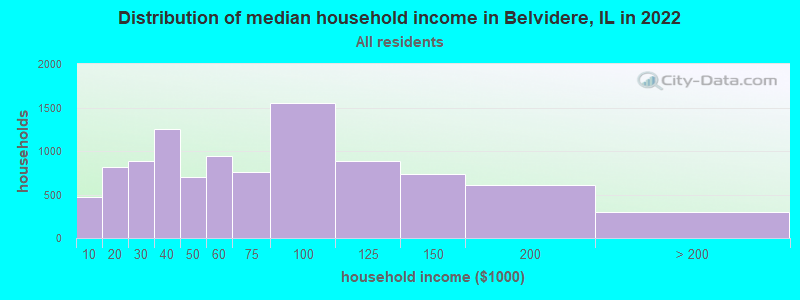
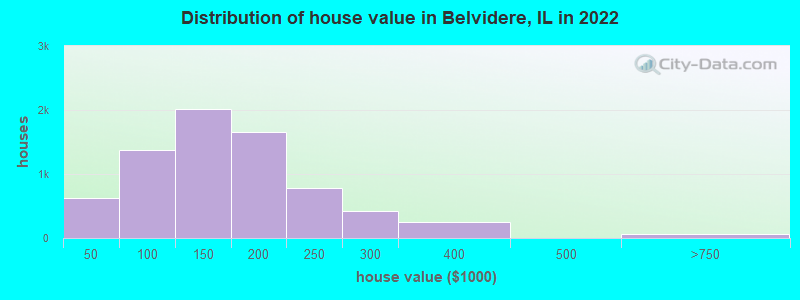
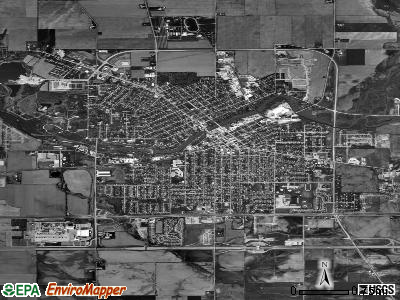
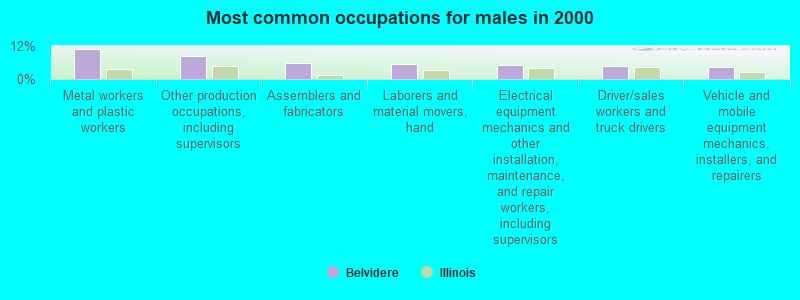
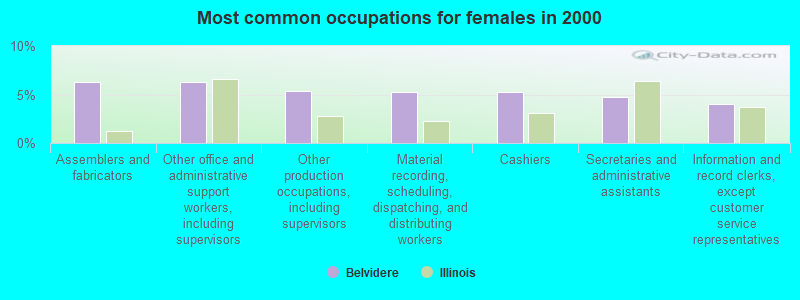
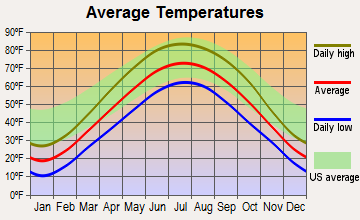
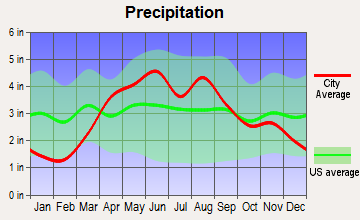
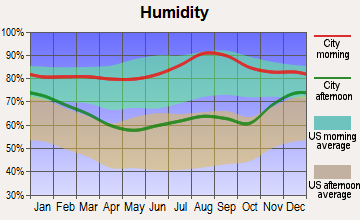
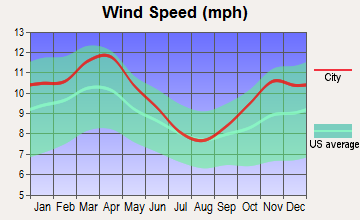
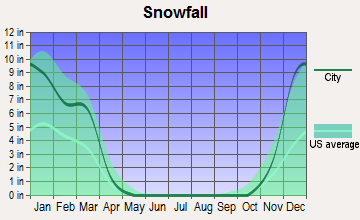
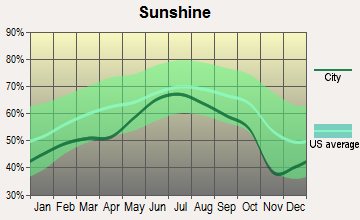
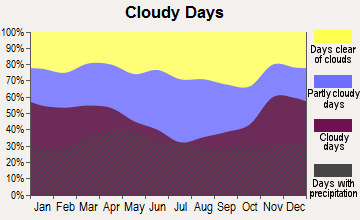

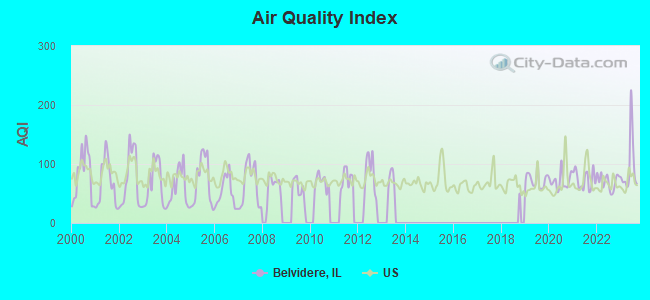
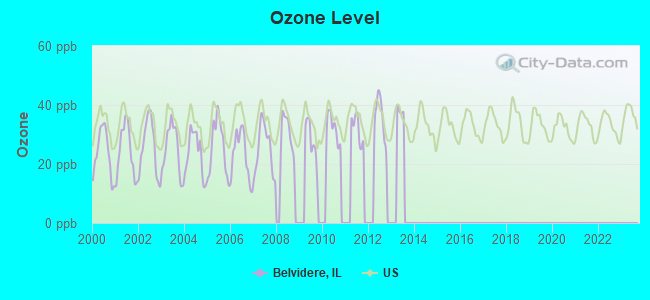
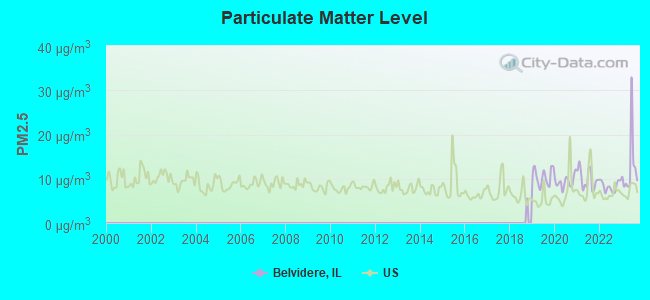
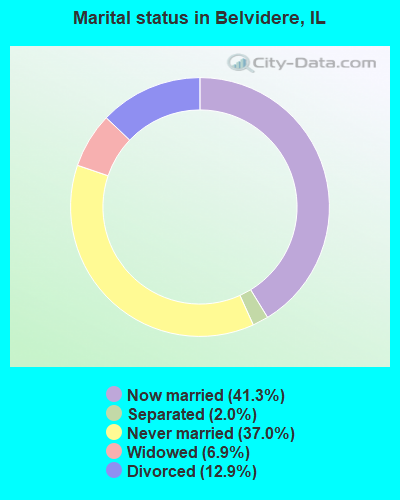
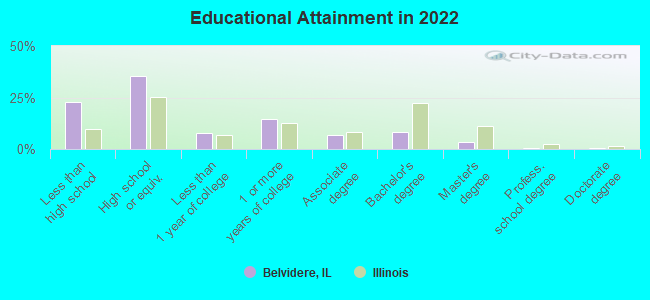
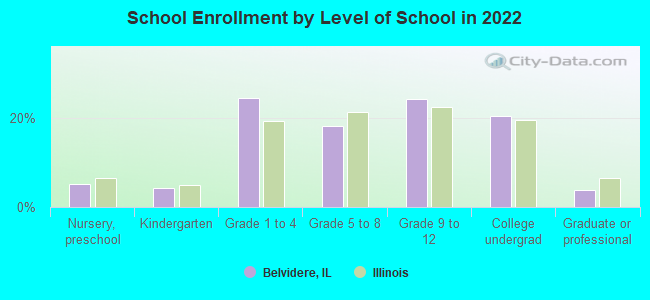
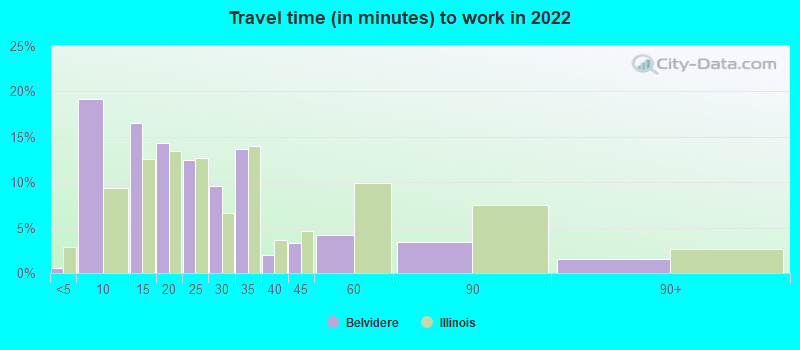
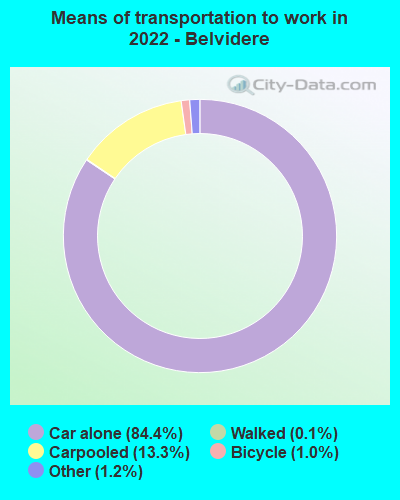
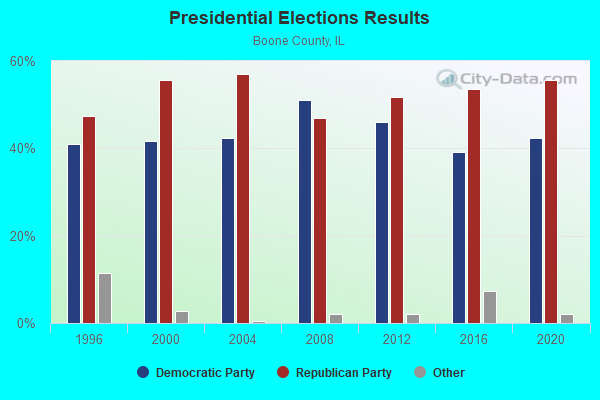
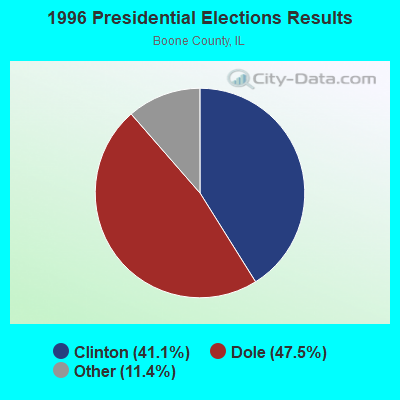
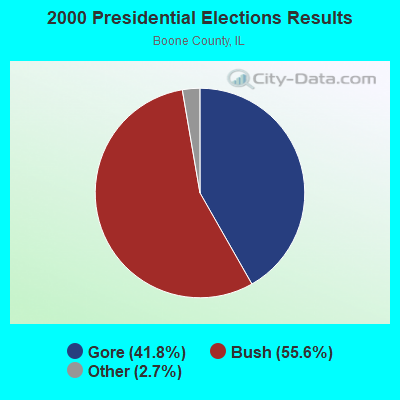
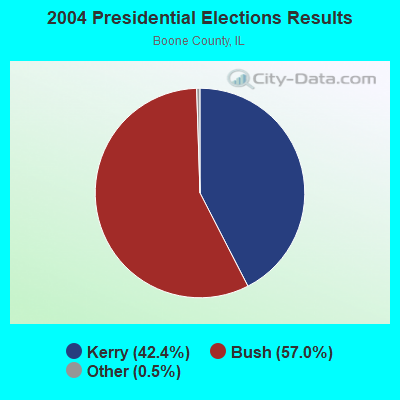
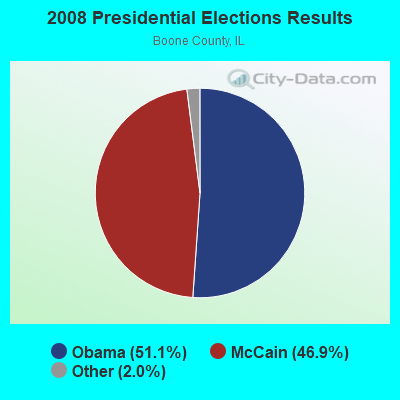
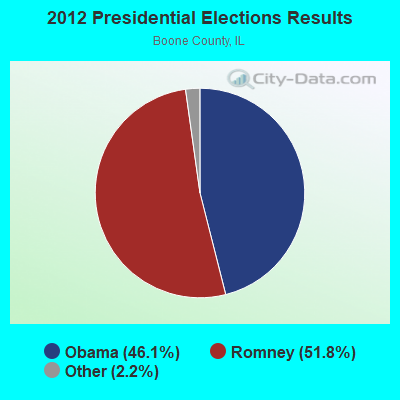
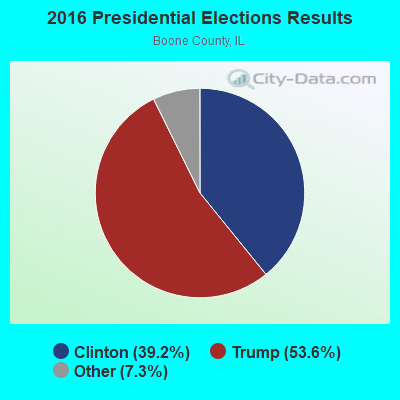
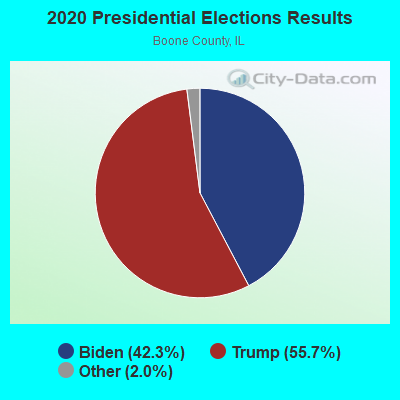
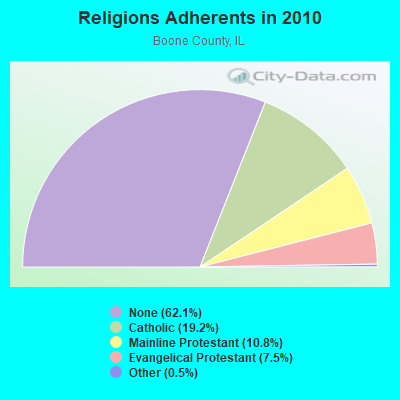
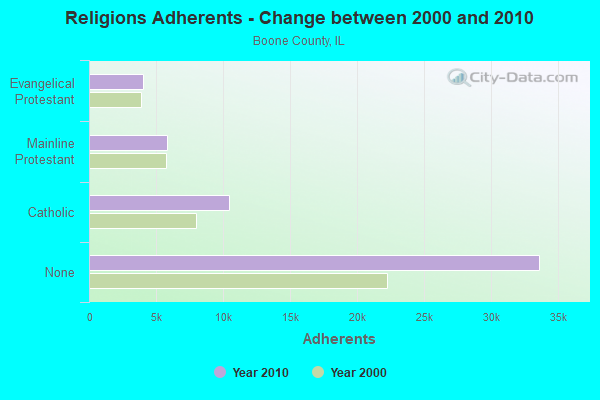
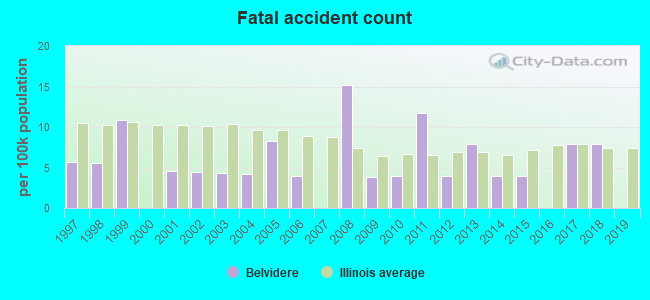
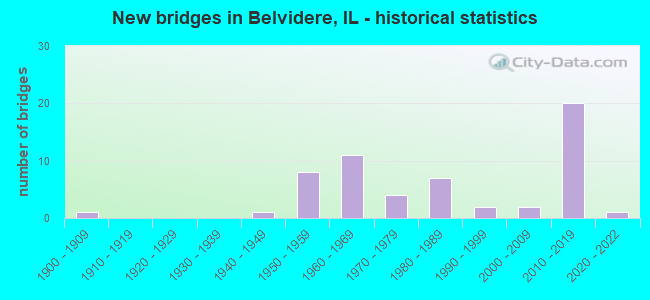
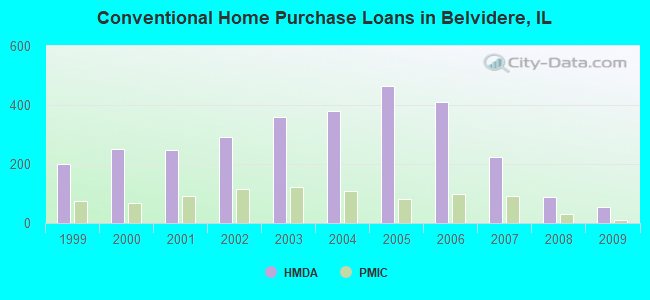
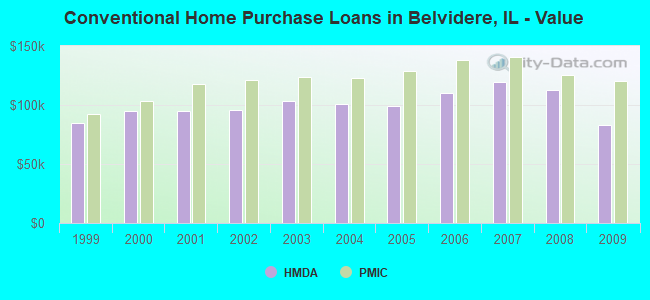
 Based on the data from the years 2002 - 2018 the average number of fire incidents per year is 115. The highest number of fire incidents - 172 took place in 2004, and the least - 48 in 2007. The data has an increasing trend.
 When looking into fire subcategories, the most incidents belonged to: Outside Fires (39.2%), and Structure Fires (31.2%).