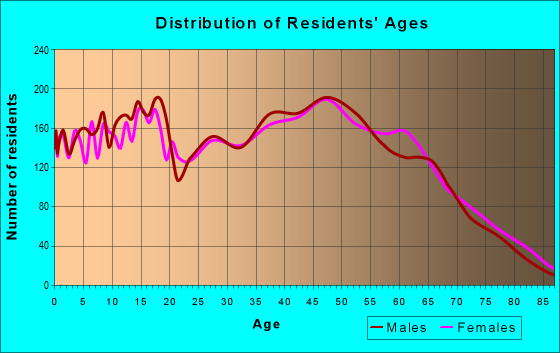
Estimated zip code population in 2022: 22,231 Zip code population in 2010: 23,180 Zip code population in 2000: 20,431
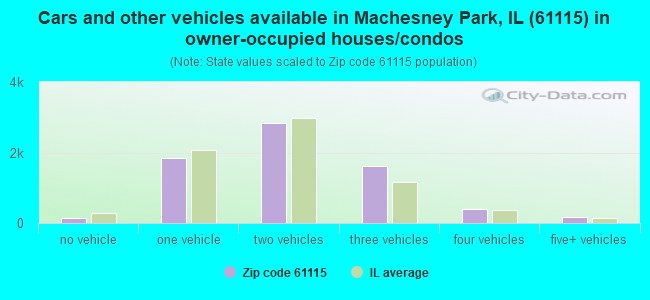
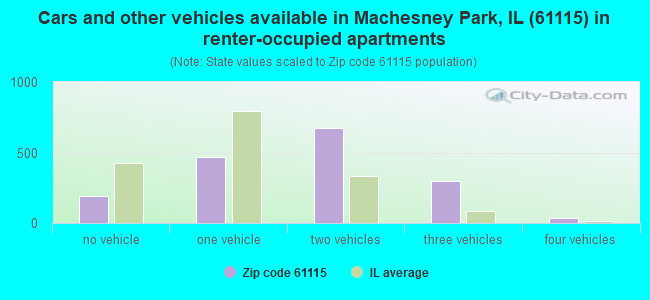
Houses and condos: 9,168 Renter-occupied apartments: 1,695
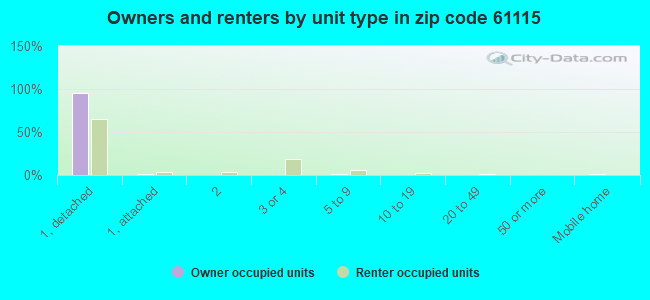
% of renters here:
19%
State:
33%
March 2022 cost of living index in zip code 61115: 85.0 (less than average, U.S. average is 100)
Land area: 10.6 sq. mi. Water area: 0.3 sq. mi.
Population density: 2,093 people per square mile
(low).
OSM Map
General Map
Google Map
MSN Map
OSM Map
General Map
Google Map
MSN Map
OSM Map
General Map
Google Map
MSN Map
OSM Map
General Map
Google Map
MSN Map
Please wait while loading the map...
Real estate property taxes paid for housing units in 2022:
This zip code:
2.2% ($3,504)
Illinois:
2.0% ($4,912)
Median real estate property taxes paid for housing units with mortgages in 2022: $3,711 (2.2%) Median real estate property taxes paid for housing units with no mortgage in 2022: $3,072 (2.2%)
Averages for the 2020 tax year for zip code 61115, filed in 2021:
Average Adjusted Gross Income (AGI) in 2020: $52,220 (Individual Income Tax Returns)
Here:
$52,220
State:
$82,626
Salary/wage: $47,655 (reported on 84.1% of returns)
Here:
$47,655
State:
$66,640
(% of AGI for various income ranges: 1039.2% for AGIs below $25k, 3281.9% for AGIs $25k-50k, 6048.1% for AGIs $50k-75k, 8733.4% for AGIs $75k-100k, 15309.0% for AGIs $100k-200k, 42976.0% for AGIs over 200k)
Taxable interest for individuals: $614 (reported on 21.7% of returns)
This zip code:
$614
Illinois:
$2,376
(% of AGI for various income ranges: 9.6% for AGIs below $25k, 12.1% for AGIs $25k-50k, 18.6% for AGIs $50k-75k, 20.9% for AGIs $75k-100k, 41.8% for AGIs $100k-200k, 96.0% for AGIs over 200k)
Ordinary dividends: $2,087 (reported on 12.6% of returns)
Here:
$2,087
State:
$9,061
(% of AGI for various income ranges: 18.0% for AGIs below $25k, 12.6% for AGIs $25k-50k, 40.3% for AGIs $50k-75k, 39.6% for AGIs $75k-100k, 96.2% for AGIs $100k-200k, 534.0% for AGIs over 200k)
Net capital gain/loss in AGI: +$5,297 (reported on 10.4% of returns)
Here:
+$5,297
State:
+$31,684
(% of AGI for various income ranges: 4.0% for AGIs below $25k, 14.0% for AGIs $25k-50k, 34.1% for AGIs $50k-75k, 87.7% for AGIs $75k-100k, 181.4% for AGIs $100k-200k, 5560.0% for AGIs over 200k)
Profit/loss from business: +$7,603 (reported on 10.9% of returns)
Here:
+$7,603
State:
+$12,175
(% of AGI for various income ranges: 81.7% for AGIs below $25k, 56.5% for AGIs $25k-50k, 127.1% for AGIs $50k-75k, 99.9% for AGIs $75k-100k, 294.4% for AGIs $100k-200k)
Taxable individual retirement arrangement distribution: $14,797 (reported on 10.3% of returns)
61115:
$14,797
Illinois:
$21,613
(% of AGI for various income ranges: 96.0% for AGIs below $25k, 116.4% for AGIs $25k-50k, 203.5% for AGIs $50k-75k, 336.7% for AGIs $75k-100k, 483.7% for AGIs $100k-200k, 1366.0% for AGIs over 200k)
Total itemized deductions: $25,318 (reported on 3.5% of returns)
Here:
$25,318
State:
$34,948
(% of AGI for various income ranges: 25.8% for AGIs below $25k, 54.0% for AGIs $25k-50k, 125.7% for AGIs $50k-75k, 199.5% for AGIs $75k-100k, 431.7% for AGIs $100k-200k)
Charity contributions: $7,526 (reported on 2.4% of returns)
Here:
$7,526
State:
$13,122
(% of AGI for various income ranges: 3.1% for AGIs below $25k, 4.3% for AGIs $25k-50k, 23.0% for AGIs $50k-75k, 31.7% for AGIs $75k-100k, 131.0% for AGIs $100k-200k)
Taxes paid: $7,515 (reported on 3.5% of returns)
61115:
$7,515
State:
$8,563
(% of AGI for various income ranges: 5.3% for AGIs below $25k, 10.1% for AGIs $25k-50k, 43.1% for AGIs $50k-75k, 69.6% for AGIs $75k-100k, 133.2% for AGIs $100k-200k)
Earned income credit: $2,250 (reported on 16.0% of returns)
Here:
$2,250
State:
$2,311
(% of AGI for various income ranges: 81.6% for AGIs below $25k, 64.9% for AGIs $25k-50k, 1.0% for AGIs $50k-75k)
Percentage of individuals using paid preparers for their 2020 taxes: 95.5%
Here:
95%
State:
93%
(% for various income ranges: 93.8% for AGIs below $25k, 96.6% for AGIs $25k-50k, 96.8% for AGIs $50k-75k, 95.9% for AGIs $75k-100k, 95.5% for AGIs $100k-200k, 92.3% for AGIs over 200k)
Averages for the 2012 tax year for zip code 61115, filed in 2013:
Average Adjusted Gross Income (AGI) in 2012: $44,098 (Individual Income Tax Returns)
Here:
$44,098
State:
$68,058
Salary/wage: $40,724 (reported on 87.5% of returns)
Here:
$40,724
State:
$55,396
(% of AGI for various income ranges: 73.5% for AGIs below $25k, 83.0% for AGIs $25k-50k, 82.5% for AGIs $50k-75k, 82.6% for AGIs $75k-100k, 83.4% for AGIs $100k-200k, 58.5% for AGIs over 200k)
Taxable interest for individuals: $609 (reported on 28.1% of returns)
This zip code:
$609
Illinois:
$1,969
(% of AGI for various income ranges: 0.9% for AGIs below $25k, 0.4% for AGIs $25k-50k, 0.3% for AGIs $50k-75k, 0.3% for AGIs $75k-100k, 0.2% for AGIs $100k-200k, 0.8% for AGIs over 200k)
Ordinary dividends: $1,607 (reported on 13.4% of returns)
Here:
$1,607
State:
$7,786
(% of AGI for various income ranges: 1.0% for AGIs below $25k, 0.5% for AGIs $25k-50k, 0.3% for AGIs $50k-75k, 0.4% for AGIs $75k-100k, 0.4% for AGIs $100k-200k, 0.6% for AGIs over 200k)
Net capital gain/loss in AGI: +$3,191 (reported on 8.9% of returns)
Here:
+$3,191
State:
+$22,183
(% of AGI for various income ranges: 0.1% for AGIs $50k-75k, 0.5% for AGIs $75k-100k, 0.8% for AGIs $100k-200k, 9.0% for AGIs over 200k)
Profit/loss from business: +$6,496 (reported on 11.0% of returns)
Here:
+$6,496
State:
+$12,903
(% of AGI for various income ranges: 5.2% for AGIs below $25k, 1.1% for AGIs $25k-50k, 1.3% for AGIs $50k-75k, 0.7% for AGIs $75k-100k, 1.8% for AGIs $100k-200k)
Taxable individual retirement arrangement distribution: $12,485 (reported on 11.1% of returns)
61115:
$12,485
Illinois:
$17,929
(% of AGI for various income ranges: 5.4% for AGIs below $25k, 3.1% for AGIs $25k-50k, 2.5% for AGIs $50k-75k, 3.0% for AGIs $75k-100k, 3.5% for AGIs $100k-200k)
Total itemized deductions: $16,856 (23% of AGI, reported on 29.2% of returns)
Here:
$16,856
State:
$26,433
Here:
22.7% of AGI
State:
19.2% of AGI
(% of AGI for various income ranges: 7.8% for AGIs below $25k, 9.0% for AGIs $25k-50k, 11.2% for AGIs $50k-75k, 12.4% for AGIs $75k-100k, 13.1% for AGIs $100k-200k, 15.3% for AGIs over 200k)
Charity contributions: $2,361 (reported on 21.7% of returns)
Here:
$2,361
State:
$4,525
(% of AGI for various income ranges: 0.6% for AGIs below $25k, 0.8% for AGIs $25k-50k, 1.1% for AGIs $50k-75k, 1.2% for AGIs $75k-100k, 1.6% for AGIs $100k-200k, 2.1% for AGIs over 200k)
Taxes paid: $6,908 (reported on 29.2% of returns)
61115:
$6,908
State:
$11,968
(% of AGI for various income ranges: 2.2% for AGIs below $25k, 3.1% for AGIs $25k-50k, 4.4% for AGIs $50k-75k, 5.4% for AGIs $75k-100k, 6.3% for AGIs $100k-200k, 6.5% for AGIs over 200k)
Earned income credit: $2,185 (reported on 18.7% of returns)
Here:
$2,185
State:
$2,349
(% of AGI for various income ranges: 6.3% for AGIs below $25k, 1.1% for AGIs $25k-50k)
Percentage of individuals using paid preparers for their 2012 taxes: 51.4%
Here:
51%
State:
57%
(% for various income ranges: 46.2% for AGIs below $25k, 52.5% for AGIs $25k-50k, 56.4% for AGIs $50k-75k, 53.2% for AGIs $75k-100k, 59.0% for AGIs $100k-200k, 85.7% for AGIs over 200k)
Averages for the 2004 tax year for zip code 61115, filed in 2005:
Average Adjusted Gross Income (AGI) in 2004: $38,362 (Individual Income Tax Returns)
Here:
$38,362
State:
$54,625
Salary/wage: $35,885 (reported on 90.4% of returns)
Here:
$35,885
State:
$46,811
(% of AGI for various income ranges: 90.4% for AGIs below $10k, 79.0% for AGIs $10k-25k, 85.8% for AGIs $25k-50k, 87.0% for AGIs $50k-75k, 89.9% for AGIs $75k-100k, 73.1% for AGIs over 100k)
Taxable interest for individuals: $751 (reported on 36.2% of returns)
This zip code:
$751
Illinois:
$2,101
(% of AGI for various income ranges: 2.7% for AGIs below $10k, 1.4% for AGIs $10k-25k, 0.6% for AGIs $25k-50k, 0.5% for AGIs $50k-75k, 0.5% for AGIs $75k-100k, 0.9% for AGIs over 100k)
Taxable dividends: $1,017 (reported on 16.8% of returns)
Here:
$1,017
State:
$4,306
(% of AGI for various income ranges: 1.8% for AGIs below $10k, 0.6% for AGIs $10k-25k, 0.4% for AGIs $25k-50k, 0.3% for AGIs $50k-75k, 0.2% for AGIs $75k-100k, 0.9% for AGIs over 100k)
Net capital gain/loss: +$3,864 (reported on 12.2% of returns)
Here:
+$3,864
State:
+$17,321
(% of AGI for various income ranges: -1.2% for AGIs below $10k, 0.1% for AGIs $10k-25k, 0.2% for AGIs $25k-50k, 0.5% for AGIs $50k-75k, 0.8% for AGIs $75k-100k, 6.6% for AGIs over 100k)
Profit/loss from business: +$5,536 (reported on 12.6% of returns)
Here:
+$5,536
State:
+$11,771
(% of AGI for various income ranges: 1.4% for AGIs below $10k, 3.5% for AGIs $10k-25k, 1.6% for AGIs $25k-50k, 1.0% for AGIs $50k-75k, 0.9% for AGIs $75k-100k, 4.0% for AGIs over 100k)
IRA payment deduction: $2,663 (reported on 2.0% of returns)
61115:
$2,663
Illinois:
$3,087
(% of AGI for various income ranges: 0.1% for AGIs $10k-25k, 0.2% for AGIs $25k-50k, 0.2% for AGIs $50k-75k, 0.1% for AGIs $75k-100k, 0.1% for AGIs over 100k)
Self-employed pension: $6,474 (reported on 0.2% of returns)
Here:
$6,474
Illinois:
$16,965
Total itemized deductions: $13,554 (22% of AGI, reported on 32.5% of returns)
Here:
$13,554
State:
$20,239
Here:
22.3% of AGI
State:
19.5% of AGI
(% of AGI for various income ranges: 9.2% for AGIs below $10k, 8.3% for AGIs $10k-25k, 11.3% for AGIs $25k-50k, 12.2% for AGIs $50k-75k, 12.0% for AGIs $75k-100k, 12.6% for AGIs over 100k)
Charity contributions deductions: $1,862 (3% of AGI, reported on 26.8% of returns)
Here:
$1,862
State:
$3,719
Here:
2.9% of AGI
State:
3.4% of AGI
(% of AGI for various income ranges: 0.5% for AGIs below $10k, 0.7% for AGIs $10k-25k, 1.0% for AGIs $25k-50k, 1.3% for AGIs $50k-75k, 1.5% for AGIs $75k-100k, 2.0% for AGIs over 100k)
Total tax: $4,298 (reported on 76.5% of returns)
61115:
$4,298
State:
$9,882
(% of AGI for various income ranges: 2.1% for AGIs below $10k, 4.1% for AGIs $10k-25k, 6.6% for AGIs $25k-50k, 8.4% for AGIs $50k-75k, 10.2% for AGIs $75k-100k, 15.1% for AGIs over 100k)
Earned income credit: $1,586 (reported on 14.7% of returns)
Here:
$1,586
State:
$1,788
Percentage of individuals using paid preparers for their 2004 taxes: 55.4%
Here:
55%
State:
61%
(% for various income ranges: 43.4% for AGIs below $10k, 55.5% for AGIs $10k-25k, 59.1% for AGIs $25k-50k, 60.0% for AGIs $50k-75k, 57.6% for AGIs $75k-100k, 60.0% for AGIs over 100k)
Household received Food Stamps/SNAP in the past 12 months: 1,203 Household did not receive Food Stamps/SNAP in the past 12 months: 7,497
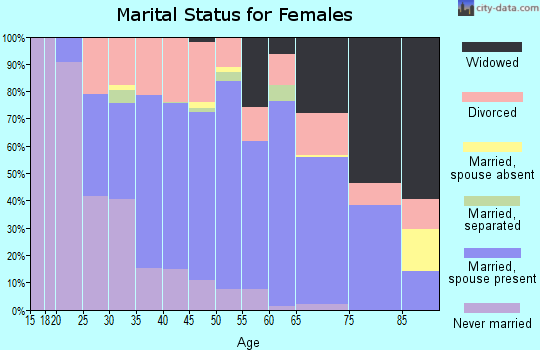
Women who had a birth in the past 12 months: 254 (119 now married, 134 unmarried) Women who did not have a birth in the past 12 months: 5,245 (2,152 now married, 3,089 unmarried)
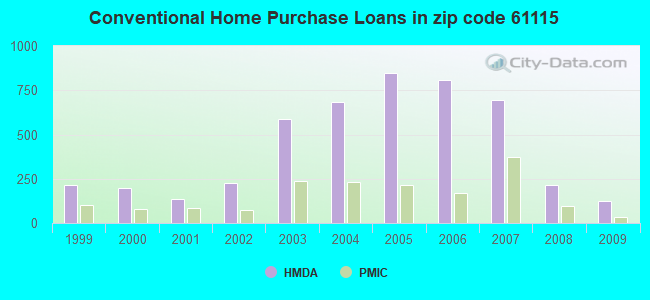
Housing units in zip code 61115 with a mortgage: 4,891 (423 second mortgage, 2 home equity loan, 363 both second mortgage and home equity loan) Houses without a mortgage: 105
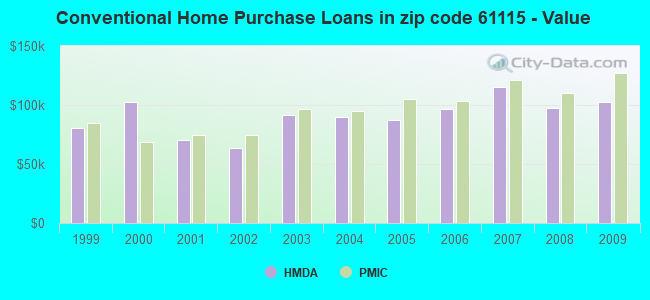
Median monthly owner costs for units with a mortgage: $1,227 Median monthly owner costs for units without a mortgage: $569
Residents with income below the poverty level in 2022:
This zip code:
11.3%
Whole state:
11.9%
Residents with income below 50% of the poverty level in 2022:
This zip code:
5.3%
Whole state:
5.7%
Median number of rooms in houses and condos:
Here:
6.1
State:
6.4
Median number of rooms in apartments:
Here:
5.0
State:
4.1
Notable locations in this zip code not listed on our city pages
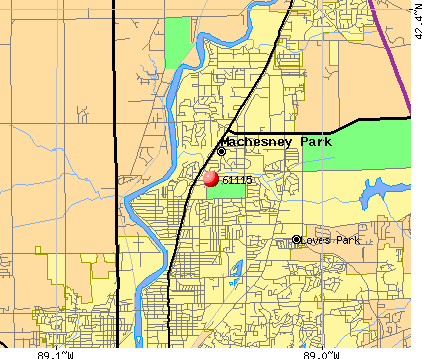
Notable locations in zip code 61115: Harlem - Roscoe Fire Protection District Station 2 and Ambulance Service (A), Harlem Community Center (B), Machesney Park Village Hall (C), North Park Fire Protection District Wood Avenue Station (D). Display/hide their locations on the map
Churches in zip code 61115 include: Concordia Lutheran Church (A), Evans United Methodist Church (B), First Baptist Church of Machesney Park (C), First Korean Church (D), Glad Tidings Church (E), Harlem United Methodist Church (F), New Hope Baptist Church (G), North Park Church of Christ (H), North Park Covenant Church (I). Display/hide their locations on the map
2,539 married couples with children.
1,399 single-parent households (468 men, 931 women).
92.4% of residents of 61115 zip code speak English at home.
2.8% of residents speak Spanish at home (65% very well, 25% well, 10% not well).
2.9% of residents speak other Indo-European language at home (49% very well, 35% well, 11% not well, 6% not at all).
1.1% of residents speak Asian or Pacific Island language at home (79% very well, 21% not well).
0.3% of residents speak other language at home (100% very well).
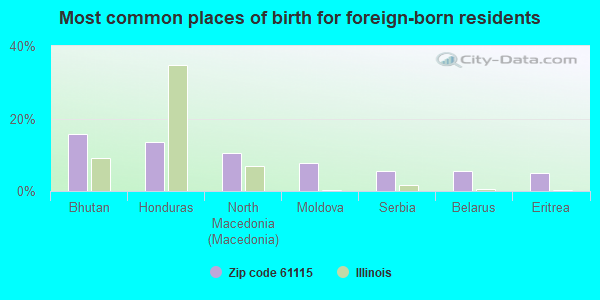
Foreign born population: 1,067 (4.8%) (52.3% of them are naturalized citizens)
This zip code:
4.8%
Whole state:
14.4%
16%Bhutan
14%Honduras
10%North Macedonia (Macedonia)
8%Moldova
6%Serbia
5%Belarus
5%Eritrea
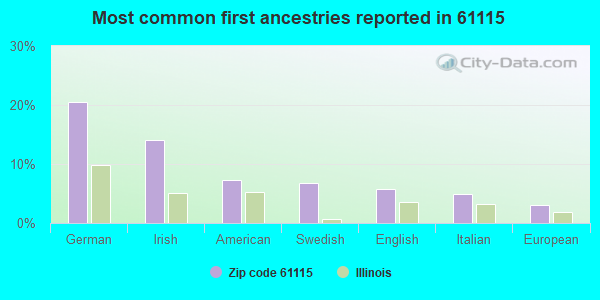
20%German
14%Irish
7%American
7%Swedish
6%English
5%Italian
3%European
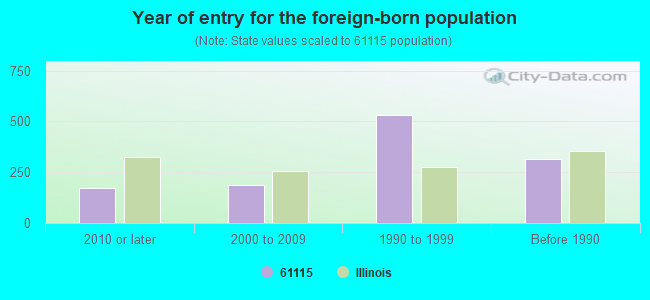
Year of entry for the foreign-born population
1732010 or later
1892000 to 2009
5321990 to 1999
314Before 1990
Major facilities with environmental interests located in this zip code:
CINCINNATI AUTOMATION & TEST (4950 MARLIN DR in ROCKFORD, IL)
STATE MASTER (Illinois EPA Project) - SOLID WASTE PROGRAM, HAZARDOUS WASTE PROGRAM, AIR PROGRAM AIR MINOR (AIRS/AFS) COMPLIANCE ACTIVITY (Tracking inspections of insecticide, fungicide, and rodenticide, and toxic substances) CRITERIA AND HAZARDOUS AIR POLLUTANT INVENTORY (Inventory of air pollution sources) National Pollutant Discharge Elimination System NON-MAJOR (Tracking pollutant discharge elimination systems) - permit HAZARDOUS WASTE BIENNIAL REPORTER (Resource Conservation and Recovery Act (tracking hazardous waste)) TSD (Resource Conservation and Recovery Act (tracking hazardous waste)) TRI REPORTER (Tracking of toxic chemicals releasing facilities) Business SIC classification: FLUID POWER CYLINDERS AND ACTUATORS Business NAICS classification: FLUID POWER CYLINDER AND ACTUATOR MANUFACTURING.; FLUID POWER CYLINDER AND ACTUATOR MANUFACTURING. Organizations: M-C INDUSTRIES/HYDRO-LINE MANU (CONTACT/OWNER)
, EATON HYDRAULICS, INC (CONTACT/OWNER)
, EATON HYRAULICS INC (CONTACT/OWNER)
Alternative names: EATON HYDRAULICS, HYDRO LINE INC, HYDRO LINE MFG CO, M-C INDUSTRIES/HYDRO-LINE MANU
CURTIS METAL FINISHING CO (9917 NORTH ALPINE ROAD in MACHESNEY PARK, IL)
STATE MASTER (Illinois EPA Project) - HAZARDOUS WASTE PROGRAM, AIR PROGRAM AIR SYNTHETIC MINOR (AIRS/AFS) CRITERIA AND HAZARDOUS AIR POLLUTANT INVENTORY (Inventory of air pollution sources) Large Quantity Generators, more that 1000 kg of hazardous waste/month (Resource Conservation and Recovery Act (tracking hazardous waste)) TRI REPORTER (Tracking of toxic chemicals releasing facilities) Business SIC classification: COATING, ENGRAVING, AND ALLIED SERVICES Organizations: CURTIS METAL FINISHING COMPANY (CONTACT/OPERATOR)
, COMMERCIAL STEEL TREATING CORP (CONTACT/OWNER)
MEYER MATERIALS CO (9034 N. 2ND ST. in MACHESNEY PARK, IL)
STATE MASTER (Illinois EPA Project) - AIR PROGRAM AIR MINOR (AIRS/AFS) CRITERIA AND HAZARDOUS AIR POLLUTANT INVENTORY (Inventory of air pollution sources) National Pollutant Discharge Elimination System NON-MAJOR (Tracking pollutant discharge elimination systems) - permit Business SIC classification: READY-MIXED CONCRETE Alternative names: MEYER MATERIALS COMPANY YARD 35, MEYER MATERIAL YARD-#35, NORTH SHORE YARD 35
NORTH PARK PWD (1350 TURRET DR in MACHESNEY PARK, IL)
STATE MASTER (Illinois EPA Project) - DRINKING WATER PROGRAM FORMAL ENFORCEMENT ACTION (Integrated Compliance Information System) - ICIS-05-2006-4860, ENFORCEMENT/COMPLIANCE ACTIVITY
COACHMANS CCR BODY SHOP INC (1232 SHAPPERT DR in MACHESNEY PARK, IL)
STATE MASTER (Illinois EPA Project) - HAZARDOUS WASTE PROGRAM Conditionally Exempt Small Quantity Generators, less than 100 kg/month of hazardous waste (Resource Conservation and Recovery Act (tracking hazardous waste)) - notification Business NAICS classification: AUTOMOTIVE BODY, PAINT, AND INTERIOR REPAIR AND MAINTENANCE. Organizations: DENNIS JAMES WILSON (CONTACT/OWNER)
, DENNIS WAYNE WILSON (CONTACT/OWNER)
, DORIS MELINDA WILSON (CONTACT/OWNER)
, DUSTIN WAYNE WILSON (CONTACT/OWNER)
Alternative names: STEWART AUTO RESTORATION SPECIALTIES
APPLIED PRODUCTS INC (12000 PRODUCT DRIVE in MACHESNEY PARK, IL)
STATE MASTER (Illinois EPA Project) - SOLID WASTE PROGRAM, AIR PROGRAM AIR MINOR (AIRS/AFS) CRITERIA AND HAZARDOUS AIR POLLUTANT INVENTORY (Inventory of air pollution sources) Conditionally Exempt Small Quantity Generators, less than 100 kg/month of hazardous waste (Resource Conservation and Recovery Act (tracking hazardous waste)) - notification Business SIC classification: COATED AND LAMINATED PAPER; NONCLASSIFIABLE ESTABLISHMENTS Organizations: NETHERY STEVEN (CONTACT/OWNER)
H&M MACHINING (1209 SHAPPERT DRIVE in MACHESNEY PARK, IL)
STATE MASTER (Illinois EPA Project) - SOLID WASTE PROGRAM, HAZARDOUS WASTE PROGRAM, AIR PROGRAM AIR MINOR (AIRS/AFS) Small Quantity Generators, between 100 kg and 1000 kg of hazardous waste/month (Resource Conservation and Recovery Act (tracking hazardous waste)) - notification Business SIC classification: PRIMARY METAL PRODUCTS Organizations: EMCO BONDING INC (CONTACT/OWNER)
Alternative names: EMCO BONDING INC
PDQ MACHINE & TOOL (1158 POWER RD in MACHESNEY PARK, IL)
STATE MASTER (Illinois EPA Project) - SOLID WASTE PROGRAM, HAZARDOUS WASTE PROGRAM (Resource Conservation and Recovery Act (tracking hazardous waste)) Organizations: PDQ MACHINE INC (CONTACT/OWNER)
Alternative names: PDC MACHINE AND TOOL INC, PDQ MACHINE INC
JRM INTERNATIONAL INC (1214 SHAPPERT DR in MACHESNEY PARK, IL)
STATE MASTER (Illinois EPA Project) - HAZARDOUS WASTE PROGRAM (Resource Conservation and Recovery Act (tracking hazardous waste))
PACEMAKER FOOD STORES INC (8010 NORTH 2ND ST. in MACHESNEY PARK, IL)
STATE MASTER (Illinois EPA Project) - AIR PROGRAM AIR MINOR (AIRS/AFS) Business SIC classification: GROCERY STORES
MACHINE TOOL BUILDERS INC (7723 BURDEN RD in MACHESNEY PARK, IL)
STATE MASTER (Illinois EPA Project) - SOLID WASTE PROGRAM, HAZARDOUS WASTE PROGRAM Small Quantity Generators, between 100 kg and 1000 kg of hazardous waste/month (Resource Conservation and Recovery Act (tracking hazardous waste)) - notification Business NAICS classification: CUTTING TOOL AND MACHINE TOOL ACCESSORY MANUFACTURING. Organizations: RAK REHNBERG (CONTACT/OWNER)
Alternative names: INGERSOLL AUTOMATION INC
HARLEM ROSCOE FIRE DEPARTMENT (ILLINOIS 251 AND ILLINOIS 173 in MACHESNEY PARK, IL)
STATE MASTER (Illinois EPA Project) - AIR PROGRAM AIR MINOR (AIRS/AFS) Business SIC classification: NONCLASSIFIABLE ESTABLISHMENTS
HOME DEPOT 1956 (1580 W LANE RD in MACHESNEY PARK, IL)
STATE MASTER (Illinois EPA Project) - HAZARDOUS WASTE PROGRAM Small Quantity Generators, between 100 kg and 1000 kg of hazardous waste/month (Resource Conservation and Recovery Act (tracking hazardous waste))
Housing units lacking complete plumbing facilities: 0.8% Housing units lacking complete kitchen facilities: 1.5%
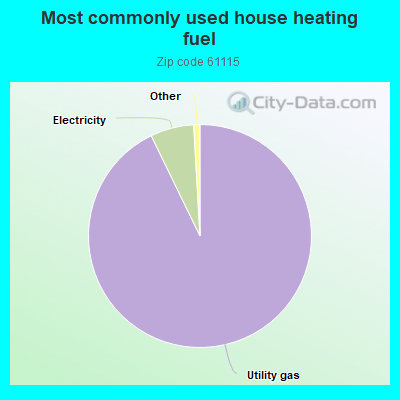
92.8%Utility gas
6.3%Electricity
Place of birth for U.S.-born residents:
This state: 17,377
Northeast: 219
Midwest: 1,993
South: 726
West: 627
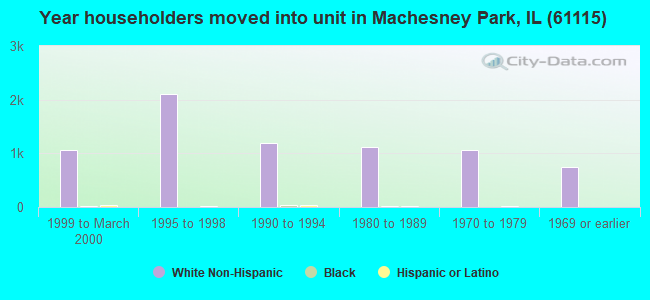
60% of the 61115 zip code residents lived in the same house 5 years ago. Out of people who lived in different houses, 79% lived in this county. Out of people who lived in different counties, 50% lived in Illinois.
91% of the 61115 zip code residents lived in the same house 1 year ago. Out of people who lived in different houses, 70% moved from this county. Out of people who lived in different houses, 25% moved from different county within same state. Out of people who lived in different houses, 2% moved from different state. Out of people who lived in different houses, 1% moved from abroad.
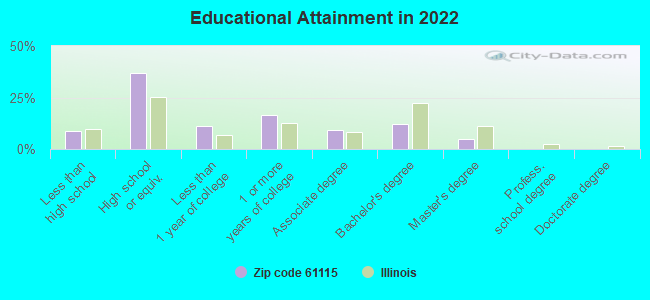
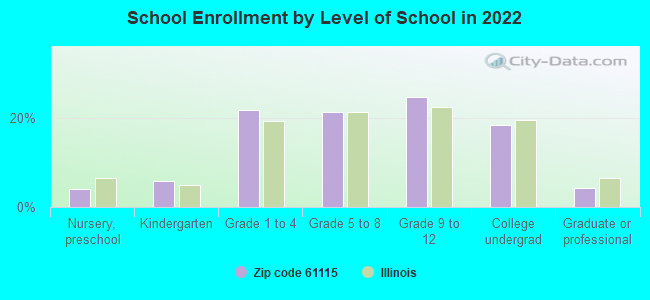
Private vs. public school enrollment:
Students in private schools in grades 1 to 8 (elementary and middle school): 210
Here:
9.4%
Illinois:
13.3%
Students in private schools in grades 9 to 12 (high school): 39
Here:
3.0%
Illinois:
9.9%
Students in private undergraduate colleges: 265
Here:
27.5%
Illinois:
27.4%
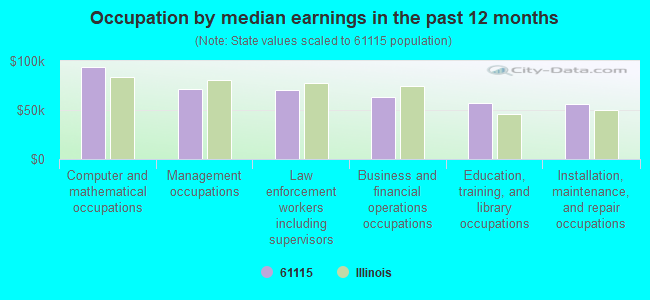
Occupation by median earnings in the past 12 months ($)
93,979Computer and mathematical occupations
71,161Management occupations
70,601Law enforcement workers including supervisors
62,987Business and financial operations occupations
57,332Education, training, and library occupations
55,869Installation, maintenance, and repair occupations
Companies with federal contracts located in this zip code (MACHESNEY PARK, IL):
DEVLIEG BULLARD II, INC (10100 FOREST HILLS ROAD; small business) : $2,135,883 in 18 contractsfrom 2001 to 2005
Contracts for Lathes, Maintenance, Repair and Rebuilding of Equipment -- Special Industry Machinery, Miscellaneous Items, Maintenance, Repair and Rebuilding of Equipment -- Miscellaneous, and moreby Defense Logistics Agency, Air Force, Army, Navy, and others Signed by year:2000: $0; 2001: $919,610; 2002: $1,110,125; 2003: $5,849; 2004: $99,569; 2005: $730; 2006: $0.
Biggest contracts:
$1,006,024 with Defense Logistics Agency for Lathes. Signed on 2002-08-27. Completion date: 2003-04-24.
$836,100 with Air Force for Maintenance, Repair and Rebuilding of Equipment -- Special Industry Machinery. Taking place in GA. Signed on 2001-08-23. Completion date: 2001-09-28.
$86,400 with Defense Logistics Agency for Miscellaneous Items. Taking place in OH. Signed on 2002-07-01. Completion date: 2002-10-29.
$83,510 with Air Force for Maintenance, Repair and Rebuilding of Equipment -- Special Industry Machinery. Taking place in GA. Signed on 2001-08-31. Completion date: 2001-09-28.
MAG AEROSPACE INDUSTRIES, INC (1260 TURRET DR) : $542,530 in 17 contractsfrom 1999 to 2006
Contracts for Water Distillation Equipment, Marine and Industrial, Plumbing Fixtures and Accessories, Sewage Treatment Equipment, Valves, Nonpowered, and moreby Navy, U.S. Coast Guard, Army Signed by year:2000: $212,120; 2001: $29,027; 2002: $53,924; 2003: $37,035; 2004: $23,625; 2005: $74,734; 2006: $5,890.
Biggest contracts:
$212,120 with Navy for Water Distillation Equipment, Marine and Industrial. Signed on 2000-05-11. Completion date: 2000-08-31.
$106,175, same as above.Signed on 1999-10-06. Completion date: 2000-03-30.
$55,689 with U.S. Coast Guard for Plumbing Fixtures and Accessories. Signed on 2005-06-27. Completion date: 2006-03-30.
$53,924 with Navy for Plumbing Fixtures and Accessories. Signed on 2002-09-24. Completion date: 2003-01-28.
PARKER HANNIFIN CORPORATION (10711 NORTH SECOND STREET) : $282,261 in 7 contractsfrom 2002 to 2005
Contracts for Marine Hardware and Hull Items, Bearings, Mounted, Bushings, Rings, Shims, and Spacers, Miscellaneous Vehicular Components, and moreby Defense Logistics Agency, Army Signed by year:2000: $0; 2001: $0; 2002: $99,900; 2003: $26,720; 2004: $142,950; 2005: $12,691; 2006: $0.
Biggest contracts:
$99,900 with Defense Logistics Agency for Marine Hardware and Hull Items. Signed on 2002-02-28. Completion date: 2002-06-06.
$46,170 with Defense Logistics Agency for Bearings, Mounted. Signed on 2004-06-04. Completion date: 2005-03-11.
$39,116 with Defense Logistics Agency for Bushings, Rings, Shims, and Spacers. Signed on 2004-03-10. Completion date: 2004-06-28.
$37,524 with Defense Logistics Agency for Marine Hardware and Hull Items. Signed on 2004-08-06. Completion date: 2004-12-06.
PARKER HANNIFIN CORPORATION (10711 NORTH SECOND STREET) : $128,573 in 5 contractsfrom 2001 to 2004
Contracts for Valves, Nonpowered, Bushings, Rings, Shims, and Spacers, Marine Hardware and Hull Items, Miscellaneous Power Transmission Equipment, and moreby Navy, Defense Logistics Agency, Army Signed by year:2000: $0; 2001: $33,303; 2002: $33,300; 2003: $11,970; 2004: $50,000; 2005: $0; 2006: $0.
Biggest contracts:
$50,000 with Navy for Valves, Nonpowered. Signed on 2004-04-01. Completion date: 2004-07-06.
$33,303 with Defense Logistics Agency for Bushings, Rings, Shims, and Spacers. Signed on 2001-05-30. Completion date: 2001-12-26.
$33,300 with Defense Logistics Agency for Marine Hardware and Hull Items. Signed on 2002-06-05. Completion date: 2002-09-03.
$11,970 with Army for Miscellaneous Power Transmission Equipment. Signed on 2003-10-20. Completion date: 2003-11-26.
DEVLIEG-BULLARD SERVICES GROUP (10100 FORESTHILLS RD) : $70,000 in 2 contractsin 2000
$70,000 with Air Force for Maintenance, Repair and Rebuilding of Equipment -- Special Industry Machinery. Taking place in GA. Signed on 2000-09-22. Completion date: 2001-01-31.
$0, same as above.Signed on 2000-09-22. Completion date: 2001-01-31.
HENNIG, INC (9900 N ALPINE RD; small business) : $42,840 in 4 contractsfrom 2004 to 2006
$15,852 with Army for Cutting Tools for Machine Tools. Signed on 2004-04-19. Completion date: 2004-06-01.
$12,410 with Army for Machine Tool Accessories. Signed on 2006-03-28. Completion date: 2006-05-04.
$11,750, same as above.Signed on 2006-04-05. Completion date: 2006-05-10.
$2,828 with Army for Machining Centers and Way-Type Machines. Signed on 2005-06-23. Completion date: 2005-07-07.
RMC ENVIRONMENTAL INC (9226 NORTH 2ND STREET; small business)
$4,325 with Army for Equipment and Materials Testing -- Metal Bars, Sheets, and Shapes. Taking place in NC. Signed on 2006-04-27. Completion date: 2006-04-27.
3B6 TECHNOLOGIES, LLC (9957 N ALPINE RD; small business)
$3,700 with Army for Miscellaneous Special Industry Machinery. Taking place in MN. Signed on 2006-04-27. Completion date: 2006-04-24.
Top industries in this zip code by the number of employees in 2005:
Administrative and Support and Waste Management and Remediation Services: Telemarketing Bureaus (250-499 employees: 1 establishment)
2002 - 2018 National Fire Incident Reporting System (NFIRS) incidents
Based on the data from the years 2002 - 2018 the average number of fire incidents per year is 82. The highest number of fires - 117 took place in 2003, and the least - 63 in 2014. The data has a dropping trend.
When looking into fire subcategories, the most reports belonged to: Structure Fires (53.8%), and Outside Fires (25.4%).
Fire incident types reported to NFIRS in Zip Code 61115
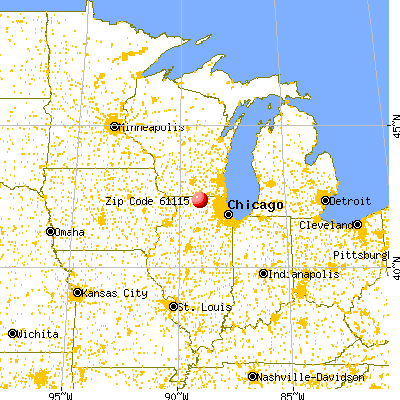


 Nearest zip codes: 61111, 61103, 61114, 61073, 61107, 61108.


 Based on the data from the years 2002 - 2018 the average number of fire incidents per year is 82. The highest number of fires - 117 took place in 2003, and the least - 63 in 2014. The data has a dropping trend.
 When looking into fire subcategories, the most reports belonged to: Structure Fires (53.8%), and Outside Fires (25.4%).