Estimated zip code population in 2022: 919 Zip code population in 2010: 1,232 Zip code population in 2000: 1,183
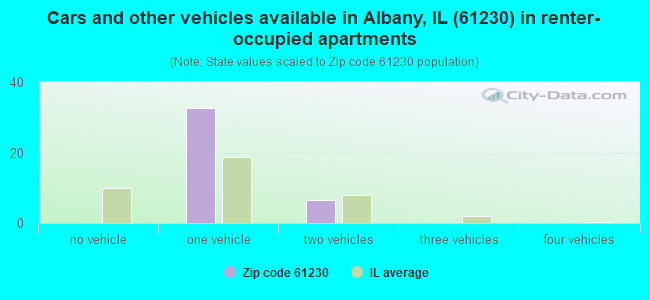
Houses and condos: 409 Renter-occupied apartments: 39
% of renters here:
10%
State:
33%
March 2022 cost of living index in zip code 61230: 84.2 (less than average, U.S. average is 100)
Land area: 18.8 sq. mi. Water area: 0.0 sq. mi.
Population density: 49 people per square mile
(very low).
OSM Map
General Map
Google Map
MSN Map
OSM Map
General Map
Google Map
MSN Map
OSM Map
General Map
Google Map
MSN Map
OSM Map
General Map
Google Map
MSN Map
Please wait while loading the map...
Real estate property taxes paid for housing units in 2022:
This zip code:
1.7% ($2,667)
Illinois:
2.0% ($4,912)
Median real estate property taxes paid for housing units with mortgages in 2022: $3,385 (1.8%) Median real estate property taxes paid for housing units with no mortgage in 2022: $2,233 (1.6%)
Business Search- 14 Million verified businesses
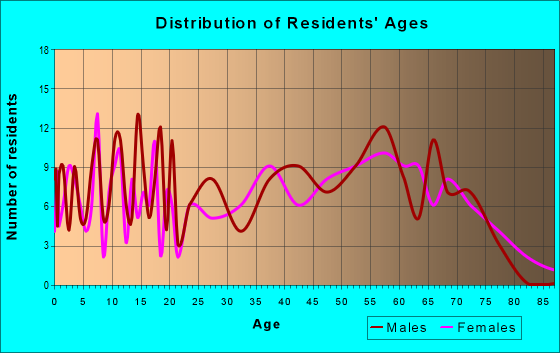
Males: 473
(51.5%)
Females: 445
(48.5%)
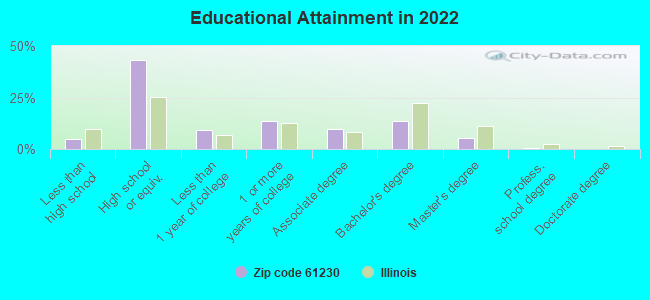
For population 25 years and over in 61230:
High school or higher: 94.4%
Bachelor's degree or higher: 19.1%
Graduate or professional degree: 5.7%
Unemployed: 3.5%
Mean travel time to work (commute): 18.8 minutes
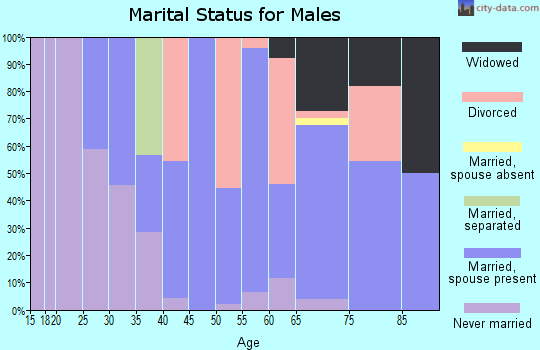
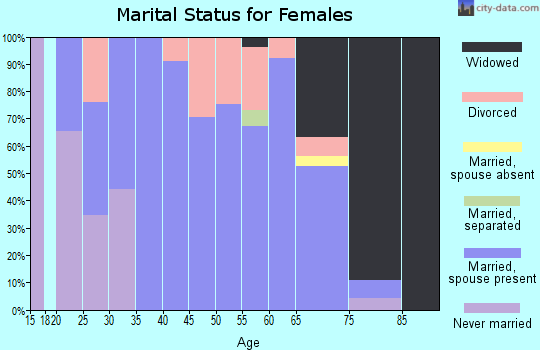
For population 15 years and over in 61230:
Never married: 30.9%
Now married: 49.7%
Separated: 1.2%
Widowed: 7.1%
Divorced: 11.0%
Zip code 61230 compared to state average:
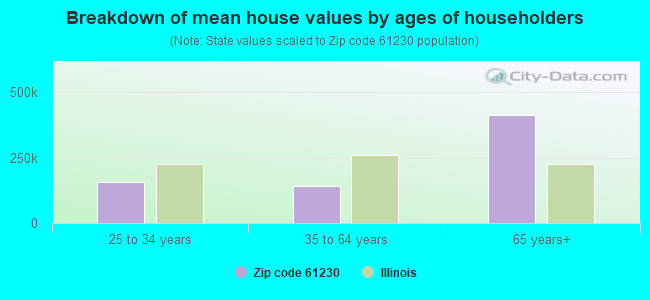
Median house value below state average.
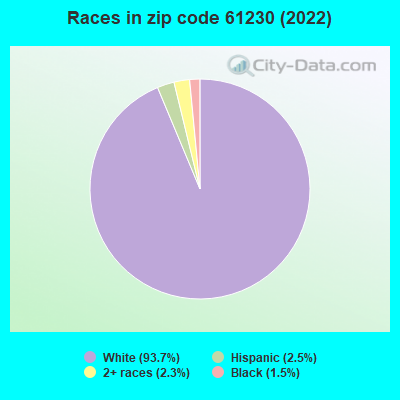
Black race population percentage significantly below state average.
Hispanic race population percentage significantly below state average.
Foreign-born population percentage significantly below state average.
Renting percentage significantly below state average.
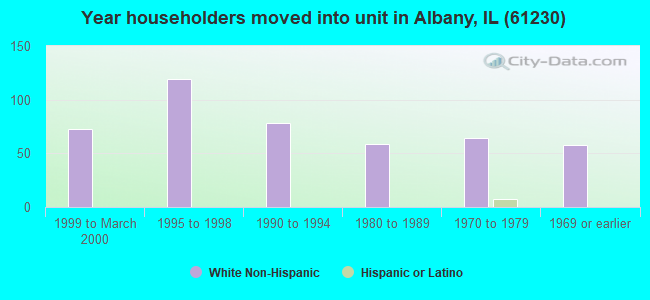
Length of stay since moving in above state average.
Number of college students significantly below state average.
Percentage of population with a bachelor's degree or higher below state average.
Averages for the 2020 tax year for zip code 61230, filed in 2021:
Average Adjusted Gross Income (AGI) in 2020: $61,919 (Individual Income Tax Returns)
Here:
$61,919
State:
$82,626
Salary/wage: $56,295 (reported on 72.9% of returns)
Here:
$56,295
State:
$66,640
(% of AGI for various income ranges: 1090.9% for AGIs below $25k, 2938.9% for AGIs $25k-50k, 5634.4% for AGIs $50k-75k, 8236.0% for AGIs $75k-100k, 15961.4% for AGIs $100k-200k)
Taxable interest for individuals: $817 (reported on 39.0% of returns)
This zip code:
$817
Illinois:
$2,376
(% of AGI for various income ranges: 22.7% for AGIs below $25k, 71.1% for AGIs $25k-50k, 32.2% for AGIs $50k-75k, 18.0% for AGIs $75k-100k, 87.1% for AGIs $100k-200k)
Ordinary dividends: $3,192 (reported on 20.3% of returns)
Here:
$3,192
State:
$9,061
(% of AGI for various income ranges: 49.1% for AGIs below $25k, 153.3% for AGIs $50k-75k, 272.9% for AGIs $100k-200k)
Net capital gain/loss in AGI: +$5,867 (reported on 15.3% of returns)
Here:
+$5,867
State:
+$31,684
(% of AGI for various income ranges: 58.9% for AGIs $50k-75k, 710.0% for AGIs $100k-200k)
Profit/loss from business: +$7,560 (reported on 8.5% of returns)
Here:
+$7,560
State:
+$12,175
(% of AGI for various income ranges: 102.7% for AGIs below $25k, 294.4% for AGIs $50k-75k)
Taxable individual retirement arrangement distribution: $19,114 (reported on 11.9% of returns)
61230:
$19,114
Illinois:
$21,613
(% of AGI for various income ranges: 183.6% for AGIs below $25k, 402.2% for AGIs $50k-75k, 1105.7% for AGIs $100k-200k)
Earned income credit: $1,900 (reported on 11.9% of returns)
Here:
$1,900
State:
$2,311
(% of AGI for various income ranges: 72.7% for AGIs below $25k, 58.9% for AGIs $25k-50k)
Percentage of individuals using paid preparers for their 2020 taxes: 91.5%
Here:
92%
State:
93%
(% for various income ranges: 93.8% for AGIs below $25k, 91.7% for AGIs $25k-50k, 84.6% for AGIs $50k-75k, 85.7% for AGIs $75k-100k, 100.0% for AGIs $100k-200k)
Averages for the 2012 tax year for zip code 61230, filed in 2013:
Average Adjusted Gross Income (AGI) in 2012: $53,770 (Individual Income Tax Returns)
Here:
$53,770
State:
$68,058
Salary/wage: $45,749 (reported on 80.3% of returns)
Here:
$45,749
State:
$55,396
(% of AGI for various income ranges: 64.4% for AGIs below $25k, 65.5% for AGIs $25k-50k, 74.1% for AGIs $50k-75k, 76.0% for AGIs $75k-100k, 63.5% for AGIs $100k-200k)
Taxable interest for individuals: $512 (reported on 42.6% of returns)
This zip code:
$512
Illinois:
$1,969
(% of AGI for various income ranges: 1.0% for AGIs below $25k, 0.8% for AGIs $25k-50k, 0.4% for AGIs $50k-75k, 0.2% for AGIs $75k-100k, 0.2% for AGIs $100k-200k)
Ordinary dividends: $1,587 (reported on 24.6% of returns)
Here:
$1,587
State:
$7,786
(% of AGI for various income ranges: 1.3% for AGIs below $25k, 0.5% for AGIs $25k-50k, 1.3% for AGIs $50k-75k, 0.3% for AGIs $75k-100k, 0.6% for AGIs $100k-200k)
Net capital gain/loss in AGI: +$3,086 (reported on 11.5% of returns)
Here:
+$3,086
State:
+$22,183
(% of AGI for various income ranges: 0.3% for AGIs $50k-75k, 1.6% for AGIs $100k-200k)
Profit/loss from business: +$3,200 (reported on 9.8% of returns)
Here:
+$3,200
State:
+$12,903
Taxable individual retirement arrangement distribution: $13,000 (reported on 13.1% of returns)
61230:
$13,000
Illinois:
$17,929
Total itemized deductions: $16,869 (18% of AGI, reported on 26.2% of returns)
Here:
$16,869
State:
$26,433
Here:
17.6% of AGI
State:
19.2% of AGI
(% of AGI for various income ranges: 8.8% for AGIs $25k-50k, 8.6% for AGIs $50k-75k, 8.6% for AGIs $75k-100k, 9.4% for AGIs $100k-200k)
Charity contributions: $2,255 (reported on 18.0% of returns)
Here:
$2,255
State:
$4,525
(% of AGI for various income ranges: 1.2% for AGIs $50k-75k, 0.6% for AGIs $75k-100k, 1.0% for AGIs $100k-200k)
Taxes paid: $6,850 (reported on 26.2% of returns)
61230:
$6,850
State:
$11,968
(% of AGI for various income ranges: 1.9% for AGIs $25k-50k, 3.1% for AGIs $50k-75k, 3.7% for AGIs $75k-100k, 4.6% for AGIs $100k-200k)
Earned income credit: $2,271 (reported on 11.5% of returns)
Here:
$2,271
State:
$2,349
(% of AGI for various income ranges: 4.3% for AGIs below $25k, 0.9% for AGIs $25k-50k)
Percentage of individuals using paid preparers for their 2012 taxes: 65.6%
Here:
66%
State:
57%
(% for various income ranges: 61.9% for AGIs below $25k, 61.5% for AGIs $25k-50k, 72.7% for AGIs $50k-75k, 71.4% for AGIs $75k-100k, 66.7% for AGIs $100k-200k)
Averages for the 2004 tax year for zip code 61230, filed in 2005:
Average Adjusted Gross Income (AGI) in 2004: $41,894 (Individual Income Tax Returns)
Here:
$41,894
State:
$54,625
Salary/wage: $37,910 (reported on 81.9% of returns)
Here:
$37,910
State:
$46,811
(% of AGI for various income ranges: 77.5% for AGIs below $10k, 60.6% for AGIs $10k-25k, 72.3% for AGIs $25k-50k, 82.2% for AGIs $50k-75k, 84.4% for AGIs $75k-100k, 58.5% for AGIs over 100k)
Taxable interest for individuals: $839 (reported on 54.0% of returns)
This zip code:
$839
Illinois:
$2,101
(% of AGI for various income ranges: 6.9% for AGIs below $10k, 2.9% for AGIs $10k-25k, 1.5% for AGIs $25k-50k, 0.8% for AGIs $50k-75k, 0.3% for AGIs $75k-100k, 0.5% for AGIs over 100k)
Taxable dividends: $1,210 (reported on 28.0% of returns)
Here:
$1,210
State:
$4,306
(% of AGI for various income ranges: 2.7% for AGIs below $10k, 1.4% for AGIs $10k-25k, 1.3% for AGIs $25k-50k, 0.5% for AGIs $50k-75k, 0.2% for AGIs $75k-100k, 0.9% for AGIs over 100k)
Net capital gain/loss: +$1,125 (reported on 17.4% of returns)
Here:
+$1,125
State:
+$17,321
(% of AGI for various income ranges: -3.0% for AGIs below $10k, 0.3% for AGIs $10k-25k, 0.1% for AGIs $25k-50k, 1.0% for AGIs $50k-75k, 0.9% for AGIs over 100k)
Profit/loss from business: +$1,246 (reported on 10.9% of returns)
Here:
+$1,246
State:
+$11,771
(% of AGI for various income ranges: 6.3% for AGIs $10k-25k, 0.4% for AGIs $25k-50k, -0.9% for AGIs $50k-75k, -0.3% for AGIs $75k-100k)
Profit/loss from farming: +$1,067 (reported on 2.5% of returns)
Here:
+$1,067
State:
+$2,327
Total itemized deductions: $14,007 (19% of AGI, reported on 23.5% of returns)
Here:
$14,007
State:
$20,239
Here:
19.3% of AGI
State:
19.5% of AGI
(% of AGI for various income ranges: 9.7% for AGIs $10k-25k, 6.8% for AGIs $25k-50k, 7.1% for AGIs $50k-75k, 9.6% for AGIs $75k-100k, 8.1% for AGIs over 100k)
Charity contributions deductions: $2,185 (3% of AGI, reported on 20.0% of returns)
Here:
$2,185
State:
$3,719
Here:
3.0% of AGI
State:
3.4% of AGI
(% of AGI for various income ranges: 1.0% for AGIs $10k-25k, 0.9% for AGIs $25k-50k, 0.8% for AGIs $50k-75k, 0.7% for AGIs $75k-100k, 2.0% for AGIs over 100k)
Total tax: $5,448 (reported on 77.9% of returns)
61230:
$5,448
State:
$9,882
(% of AGI for various income ranges: 2.0% for AGIs below $10k, 4.1% for AGIs $10k-25k, 6.9% for AGIs $25k-50k, 9.3% for AGIs $50k-75k, 10.3% for AGIs $75k-100k, 18.3% for AGIs over 100k)
Earned income credit: $1,600 (reported on 10.1% of returns)
Here:
$1,600
State:
$1,788
Percentage of individuals using paid preparers for their 2004 taxes: 65.6%
Here:
66%
State:
61%
(% for various income ranges: 43.4% for AGIs below $10k, 71.2% for AGIs $10k-25k, 65.9% for AGIs $25k-50k, 68.0% for AGIs $50k-75k, 81.0% for AGIs $75k-100k, 75.0% for AGIs over 100k)
Likely homosexual households (counted as self-reported same-sex unmarried-partner households)
Lesbian couples: 0.7% of all households
Gay men: 0.0% of all households
Household received Food Stamps/SNAP in the past 12 months: 35 Household did not receive Food Stamps/SNAP in the past 12 months: 346
Women who had a birth in the past 12 months: 3 (1 now married, 1 unmarried) Women who did not have a birth in the past 12 months: 174 (59 now married, 115 unmarried)
Housing units in zip code 61230 with a mortgage: 162 (18 second mortgage, 18 both second mortgage and home equity loan) Houses without a mortgage: 3
Median monthly owner costs for units with a mortgage: $1,473 Median monthly owner costs for units without a mortgage: $541
Residents with income below the poverty level in 2022:
This zip code:
5.7%
Whole state:
11.9%
Residents with income below 50% of the poverty level in 2022:
This zip code:
2.1%
Whole state:
5.7%
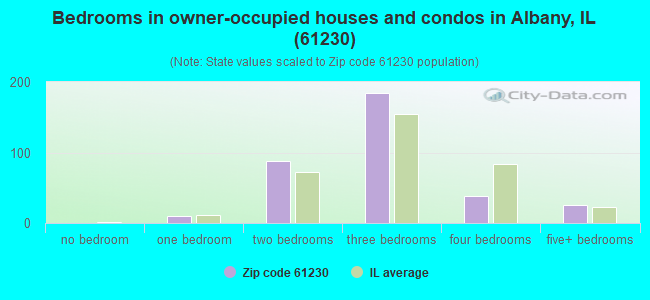
Median number of rooms in houses and condos:
Here:
6.1
State:
6.4
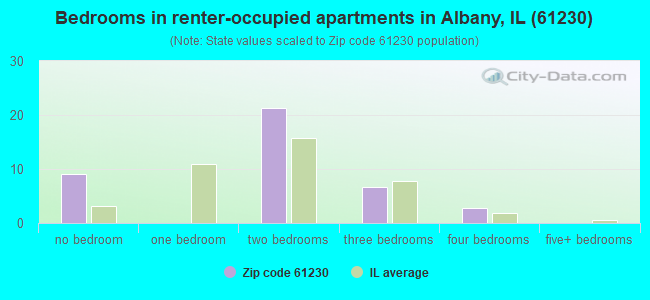
Median number of rooms in apartments:
Here:
4.5
State:
4.1
Notable locations in this zip code not listed on our city pages
Size of family households: 123 2-persons, 38 3-persons, 81 4-persons, 10 5-persons
Size of nonfamily households: 99 1-person, 21 2-persons, 9 3-persons
101 married couples with children.
109 single-parent households (75 men, 34 women).
98.2% of residents of 61230 zip code speak English at home.
1.1% of residents speak Spanish at home (100% very well).
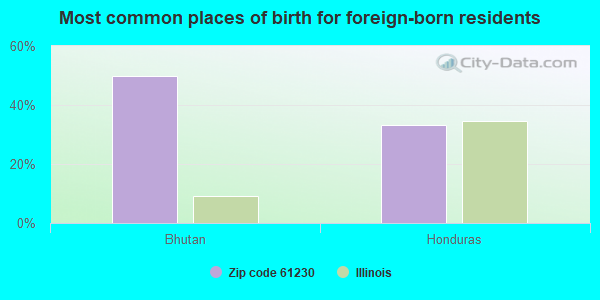
Foreign born population: 6 (0.7%) (50.2% of them are naturalized citizens)
This zip code:
0.7%
Whole state:
14.4%
50%Bhutan
33%Honduras
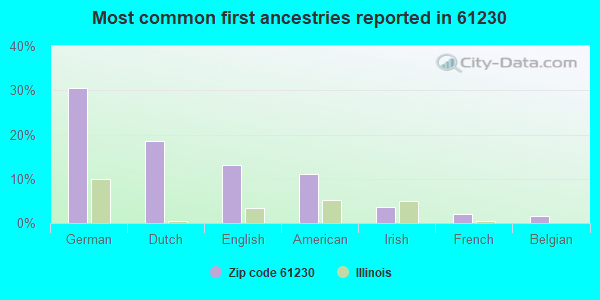
31%German
19%Dutch
13%English
11%American
4%Irish
2%French
1%Belgian
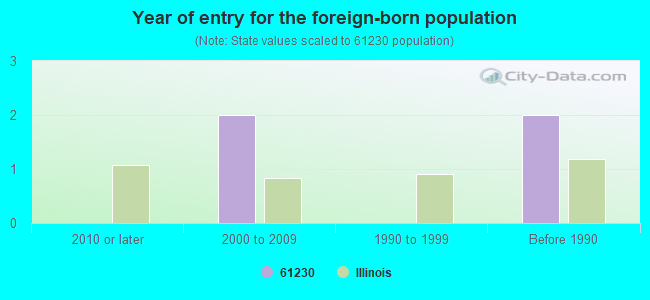
Year of entry for the foreign-born population
02010 or later
22000 to 2009
01990 to 1999
2Before 1990
Facilities with environmental interests located in this zip code:
GROWMARK INC (RTE 84 4 MI S OF ALBANY in ALBANY, IL)
STATE MASTER (Illinois EPA Project) - SOLID WASTE PROGRAM, AIR PROGRAM STATE MASTER (Illinois EPA Project) - SOLID WASTE PROGRAM, HAZARDOUS WASTE PROGRAM AIR MINOR (AIRS/AFS) (Integrated Compliance Information System) - ICIS-05-1980-0021, FORMAL ENFORCEMENT ACTION Large Quantity Generators, more that 1000 kg of hazardous waste/month (Resource Conservation and Recovery Act (tracking hazardous waste)) - notification Business SIC classification: TRUCKING, EXCEPT LOCAL; PETROLEUM BULK STATIONS AND TERMINALS
RIVERSTONE GROUP, INC (SEC. 11, T. 20N.-R, 2E in ALBANY, IL)
STATE MASTER (Illinois EPA Project) - AIR PROGRAM AIR MINOR (AIRS/AFS) CRITERIA AND HAZARDOUS AIR POLLUTANT INVENTORY (Inventory of air pollution sources) Business SIC classification: CRUSHED AND BROKEN LIMESTONE Alternative names: MOLINE CONSUMERS COMPANY MOMAHON MC08
ALBANY ELEM SCHOOL (511 THIRD AVE N in ALBANY, IL)
(National Center for Education Statistics) - STATE ID-5509800202003 Organizations: RIVER BEND COMM UNIT DIST 2 (SCHOOL DISTRICT)
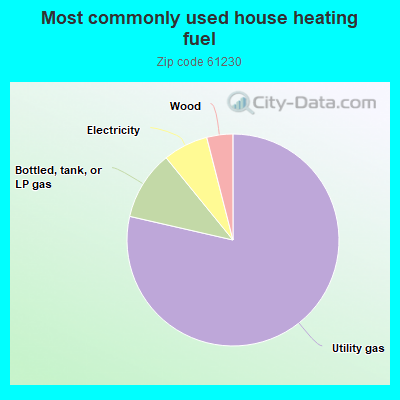
78.9%Utility gas
10.6%Bottled, tank, or LP gas
6.9%Electricity
4.0%Wood
Population in 1990: 1,287.
Place of birth for U.S.-born residents:
This state: 305
Northeast: 2
Midwest: 585
South: 21
West: 5
59% of the 61230 zip code residents lived in the same house 5 years ago. Out of people who lived in different houses, 60% lived in this county. Out of people who lived in different counties, 50% lived in Illinois.
87% of the 61230 zip code residents lived in the same house 1 year ago. Out of people who lived in different houses, 67% moved from this county. Out of people who lived in different houses, 22% moved from different county within same state. Out of people who lived in different houses, 6% moved from different state.
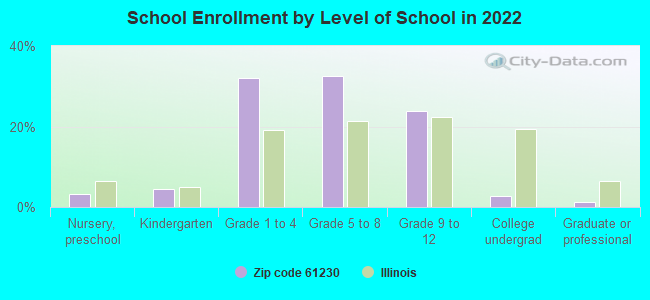
Private vs. public school enrollment:
Students in private schools in grades 1 to 8 (elementary and middle school): 11
Here:
7.9%
Illinois:
13.3%
Students in private schools in grades 9 to 12 (high school): 22
Here:
42.9%
Illinois:
9.9%
Students in private undergraduate colleges: 2
Here:
43.8%
Illinois:
27.4%
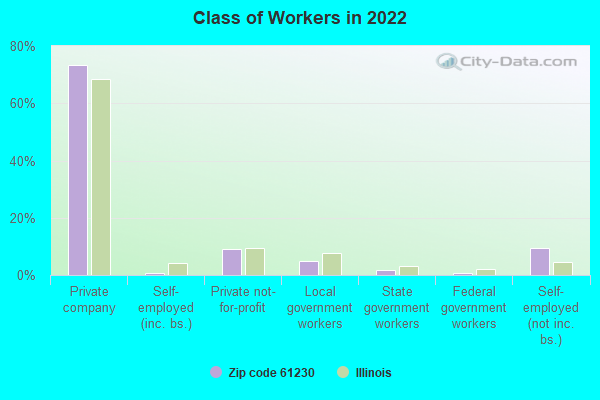
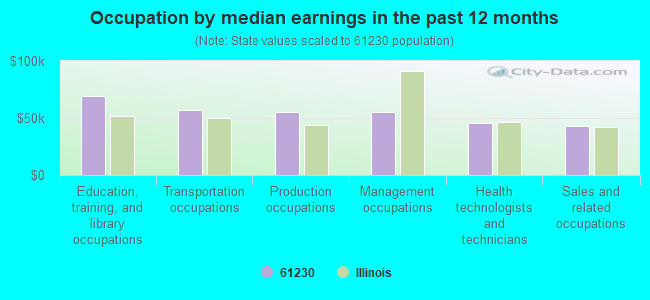
Occupation by median earnings in the past 12 months ($)
69,228Education, training, and library occupations
57,216Transportation occupations
55,175Production occupations
55,050Management occupations
45,970Health technologists and technicians
42,944Sales and related occupations
Top industries in this zip code by the number of employees in 2005:
Finance and Insurance: Commercial Banking (10-19 employees: 1 establishment)
Accommodation and Food Services: Full-Service Restaurants (5-9: 1, 1-4: 1)
Wholesale Trade: Grain and Field Bean Merchant Wholesalers (5-9: 1)
Arts, Entertainment, and Recreation: Bowling Centers (5-9: 1)
Other Services (except Public Administration): Coin-Operated Laundries and Drycleaners (1-4: 1)
Information: Libraries and Archives (1-4: 1)
Wholesale Trade: Other Grocery and Related Products Merchant Wholesalers (1-4: 1)
2002 - 2018 National Fire Incident Reporting System (NFIRS) incidents
Based on the data from the years 2002 - 2018 the average number of fire incidents per year is 9. The highest number of fires - 22 took place in 2007, and the least - 2 in 2009. The data has a growing trend.
When looking into fire subcategories, the most reports belonged to: Outside Fires (35.3%), and Other (32.1%).
Fire incident types reported to NFIRS in Zip Code 61230


 Nearest zip codes: 61242, 61250, 52730, 61252, 61251, 61257.
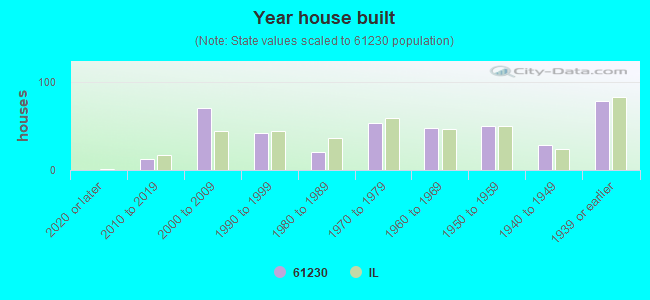


 Based on the data from the years 2002 - 2018 the average number of fire incidents per year is 9. The highest number of fires - 22 took place in 2007, and the least - 2 in 2009. The data has a growing trend.
 When looking into fire subcategories, the most reports belonged to: Outside Fires (35.3%), and Other (32.1%).