Estimated zip code population in 2022: 43,400 Zip code population in 2010: 45,099 Zip code population in 2000: 46,646
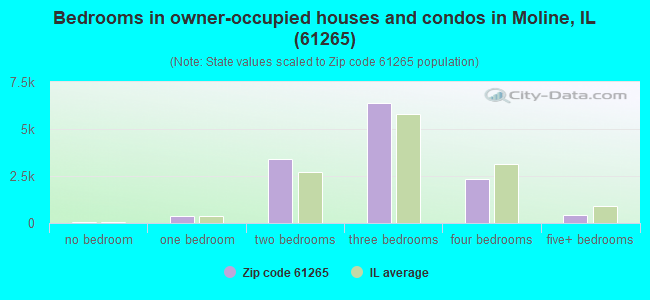
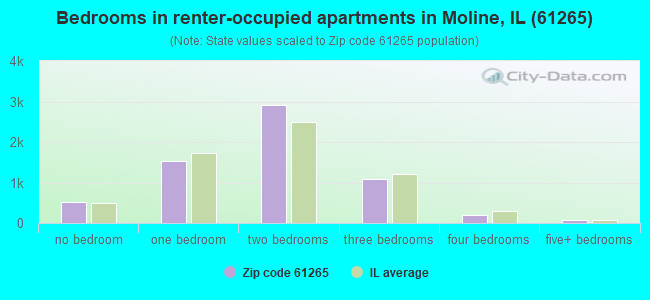
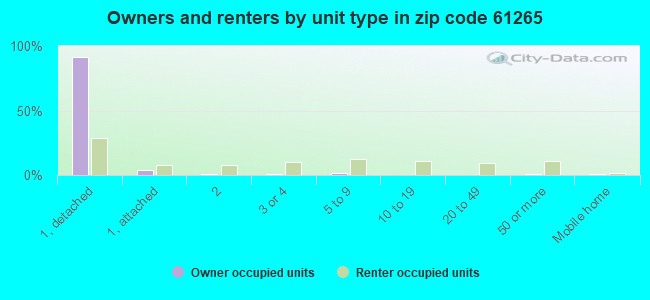
Houses and condos: 20,682 Renter-occupied apartments: 6,279
% of renters here:
33%
State:
33%
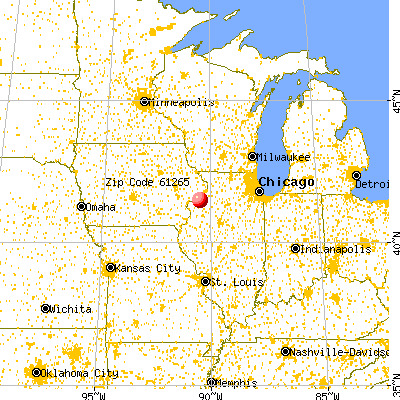
March 2022 cost of living index in zip code 61265: 84.8 (less than average, U.S. average is 100)
Land area: 18.9 sq. mi. Water area: 1.4 sq. mi.
Population density: 2,292 people per square mile
(low).
OSM Map
General Map
Google Map
MSN Map
OSM Map
General Map
Google Map
MSN Map
OSM Map
General Map
Google Map
MSN Map
OSM Map
General Map
Google Map
MSN Map
Please wait while loading the map...
Real estate property taxes paid for housing units in 2022:
This zip code:
2.2% ($3,181)
Illinois:
2.0% ($4,912)
Median real estate property taxes paid for housing units with mortgages in 2022: $3,228 (2.2%) Median real estate property taxes paid for housing units with no mortgage in 2022: $3,052 (2.0%)
Averages for the 2020 tax year for zip code 61265, filed in 2021:
Average Adjusted Gross Income (AGI) in 2020: $57,806 (Individual Income Tax Returns)
Here:
$57,806
State:
$82,626
Salary/wage: $46,892 (reported on 81.8% of returns)
Here:
$46,892
State:
$66,640
(% of AGI for various income ranges: 1103.7% for AGIs below $25k, 3340.7% for AGIs $25k-50k, 5829.4% for AGIs $50k-75k, 8063.2% for AGIs $75k-100k, 14873.8% for AGIs $100k-200k, 66833.5% for AGIs over 200k)
Taxable interest for individuals: $1,592 (reported on 31.2% of returns)
This zip code:
$1,592
Illinois:
$2,376
(% of AGI for various income ranges: 17.1% for AGIs below $25k, 19.0% for AGIs $25k-50k, 42.9% for AGIs $50k-75k, 101.4% for AGIs $75k-100k, 173.2% for AGIs $100k-200k, 2200.0% for AGIs over 200k)
Ordinary dividends: $6,057 (reported on 17.1% of returns)
Here:
$6,057
State:
$9,061
(% of AGI for various income ranges: 18.0% for AGIs below $25k, 28.2% for AGIs $25k-50k, 79.9% for AGIs $50k-75k, 177.3% for AGIs $75k-100k, 414.8% for AGIs $100k-200k, 5526.5% for AGIs over 200k)
Net capital gain/loss in AGI: +$14,125 (reported on 13.9% of returns)
Here:
+$14,125
State:
+$31,684
(% of AGI for various income ranges: 9.2% for AGIs below $25k, 25.0% for AGIs $25k-50k, 56.5% for AGIs $50k-75k, 171.4% for AGIs $75k-100k, 474.9% for AGIs $100k-200k, 17846.5% for AGIs over 200k)
Profit/loss from business: +$12,484 (reported on 10.2% of returns)
Here:
+$12,484
State:
+$12,175
(% of AGI for various income ranges: 64.0% for AGIs below $25k, 74.4% for AGIs $25k-50k, 115.5% for AGIs $50k-75k, 115.0% for AGIs $75k-100k, 443.6% for AGIs $100k-200k, 5360.6% for AGIs over 200k)
Taxable individual retirement arrangement distribution: $17,608 (reported on 9.9% of returns)
61265:
$17,608
Illinois:
$21,613
(% of AGI for various income ranges: 49.6% for AGIs below $25k, 81.5% for AGIs $25k-50k, 165.7% for AGIs $50k-75k, 342.8% for AGIs $75k-100k, 806.4% for AGIs $100k-200k, 5804.1% for AGIs over 200k)
Self-employed (Keogh) retirement plans: $23,217 (reported on 0.3% of returns)
61265:
$23,217
Illinois:
$30,962
(% of AGI for various income ranges: 38.5% for AGIs $100k-200k, 477.6% for AGIs over 200k)
Total itemized deductions: $32,722 (reported on 4.0% of returns)
Here:
$32,722
State:
$34,948
(% of AGI for various income ranges: 19.1% for AGIs below $25k, 55.5% for AGIs $25k-50k, 151.4% for AGIs $50k-75k, 304.8% for AGIs $75k-100k, 543.2% for AGIs $100k-200k, 4962.4% for AGIs over 200k)
Charity contributions: $14,394 (reported on 3.0% of returns)
Here:
$14,394
State:
$13,122
(% of AGI for various income ranges: 2.0% for AGIs below $25k, 6.8% for AGIs $25k-50k, 25.1% for AGIs $50k-75k, 66.1% for AGIs $75k-100k, 184.4% for AGIs $100k-200k, 2711.2% for AGIs over 200k)
Taxes paid: $7,500 (reported on 3.9% of returns)
61265:
$7,500
State:
$8,563
(% of AGI for various income ranges: 3.1% for AGIs below $25k, 9.5% for AGIs $25k-50k, 34.6% for AGIs $50k-75k, 76.9% for AGIs $75k-100k, 150.5% for AGIs $100k-200k, 898.8% for AGIs over 200k)
Earned income credit: $2,302 (reported on 17.3% of returns)
Here:
$2,302
State:
$2,311
(% of AGI for various income ranges: 92.0% for AGIs below $25k, 67.0% for AGIs $25k-50k, 1.2% for AGIs $50k-75k)
Percentage of individuals using paid preparers for their 2020 taxes: 93.1%
Here:
93%
State:
93%
(% for various income ranges: 92.0% for AGIs below $25k, 93.3% for AGIs $25k-50k, 93.9% for AGIs $50k-75k, 93.7% for AGIs $75k-100k, 93.4% for AGIs $100k-200k, 94.7% for AGIs over 200k)
Averages for the 2012 tax year for zip code 61265, filed in 2013:
Average Adjusted Gross Income (AGI) in 2012: $53,311 (Individual Income Tax Returns)
Here:
$53,311
State:
$68,058
Salary/wage: $44,264 (reported on 84.0% of returns)
Here:
$44,264
State:
$55,396
(% of AGI for various income ranges: 76.5% for AGIs below $25k, 76.8% for AGIs $25k-50k, 74.5% for AGIs $50k-75k, 73.7% for AGIs $75k-100k, 70.6% for AGIs $100k-200k, 53.1% for AGIs over 200k)
Taxable interest for individuals: $1,371 (reported on 36.9% of returns)
This zip code:
$1,371
Illinois:
$1,969
(% of AGI for various income ranges: 1.1% for AGIs below $25k, 0.8% for AGIs $25k-50k, 0.6% for AGIs $50k-75k, 0.8% for AGIs $75k-100k, 0.8% for AGIs $100k-200k, 1.5% for AGIs over 200k)
Ordinary dividends: $6,461 (reported on 19.7% of returns)
Here:
$6,461
State:
$7,786
(% of AGI for various income ranges: 1.3% for AGIs below $25k, 1.0% for AGIs $25k-50k, 1.3% for AGIs $50k-75k, 1.3% for AGIs $75k-100k, 2.1% for AGIs $100k-200k, 5.9% for AGIs over 200k)
Net capital gain/loss in AGI: +$8,973 (reported on 14.4% of returns)
Here:
+$8,973
State:
+$22,183
(% of AGI for various income ranges: 0.2% for AGIs $25k-50k, 0.4% for AGIs $50k-75k, 0.7% for AGIs $75k-100k, 1.3% for AGIs $100k-200k, 9.6% for AGIs over 200k)
Profit/loss from business: +$12,560 (reported on 9.7% of returns)
Here:
+$12,560
State:
+$12,903
(% of AGI for various income ranges: 3.3% for AGIs below $25k, 1.6% for AGIs $25k-50k, 1.4% for AGIs $50k-75k, 1.5% for AGIs $75k-100k, 2.4% for AGIs $100k-200k, 3.6% for AGIs over 200k)
Taxable individual retirement arrangement distribution: $12,158 (reported on 11.2% of returns)
61265:
$12,158
Illinois:
$17,929
(% of AGI for various income ranges: 2.5% for AGIs below $25k, 2.3% for AGIs $25k-50k, 2.3% for AGIs $50k-75k, 2.5% for AGIs $75k-100k, 3.0% for AGIs $100k-200k, 2.5% for AGIs over 200k)
Self-employment retirement plans: $19,436 (reported on 0.5% of returns)
61265:
$19,436
Illinois:
$24,666
(% of AGI for various income ranges: 0.1% for AGIs $25k-50k, 0.2% for AGIs $100k-200k, 0.5% for AGIs over 200k)
Total itemized deductions: $19,801 (18% of AGI, reported on 25.0% of returns)
Here:
$19,801
State:
$26,433
Here:
17.7% of AGI
State:
19.2% of AGI
(% of AGI for various income ranges: 5.5% for AGIs below $25k, 7.2% for AGIs $25k-50k, 8.8% for AGIs $50k-75k, 9.6% for AGIs $75k-100k, 11.8% for AGIs $100k-200k, 10.3% for AGIs over 200k)
Charity contributions: $4,317 (reported on 18.8% of returns)
Here:
$4,317
State:
$4,525
(% of AGI for various income ranges: 0.4% for AGIs below $25k, 0.8% for AGIs $25k-50k, 1.1% for AGIs $50k-75k, 1.4% for AGIs $75k-100k, 2.1% for AGIs $100k-200k, 2.5% for AGIs over 200k)
Taxes paid: $8,977 (reported on 24.9% of returns)
61265:
$8,977
State:
$11,968
(% of AGI for various income ranges: 1.3% for AGIs below $25k, 2.3% for AGIs $25k-50k, 3.5% for AGIs $50k-75k, 4.0% for AGIs $75k-100k, 5.8% for AGIs $100k-200k, 6.1% for AGIs over 200k)
Earned income credit: $2,264 (reported on 18.1% of returns)
Here:
$2,264
State:
$2,349
(% of AGI for various income ranges: 6.1% for AGIs below $25k, 1.0% for AGIs $25k-50k)
Percentage of individuals using paid preparers for their 2012 taxes: 54.6%
Here:
55%
State:
57%
(% for various income ranges: 47.7% for AGIs below $25k, 54.5% for AGIs $25k-50k, 58.8% for AGIs $50k-75k, 62.2% for AGIs $75k-100k, 65.7% for AGIs $100k-200k, 77.8% for AGIs over 200k)
Averages for the 2004 tax year for zip code 61265, filed in 2005:
Average Adjusted Gross Income (AGI) in 2004: $44,931 (Individual Income Tax Returns)
Here:
$44,931
State:
$54,625
Salary/wage: $39,198 (reported on 82.6% of returns)
Here:
$39,198
State:
$46,811
(% of AGI for various income ranges: 115.4% for AGIs below $10k, 72.8% for AGIs $10k-25k, 76.7% for AGIs $25k-50k, 77.2% for AGIs $50k-75k, 77.4% for AGIs $75k-100k, 62.7% for AGIs over 100k)
Taxable interest for individuals: $1,946 (reported on 48.0% of returns)
This zip code:
$1,946
Illinois:
$2,101
(% of AGI for various income ranges: 7.6% for AGIs below $10k, 2.7% for AGIs $10k-25k, 1.8% for AGIs $25k-50k, 1.6% for AGIs $50k-75k, 1.8% for AGIs $75k-100k, 2.2% for AGIs over 100k)
Taxable dividends: $4,018 (reported on 25.7% of returns)
Here:
$4,018
State:
$4,306
(% of AGI for various income ranges: 5.4% for AGIs below $10k, 1.5% for AGIs $10k-25k, 1.2% for AGIs $25k-50k, 1.3% for AGIs $50k-75k, 1.5% for AGIs $75k-100k, 3.8% for AGIs over 100k)
Net capital gain/loss: +$5,296 (reported on 19.9% of returns)
Here:
+$5,296
State:
+$17,321
(% of AGI for various income ranges: -1.1% for AGIs below $10k, 0.1% for AGIs $10k-25k, 0.3% for AGIs $25k-50k, 0.7% for AGIs $50k-75k, 1.3% for AGIs $75k-100k, 5.5% for AGIs over 100k)
Profit/loss from business: +$12,431 (reported on 10.0% of returns)
Here:
+$12,431
State:
+$11,771
(% of AGI for various income ranges: 3.1% for AGIs below $10k, 2.6% for AGIs $10k-25k, 2.1% for AGIs $25k-50k, 1.3% for AGIs $50k-75k, 1.8% for AGIs $75k-100k, 4.3% for AGIs over 100k)
IRA payment deduction: $2,941 (reported on 1.9% of returns)
61265:
$2,941
Illinois:
$3,087
(% of AGI for various income ranges: 0.3% for AGIs below $10k, 0.1% for AGIs $10k-25k, 0.2% for AGIs $25k-50k, 0.1% for AGIs $50k-75k, 0.1% for AGIs $75k-100k, 0.1% for AGIs over 100k)
Self-employed pension: $15,961 (reported on 0.7% of returns)
Here:
$15,961
Illinois:
$16,965
(% of AGI for various income ranges: 0.0% for AGIs $25k-50k, 0.1% for AGIs $50k-75k, 0.1% for AGIs $75k-100k, 0.6% for AGIs over 100k)
Total itemized deductions: $16,824 (18% of AGI, reported on 26.3% of returns)
Here:
$16,824
State:
$20,239
Here:
17.8% of AGI
State:
19.5% of AGI
(% of AGI for various income ranges: 10.8% for AGIs below $10k, 6.7% for AGIs $10k-25k, 8.4% for AGIs $25k-50k, 10.3% for AGIs $50k-75k, 11.5% for AGIs $75k-100k, 10.7% for AGIs over 100k)
Charity contributions deductions: $4,024 (4% of AGI, reported on 21.9% of returns)
Here:
$4,024
State:
$3,719
Here:
3.9% of AGI
State:
3.4% of AGI
(% of AGI for various income ranges: 0.7% for AGIs below $10k, 0.7% for AGIs $10k-25k, 1.1% for AGIs $25k-50k, 1.6% for AGIs $50k-75k, 2.0% for AGIs $75k-100k, 3.1% for AGIs over 100k)
Total tax: $7,616 (reported on 73.8% of returns)
61265:
$7,616
State:
$9,882
(% of AGI for various income ranges: 2.3% for AGIs below $10k, 3.8% for AGIs $10k-25k, 7.0% for AGIs $25k-50k, 9.2% for AGIs $50k-75k, 11.0% for AGIs $75k-100k, 20.8% for AGIs over 100k)
Earned income credit: $1,636 (reported on 15.3% of returns)
Here:
$1,636
State:
$1,788
Percentage of individuals using paid preparers for their 2004 taxes: 55.3%
Here:
55%
State:
61%
(% for various income ranges: 46.2% for AGIs below $10k, 55.1% for AGIs $10k-25k, 56.3% for AGIs $25k-50k, 59.1% for AGIs $50k-75k, 59.3% for AGIs $75k-100k, 67.2% for AGIs over 100k)
Likely homosexual households (counted as self-reported same-sex unmarried-partner households)
Lesbian couples: 0.1% of all households
Gay men: 0.3% of all households
Household received Food Stamps/SNAP in the past 12 months: 3,299 Household did not receive Food Stamps/SNAP in the past 12 months: 16,081
Women who had a birth in the past 12 months: 474 (236 now married, 239 unmarried) Women who did not have a birth in the past 12 months: 9,003 (3,839 now married, 5,153 unmarried)
Housing units in zip code 61265 with a mortgage: 7,529 (656 second mortgage, 5 home equity loan, 493 both second mortgage and home equity loan) Houses without a mortgage: 243
Median monthly owner costs for units with a mortgage: $1,179 Median monthly owner costs for units without a mortgage: $623
Residents with income below the poverty level in 2022:
This zip code:
15.3%
Whole state:
11.9%
Residents with income below 50% of the poverty level in 2022:
This zip code:
8.0%
Whole state:
5.7%
Median number of rooms in houses and condos:
Here:
6.3
State:
6.4
Median number of rooms in apartments:
Here:
4.1
State:
4.1
Notable locations in this zip code not listed on our city pages
5,417 married couples with children.
3,290 single-parent households (878 men, 2,412 women).
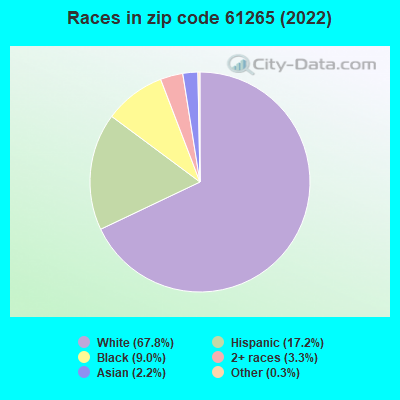
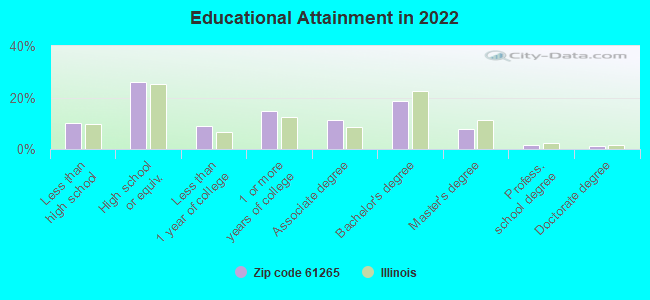
84.3% of residents of 61265 zip code speak English at home.
10.7% of residents speak Spanish at home (60% very well, 24% well, 10% not well, 6% not at all).
2.8% of residents speak other Indo-European language at home (56% very well, 41% well, 3% not well).
1.2% of residents speak Asian or Pacific Island language at home (58% very well, 27% well, 12% not well, 3% not at all).
0.9% of residents speak other language at home (58% very well, 23% well, 12% not well, 7% not at all).
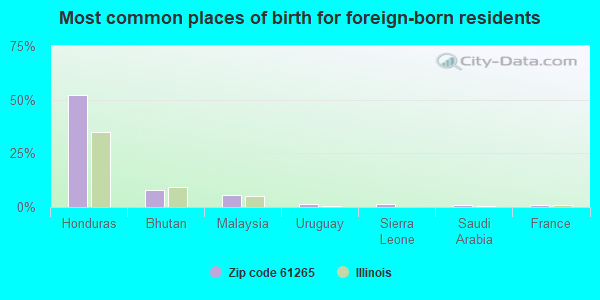
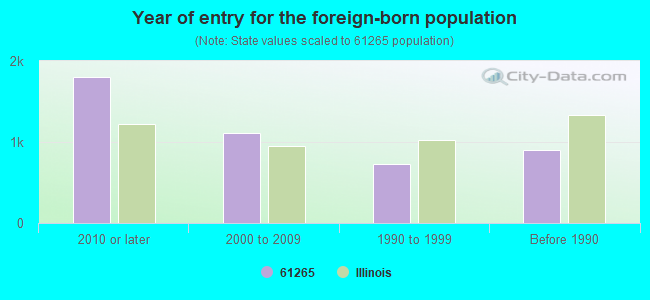
Foreign born population: 3,806 (8.8%) (40.6% of them are naturalized citizens)
Major facilities with environmental interests located in this zip code:
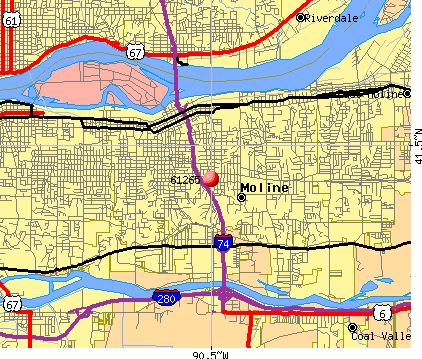
MOLINE FORGE INC (4101 FOURTH AVENUE in MOLINE, IL)
STATE MASTER (Illinois EPA Project) - SOLID WASTE PROGRAM, HAZARDOUS WASTE PROGRAM, AIR PROGRAM STATE MASTER (Illinois EPA Project) - National Pollutant Discharge Elimination System Permit AIR MINOR (AIRS/AFS) CRITERIA AND HAZARDOUS AIR POLLUTANT INVENTORY (Inventory of air pollution sources) National Pollutant Discharge Elimination System NON-MAJOR (Tracking pollutant discharge elimination systems) - permit Conditionally Exempt Small Quantity Generators, less than 100 kg/month of hazardous waste (Resource Conservation and Recovery Act (tracking hazardous waste)) - notification Business SIC classification: IRON AND STEEL FORGINGS Business NAICS classification: IRON AND STEEL FORGING. Organizations: MOLINE FORGE, INC. (CONTACT/OWNER)
QUAD CITY DIE CASTING COMPANY (3800 RIVER DRIVE in MOLINE, IL)
STATE MASTER (Illinois EPA Project) - SOLID WASTE PROGRAM, AIR PROGRAM AIR MINOR (AIRS/AFS) - ICIS-, ENFORCEMENT/COMPLIANCE ACTIVITY CRITERIA AND HAZARDOUS AIR POLLUTANT INVENTORY (Inventory of air pollution sources) National Pollutant Discharge Elimination System NON-MAJOR (Tracking pollutant discharge elimination systems) - permit TRI REPORTER (Tracking of toxic chemicals releasing facilities) Business SIC classification: ALUMINUM DIE-CASTINGS; NONCLASSIFIABLE ESTABLISHMENTS Organizations: DREW S DEBREY (CONTACT/OWNER)
MCLAUGHLIN BODY CO (2430 RIVER DR in MOLINE, IL)
STATE MASTER (Illinois EPA Project) - SOLID WASTE PROGRAM, HAZARDOUS WASTE PROGRAM, SCRAP TIRE MANAGEMENT National Pollutant Discharge Elimination System NON-MAJOR (Tracking pollutant discharge elimination systems) - permit National Pollutant Discharge Elimination System NON-MAJOR (Tracking pollutant discharge elimination systems) - permit HAZARDOUS WASTE BIENNIAL REPORTER (Resource Conservation and Recovery Act (tracking hazardous waste)) (Resource Conservation and Recovery Act (tracking hazardous waste)) Organizations: MCLAUGHLIN BODY COMPANY (CONTACT/OWNER)
KONE INC (1 MONTGOMERY COURT in MOLINE, IL)
STATE MASTER (Illinois EPA Project) - SOLID WASTE PROGRAM, HAZARDOUS WASTE PROGRAM, AIR PROGRAM AIR MINOR (AIRS/AFS) CRITERIA AND HAZARDOUS AIR POLLUTANT INVENTORY (Inventory of air pollution sources) National Pollutant Discharge Elimination System NON-MAJOR (Tracking pollutant discharge elimination systems) - permit (Resource Conservation and Recovery Act (tracking hazardous waste)) Business SIC classification: ELEVATORS AND MOVING STAIRWAYS Business NAICS classification: ELEVATOR AND MOVING STAIRWAY MANUFACTURING. Organizations: MONTGOMERY KONE, INC. (CONTACT/OWNER)
, KONE HOLDINGS INC (CONTACT/OWNER)
Alternative names: MONTGOMERY KONE, INC.
RIVERSTONE GROUP, INC (2357 3RD AVE. in MOLINE, IL)
STATE MASTER (Illinois EPA Project) - AIR PROGRAM STATE MASTER (Illinois EPA Project) - National Pollutant Discharge Elimination System Permit AIR MINOR (AIRS/AFS) CRITERIA AND HAZARDOUS AIR POLLUTANT INVENTORY (Inventory of air pollution sources) Business SIC classification: READY-MIXED CONCRETE Business NAICS classification: READY-MIX CONCRETE MANUFACTURING. Alternative names: MOLINE CONSUMERS COMPANY R M CONCRETE DIVISION
MIDLAND IRON AND STEEL CORP (3301 4TH AVE in MOLINE, IL)
STATE MASTER (Illinois EPA Project) - SOLID WASTE PROGRAM, SCRAP TIRE MANAGEMENT, AIR PROGRAM AIR MINOR (AIRS/AFS) National Pollutant Discharge Elimination System NON-MAJOR (Tracking pollutant discharge elimination systems) - permit Business SIC classification: SCRAP AND WASTE MATERIALS Organizations: MIDLAND DAVIS CORPORATION (CONTACT/OWNER)
JOHN DEERE HARVESTER EAST MOLINE (501 RIVER DRIVE in MOLINE, IL)
AIR MAJOR (AIRS/AFS) SUPERFUND (Superfund database) CRITERIA AND HAZARDOUS AIR POLLUTANT INVENTORY (Inventory of air pollution sources) National Pollutant Discharge Elimination System NON-MAJOR (Tracking pollutant discharge elimination systems) - permit HAZARDOUS WASTE BIENNIAL REPORTER (Resource Conservation and Recovery Act (tracking hazardous waste)) Large Quantity Generators, more that 1000 kg of hazardous waste/month (Resource Conservation and Recovery Act (tracking hazardous waste)) - notification USED OIL PROGRAM (Resource Conservation and Recovery Act (tracking hazardous waste)) TRI REPORTER (Tracking of toxic chemicals releasing facilities) Business SIC and NAICS classification: FARM MACHINERY AND EQUIPMENT Organizations: JOHN DEERE HARVESTER-MOLINE (CONTACT/OPERATOR)
Alternative names: DEERE JOHN HARVESTER MOLINE, DEERE JOHN PLOW & PLANTER WKS, DEERE PLOW AND PLANTER WORKS, JOHN DEERE HARVESTER-MOLINE, JOHN DEERE HARVESTER MOLINE MOLINE, JOHN DEERE SEEDING CYLINDER
METROPOLITAN MEDICAL LABS (1520 7TH ST in MOLINE, IL)
STATE MASTER (Illinois EPA Project) - HAZARDOUS WASTE PROGRAM Conditionally Exempt Small Quantity Generators, less than 100 kg/month of hazardous waste (Resource Conservation and Recovery Act (tracking hazardous waste)) - notification (Resource Conservation and Recovery Act (tracking hazardous waste)) Organizations: ARNELL PAULA Y (CONTACT/OWNER)
Alternative names: MARTIN CLINICAL LABORATORY
HARRINGTON SIGNAL INC (2519 FOURTH AVENUE in MOLINE, IL)
STATE MASTER (Illinois EPA Project) - SOLID WASTE PROGRAM, HAZARDOUS WASTE PROGRAM, AIR PROGRAM AIR MINOR (AIRS/AFS) Small Quantity Generators, between 100 kg and 1000 kg of hazardous waste/month (Resource Conservation and Recovery Act (tracking hazardous waste)) - notification Business SIC classification: ELECTRONIC COMPONENTS Organizations: OPPENHEIMER GENE (CONTACT/OWNER)
MOLINE COMBUSTION TURBINES (100 SECOND ST in MOLINE, IL)
STATE MASTER (Illinois EPA Project) - SOLID WASTE PROGRAM, AIR PROGRAM AIR MAJOR (AIRS/AFS) AIR PROGRAM (Clean Air Markets Division Business System) CRITERIA AND HAZARDOUS AIR POLLUTANT INVENTORY (Inventory of air pollution sources) Small Quantity Generators, between 100 kg and 1000 kg of hazardous waste/month (Resource Conservation and Recovery Act (tracking hazardous waste)) - notification Business SIC classification: ELECTRIC SERVICES Alternative names: IOWA-ILLINOIS GAS & ELECTRIC CO, MIDAMERICAN ENERGY COMPANY MOLINE COMBUSTION
MOLINE PLACE DEVELOPMENT LLC (635 10TH AVE in MOLINE, IL)
STATE MASTER (Illinois EPA Project) - SOLID WASTE PROGRAM, AIR PROGRAM, HAZARDOUS WASTE PROGRAM AIR MINOR (AIRS/AFS) Conditionally Exempt Small Quantity Generators, less than 100 kg/month of hazardous waste (Resource Conservation and Recovery Act (tracking hazardous waste)) - notification Business SIC classification: AUTOMATIC CONTROLS FOR REGULATING RESIDENTIAL AND COMMERCIAL ENVIRONMENTS AND APPLIANCES Organizations: TRINITY MEDICAL CENTER (CONTACT/OWNER)
Alternative names: TRINITY MEDICAL CENTER, UNITED MEDICAL CENTER
MORSE PROPERTY (4912 7TH ST in MOLINE, IL)
STATE MASTER (Illinois EPA Project) - SCRAP TIRE MANAGEMENT (Resource Conservation and Recovery Act (tracking hazardous waste)) Organizations: ROBERT MORSE (CONTACT/OPERATOR)
Alternative names: MORSE, ROBERT
PPG INDUSTRIES INC (3407 23RD AVE in MOLINE, IL)
STATE MASTER (Illinois EPA Project) - SOLID WASTE PROGRAM (Resource Conservation and Recovery Act (tracking hazardous waste)) Alternative names: PPG INDUSTRIES INC LOC NO 1186
Housing units lacking complete plumbing facilities: 1.6% Housing units lacking complete kitchen facilities: 2.1%
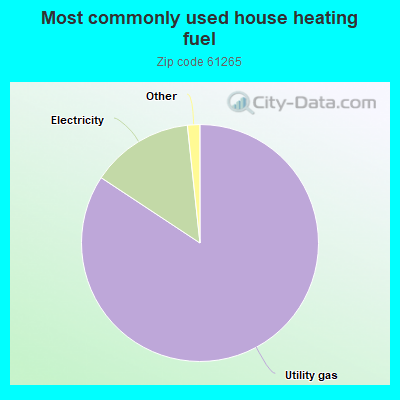
84.3%Utility gas
14.0%Electricity
0.9%Bottled, tank, or LP gas
0.7%No fuel used
Population in 1990: 45,240. Population change in the 1990s: +1,406 (+3.1%).
Place of birth for U.S.-born residents:
This state: 28,002
Northeast: 771
Midwest: 7,550
South: 1,771
West: 892
58% of the 61265 zip code residents lived in the same house 5 years ago. Out of people who lived in different houses, 67% lived in this county. Out of people who lived in different counties, 50% lived in Illinois.
89% of the 61265 zip code residents lived in the same house 1 year ago. Out of people who lived in different houses, 59% moved from this county. Out of people who lived in different houses, 18% moved from different county within same state. Out of people who lived in different houses, 20% moved from different state. Out of people who lived in different houses, 2% moved from abroad.
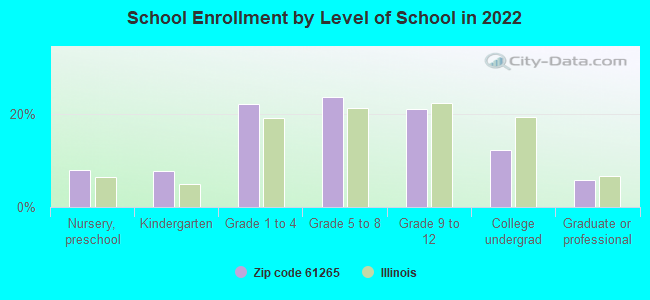
Private vs. public school enrollment:
Students in private schools in grades 1 to 8 (elementary and middle school): 549
Here:
12.5%
Illinois:
13.3%
Students in private schools in grades 9 to 12 (high school): 292
Here:
14.6%
Illinois:
9.9%
Students in private undergraduate colleges: 250
Here:
21.3%
Illinois:
27.4%
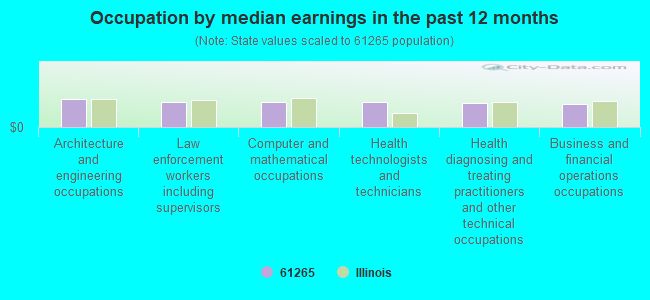
Occupation by median earnings in the past 12 months ($)
72,395Architecture and engineering occupations
65,881Law enforcement workers including supervisors
65,177Computer and mathematical occupations
64,309Health technologists and technicians
61,331Health diagnosing and treating practitioners and other technical occupations
59,122Business and financial operations occupations
Companies with biggest federal contracts located in this zip code (MOLINE, IL):
DEERE & COMPANY (1515 5TH AVE; small business) : $2,958,346 in 32 contractsfrom 2000 to 2006
Contracts for Earth Moving and Excavating Equipment, Tractors, Wheeled, Plate, Sheet, Strip, Foil; and Leaf, Miscellaneous Engine Accessories, Nonaircraft, and moreby Defense Logistics Agency, U.S. Army Corps of Engineers - civil program financing only, U.S. Fish and Wildlife Service Signed by year:2000: $658,298; 2001: $229,047; 2002: $842,902; 2003: $247,154; 2004: $516,944; 2005: $383,394; 2006: $80,607.
Biggest contracts:
$583,271 with Defense Logistics Agency for Earth Moving and Excavating Equipment. Taking place in KS. Signed on 2002-07-19. Completion date: 2003-03-09.
$549,121 with Defense Logistics Agency for Tractors, Wheeled. Taking place in KY. Signed on 2000-03-12. Completion date: 2000-09-29.
$196,830 with Defense Logistics Agency for Earth Moving and Excavating Equipment. Taking place in KS. Signed on 2004-07-01. Completion date: 2004-12-29.
$141,104, same as above.Signed on 2002-09-30. Completion date: 2003-03-09.
DEERE &COMPANY (ONE JOHN DEERE PLACE) : $1,629,438 in 3 contractsfrom 2004 to 2005
$855,000 with Army for Other Modal Transportation -- Basic Research (R&D). Signed on 2005-06-14. Completion date: 2006-06-14.
$742,955, same as above.Signed on 2004-09-24. Completion date: 2005-09-24.
$31,483 with Army for Maintenance, Repair and Rebuilding of Equipment -- Ground Effect Vehicles, Motor Vehicles, Trailers, and Cycles. Signed on 2005-01-13. Completion date: 2005-01-22.
KONE INC (1801 RIVER DRIVE) : $1,307,012 in 15 contractsfrom 2000 to 2006
Contracts for Maintenance, Repair and Rebuilding of Equipment -- Materials Handling Equipment, Maintenance, Repair or Alteration of Real Property -- Miscellaneous Buildings, Maintenance, Repair and Rebuilding of Equipment -- Miscellaneous, Maintenance, Repair and Rebuilding of Equipment -- Metalworking Machinery by Army Signed by year:2000: $166,006; 2001: $162,480; 2002: $179,571; 2003: $276,508; 2004: $229,455; 2005: $144,696; 2006: $148,296.
Biggest contracts:
$186,727 with Army for Maintenance, Repair and Rebuilding of Equipment -- Materials Handling Equipment. Taking place in HI. Signed on 2004-01-13. Completion date: 2004-09-30.
$162,480 with Army for Maintenance, Repair or Alteration of Real Property -- Miscellaneous Buildings. Signed on 2001-05-29. Completion date: 2001-11-23.
$149,292 with Army for Maintenance, Repair and Rebuilding of Equipment -- Miscellaneous. Signed on 2002-06-26. Completion date: 2003-06-30.
$148,296, same as above.Signed on 2006-06-23. Effective on 2006-06-21. Completion date: 2007-06-30.
MCLAUGHLIN BODY CO (2430RIVER DRIVE; small business) : $1,207,573 in 12 contractsfrom 2004 to 2006
Contracts for Vehicular Cab, Body, and Frame Structural Components, Maintenance, Repair and Rebuilding of Equipment -- Vehicular Equipment Components, Technology Sharing/Utilization Services, Modification of Equipment -- Ground Effect Vehicles, Motor Vehicles, Trailers, and Cycles by Army Signed by year:2000: $0; 2001: $0; 2002: $0; 2003: $0; 2004: $153,048; 2005: $1,058,875; 2006: -$4,350.
Biggest contracts:
$1,016,520 with Army for Vehicular Cab, Body, and Frame Structural Components. Signed on 2005-10-27. Completion date: 2006-05-01.
$70,596 with Army for Maintenance, Repair and Rebuilding of Equipment -- Vehicular Equipment Components. Signed on 2004-03-19. Completion date: 2004-04-30.
$42,355 with Army for Vehicular Cab, Body, and Frame Structural Components. Signed on 2005-07-14. Completion date: 2005-09-01.
$23,783 with Army for Maintenance, Repair and Rebuilding of Equipment -- Vehicular Equipment Components. Signed on 2004-03-16. Completion date: 2004-03-26.
SEDONA INC (612 VALLEY VIEW DR) : $713,317 in 45 contractsfrom 2001 to 2005
Contracts for Other Professional Services, Technical Assistance, Technical Representation Services -- Weapons, Maintenance, Repair and Rebuilding of Equipment -- Weapons, and moreby Army Signed by year:2000: $0; 2001: $9,875; 2002: $4,000; 2003: $34,729; 2004: $241,955; 2005: $422,758; 2006: $0.
Biggest contracts:
$79,040 with Army for Other Professional Services. Signed on 2005-01-07. Completion date: 2005-09-30.
$73,216 with Army for Technical Assistance. Signed on 2004-02-26. Completion date: 2004-12-31.
$72,618 with Army for Other Professional Services. Signed on 2005-01-07. Completion date: 2005-09-30.
$62,500 with Army for Technical Representation Services -- Weapons. Signed on 2005-01-26. Completion date: 2005-06-30.
ART-O-LITE ELECTRIC COMPANY IN (230 52ND ST; small business) : $503,955 in 12 contractsfrom 2002 to 2005
Contracts for Construction of Structures and Facilities -- Office Buildings, Maintenance, Repair or Alteration of Real Property -- Office Buildings, Installation of Equipment -- Electrical and Electronic Equipment Components, Coils and Transformers, and moreby Army, U.S. Army Corps of Engineers - civil program financing only Signed by year:2000: $0; 2001: $0; 2002: $160,850; 2003: $122,325; 2004: $5,556; 2005: $215,224; 2006: $0.
Biggest contracts:
$203,000 with Army for Construction of Structures and Facilities -- Office Buildings. Signed on 2005-02-22. Completion date: 2005-08-15.
$114,700 with Army for Maintenance, Repair or Alteration of Real Property -- Office Buildings. Signed on 2003-09-26. Completion date: 2004-03-01.
$99,150 with Army for Installation of Equipment -- Electrical and Electronic Equipment Components. Signed on 2002-08-07. Completion date: 2003-02-10.
$61,700 with Army for Coils and Transformers. Signed on 2002-02-20. Completion date: 2002-07-31.
FASTENAL COMPANY (6814 34TH STREET CT; small business) : $472,546 in 4 contractsfrom 2001 to 2006
$396,000 with Army for Hardware, Commercial. Signed on 2006-01-09. Completion date: 2006-04-30.
$50,134 with Army for Screws. Signed on 2001-04-12. Completion date: 2001-09-17.
$23,500 with Army for Hardware, Commercial. Signed on 2005-05-25. Completion date: 2006-04-30.
$2,912 with Army for Nuts and Washers. Signed on 2005-01-03. Completion date: 2005-01-21.
MIDLAND-DAVIS CORPORATION (3301 4TH AVE) : $390,411 in 15 contractsfrom 2003 to 2006
Contracts for Iron and Steel Scrap, Landscaping/Groundskeeping Services, Paper and Paperboard, Recycling and Reclamation Equipment by Army, Defense Logistics Agency Signed by year:2000: $0; 2001: $0; 2002: $0; 2003: -$13,589; 2004: $198,540; 2005: $188,620; 2006: $16,840.
Biggest contracts:
$193,500 with Army for Iron and Steel Scrap. Signed on 2004-08-03. Completion date: 2005-08-01.
$170,000, same as above.Signed on 2005-11-03. Completion date: 2006-11-01.
$40,500, same as above.Signed on 2003-04-01. Completion date: 2002-10-03.
$8,100 with Army for Landscaping/Groundskeeping Services. Signed on 2005-04-05. Completion date: 2005-04-11.
WILLIAMS, WHITE & COMPANY (600 RIVER DRIVE; small business) : $379,299 in 2 contractsfrom 2001 to 2004
$369,084 with Defense Logistics Agency for Maintenance, Repair and Rebuilding of Equipment -- Special Industry Machinery. Signed on 2001-12-31. Completion date: 2002-04-10.
$10,215 with Navy for Packing and Gasket Materials. Signed on 2004-09-01. Completion date: 2004-11-15.
JON COOK (5117 21ST AVE; small business) : $369,350 in 6 contractsfrom 2000 to 2004
Contracts for Other Professional Services, Other Social Services by Army Signed by year:2000: $100,000; 2001: $62,000; 2002: $63,100; 2003: $67,050; 2004: $77,200; 2005: $0; 2006: $0.
Biggest contracts:
$100,000 with Army for Other Professional Services. Signed on 2000-09-28. Completion date: 2001-09-30.
$72,000 with Army for Other Social Services. Signed on 2004-12-15. Completion date: 2005-10-31.
$67,050 with Army for Other Professional Services. Signed on 2003-10-10. Completion date: 2004-09-30.
$63,100, same as above.Signed on 2002-09-26. Completion date: 2003-09-30.
Top industries in this zip code by the number of employees in 2005:
Health Care and Social Assistance: Offices of Physicians (except Mental Health Specialists) (100-249: 2, 50-99: 1, 20-49: 3, 10-19: 14, 5-9: 14, 1-4: 30)
Administrative and Support and Waste Management and Remediation Services: Temporary Help Services (100-249: 2, 50-99: 2, 20-49: 3, 10-19: 1, 5-9: 3, 1-4: 2)
Finance and Insurance: Direct Health and Medical Insurance Carriers (250-499: 1, 100-249: 1)
People in group quarters in 2010:
280 people in nursing facilities/skilled-nursing facilities
36 people in group homes intended for adults
6 people in other noninstitutional facilities
People in group quarters in 2000:
222 people in nursing homes
63 people in schools, hospitals, or wards for the intellectually disabled
15 people in other noninstitutional group quarters
7 people in college dormitories (includes college quarters off campus)
7 people in religious group quarters
5 people in hospitals/wards and hospices for chronically ill
5 people in hospices or homes for chronically ill
Home Mortgage Disclosure Act Aggregated Statistics For Year 2009 (Based on 13 full and 16 partial tracts)
A) FHA, FSA/RHS & VA Home Purchase Loans
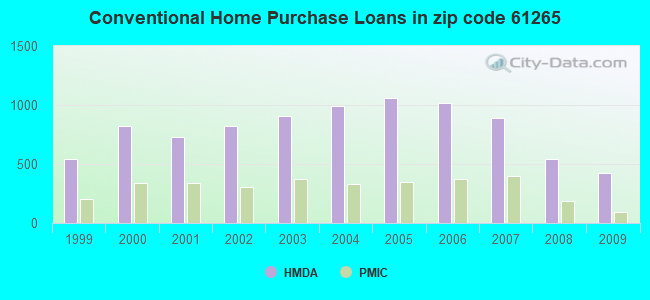
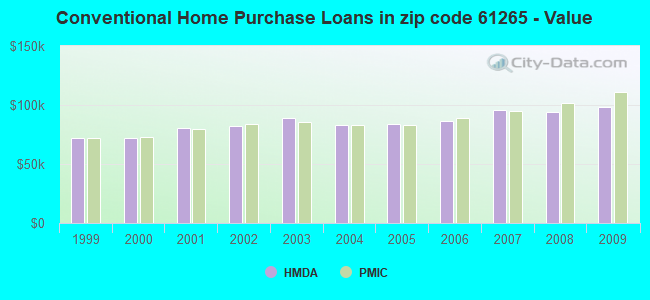
B) Conventional Home Purchase Loans
C) Refinancings
D) Home Improvement Loans
E) Loans on Dwellings For 5+ Families
F) Non-occupant Loans on < 5 Family Dwellings (A B C & D)
G) Loans On Manufactured Home Dwelling (A B C & D)
Number
Average Value
Number
Average Value
Number
Average Value
Number
Average Value
Number
Average Value
Number
Average Value
Number
Average Value
LOANS ORIGINATED
446
$103,871
422
$98,384
1,680
$102,401
330
$35,067
7
$331,424
169
$64,681
4
$24,308
APPLICATIONS APPROVED, NOT ACCEPTED
16
$85,867
25
$115,861
164
$103,896
25
$36,988
0
$0
12
$76,860
2
$42,875
APPLICATIONS DENIED
64
$97,958
52
$63,240
301
$108,504
108
$33,338
1
$1,000,000
29
$173,457
2
$8,805
APPLICATIONS WITHDRAWN
20
$89,820
27
$119,933
229
$117,069
38
$29,507
0
$0
22
$66,691
0
$0
FILES CLOSED FOR INCOMPLETENESS
2
$187,105
2
$69,030
52
$93,250
4
$36,210
0
$0
0
$0
0
$0
Aggregated Statistics For Year 2008 (Based on 13 full and 16 partial tracts)
A) FHA, FSA/RHS & VA Home Purchase Loans
B) Conventional Home Purchase Loans
C) Refinancings
D) Home Improvement Loans
E) Loans on Dwellings For 5+ Families
F) Non-occupant Loans on < 5 Family Dwellings (A B C & D)
G) Loans On Manufactured Home Dwelling (A B C & D)
Number
Average Value
Number
Average Value
Number
Average Value
Number
Average Value
Number
Average Value
Number
Average Value
Number
Average Value
LOANS ORIGINATED
267
$102,229
540
$94,019
945
$94,482
343
$33,103
25
$565,939
174
$72,905
6
$22,483
APPLICATIONS APPROVED, NOT ACCEPTED
8
$109,361
40
$97,742
118
$98,420
29
$47,966
4
$84,582
12
$61,241
4
$45,738
APPLICATIONS DENIED
36
$91,011
66
$90,694
492
$100,332
136
$41,534
1
$250,000
26
$133,603
10
$22,035
APPLICATIONS WITHDRAWN
18
$85,939
38
$132,728
244
$102,373
30
$40,175
0
$0
10
$94,117
0
$0
FILES CLOSED FOR INCOMPLETENESS
5
$95,952
8
$111,846
41
$97,843
13
$37,063
0
$0
2
$66,805
0
$0
Aggregated Statistics For Year 2007 (Based on 13 full and 16 partial tracts)
A) FHA, FSA/RHS & VA Home Purchase Loans
B) Conventional Home Purchase Loans
C) Refinancings
D) Home Improvement Loans
E) Loans on Dwellings For 5+ Families
F) Non-occupant Loans on < 5 Family Dwellings (A B C & D)
G) Loans On Manufactured Home Dwelling (A B C & D)
Number
Average Value
Number
Average Value
Number
Average Value
Number
Average Value
Number
Average Value
Number
Average Value
Number
Average Value
LOANS ORIGINATED
139
$103,964
893
$95,989
946
$84,271
406
$27,396
13
$1,365,288
193
$79,694
5
$12,414
APPLICATIONS APPROVED, NOT ACCEPTED
6
$84,833
80
$71,045
199
$88,466
60
$33,614
2
$199,840
32
$64,157
0
$0
APPLICATIONS DENIED
26
$101,777
132
$81,072
573
$93,902
200
$43,629
0
$0
34
$128,402
12
$41,085
APPLICATIONS WITHDRAWN
23
$84,877
129
$105,456
236
$94,374
43
$38,375
0
$0
22
$71,915
2
$62,085
FILES CLOSED FOR INCOMPLETENESS
1
$89,000
13
$82,842
66
$109,694
3
$53,497
0
$0
1
$120,000
0
$0
Aggregated Statistics For Year 2006 (Based on 13 full and 16 partial tracts)
A) FHA, FSA/RHS & VA Home Purchase Loans
B) Conventional Home Purchase Loans
C) Refinancings
D) Home Improvement Loans
E) Loans on Dwellings For 5+ Families
F) Non-occupant Loans on < 5 Family Dwellings (A B C & D)
G) Loans On Manufactured Home Dwelling (A B C & D)
Number
Average Value
Number
Average Value
Number
Average Value
Number
Average Value
Number
Average Value
Number
Average Value
Number
Average Value
LOANS ORIGINATED
87
$91,354
1,018
$86,039
1,040
$75,493
422
$22,323
7
$318,721
194
$57,900
4
$16,042
APPLICATIONS APPROVED, NOT ACCEPTED
0
$0
73
$91,099
145
$78,366
43
$38,947
3
$423,123
18
$57,254
0
$0
APPLICATIONS DENIED
13
$95,105
192
$74,078
613
$86,237
157
$39,561
2
$51,850
41
$51,607
19
$28,535
APPLICATIONS WITHDRAWN
9
$83,352
147
$86,724
372
$99,792
31
$48,722
0
$0
19
$57,977
0
$0
FILES CLOSED FOR INCOMPLETENESS
1
$79,760
35
$118,287
81
$105,167
2
$28,740
0
$0
2
$81,820
0
$0
Aggregated Statistics For Year 2005 (Based on 13 full and 16 partial tracts)
A) FHA, FSA/RHS & VA Home Purchase Loans
B) Conventional Home Purchase Loans
C) Refinancings
D) Home Improvement Loans
E) Loans on Dwellings For 5+ Families
F) Non-occupant Loans on < 5 Family Dwellings (A B C & D)
G) Loans On Manufactured Home Dwelling (A B C & D)
Number
Average Value
Number
Average Value
Number
Average Value
Number
Average Value
Number
Average Value
Number
Average Value
Number
Average Value
LOANS ORIGINATED
99
$86,970
1,058
$84,137
1,248
$79,659
493
$24,358
6
$612,930
236
$61,080
16
$17,546
APPLICATIONS APPROVED, NOT ACCEPTED
10
$73,717
84
$68,848
160
$75,318
51
$26,133
0
$0
17
$54,358
4
$23,562
APPLICATIONS DENIED
8
$81,026
185
$69,152
649
$87,899
206
$30,749
1
$238,000
27
$59,319
13
$19,324
APPLICATIONS WITHDRAWN
0
$0
243
$88,839
434
$98,324
78
$63,748
0
$0
33
$71,704
5
$8,992
FILES CLOSED FOR INCOMPLETENESS
2
$61,560
33
$101,231
145
$99,876
0
$0
0
$0
2
$61,400
0
$0
Aggregated Statistics For Year 2004 (Based on 13 full and 16 partial tracts)
A) FHA, FSA/RHS & VA Home Purchase Loans
B) Conventional Home Purchase Loans
C) Refinancings
D) Home Improvement Loans
E) Loans on Dwellings For 5+ Families
F) Non-occupant Loans on < 5 Family Dwellings (A B C & D)
G) Loans On Manufactured Home Dwelling (A B C & D)
Number
Average Value
Number
Average Value
Number
Average Value
Number
Average Value
Number
Average Value
Number
Average Value
Number
Average Value
LOANS ORIGINATED
155
$90,648
995
$82,941
1,377
$80,370
420
$24,857
5
$3,297,136
198
$65,439
13
$19,253
APPLICATIONS APPROVED, NOT ACCEPTED
6
$96,640
64
$98,484
235
$71,699
47
$22,863
0
$0
15
$59,363
4
$23,538
APPLICATIONS DENIED
11
$89,615
209
$65,695
632
$88,284
214
$19,679
6
$56,842
49
$62,925
30
$19,892
APPLICATIONS WITHDRAWN
14
$93,395
130
$79,478
415
$88,033
52
$22,868
0
$0
22
$49,648
1
$65,000
FILES CLOSED FOR INCOMPLETENESS
4
$95,618
32
$78,931
82
$82,986
4
$23,590
0
$0
12
$86,402
0
$0
Aggregated Statistics For Year 2003 (Based on 13 full and 16 partial tracts)
A) FHA, FSA/RHS & VA Home Purchase Loans
B) Conventional Home Purchase Loans
C) Refinancings
D) Home Improvement Loans
E) Loans on Dwellings For 5+ Families
F) Non-occupant Loans on < 5 Family Dwellings (A B C & D)
Number
Average Value
Number
Average Value
Number
Average Value
Number
Average Value
Number
Average Value
Number
Average Value
LOANS ORIGINATED
211
$82,763
906
$89,241
3,524
$82,835
376
$16,846
12
$314,878
223
$63,630
APPLICATIONS APPROVED, NOT ACCEPTED
16
$91,321
49
$96,794
300
$74,926
34
$28,634
0
$0
22
$55,713
APPLICATIONS DENIED
33
$77,003
161
$75,721
871
$79,072
156
$20,795
1
$150,000
62
$74,396
APPLICATIONS WITHDRAWN
11
$86,326
179
$85,504
688
$84,185
36
$16,977
1
$65,000
30
$50,292
FILES CLOSED FOR INCOMPLETENESS
9
$92,746
34
$76,897
127
$78,388
11
$29,305
0
$0
8
$63,840
Aggregated Statistics For Year 2002 (Based on 13 full and 16 partial tracts)
A) FHA, FSA/RHS & VA Home Purchase Loans
B) Conventional Home Purchase Loans
C) Refinancings
D) Home Improvement Loans
E) Loans on Dwellings For 5+ Families
F) Non-occupant Loans on < 5 Family Dwellings (A B C & D)
Number
Average Value
Number
Average Value
Number
Average Value
Number
Average Value
Number
Average Value
Number
Average Value
LOANS ORIGINATED
168
$77,550
826
$82,605
2,441
$84,804
477
$19,394
12
$867,907
186
$54,122
APPLICATIONS APPROVED, NOT ACCEPTED
10
$69,005
38
$66,863
228
$78,862
49
$13,670
0
$0
18
$60,722
APPLICATIONS DENIED
19
$64,278
115
$65,772
720
$74,168
151
$12,984
0
$0
40
$63,314
APPLICATIONS WITHDRAWN
11
$75,711
92
$83,701
425
$87,235
45
$15,567
2
$43,635
27
$55,396
FILES CLOSED FOR INCOMPLETENESS
9
$71,984
18
$61,253
83
$81,110
0
$0
0
$0
3
$52,333
Aggregated Statistics For Year 2001 (Based on 13 full and 16 partial tracts)
A) FHA, FSA/RHS & VA Home Purchase Loans
B) Conventional Home Purchase Loans
C) Refinancings
D) Home Improvement Loans
E) Loans on Dwellings For 5+ Families
F) Non-occupant Loans on < 5 Family Dwellings (A B C & D)
Number
Average Value
Number
Average Value
Number
Average Value
Number
Average Value
Number
Average Value
Number
Average Value
LOANS ORIGINATED
230
$76,280
725
$80,119
2,075
$74,960
459
$16,262
6
$173,653
130
$52,194
APPLICATIONS APPROVED, NOT ACCEPTED
10
$70,340
28
$68,042
237
$62,839
86
$18,822
4
$186,208
11
$33,459
APPLICATIONS DENIED
16
$75,120
140
$44,254
780
$64,446
136
$15,339
0
$0
24
$41,144
APPLICATIONS WITHDRAWN
7
$57,550
86
$110,272
459
$63,589
33
$18,265
0
$0
20
$38,934
FILES CLOSED FOR INCOMPLETENESS
3
$62,207
9
$70,922
39
$76,082
5
$20,488
1
$43,000
3
$70,470
Aggregated Statistics For Year 2000 (Based on 13 full and 16 partial tracts)
A) FHA, FSA/RHS & VA Home Purchase Loans
B) Conventional Home Purchase Loans
C) Refinancings
D) Home Improvement Loans
E) Loans on Dwellings For 5+ Families
F) Non-occupant Loans on < 5 Family Dwellings (A B C & D)
Number
Average Value
Number
Average Value
Number
Average Value
Number
Average Value
Number
Average Value
Number
Average Value
LOANS ORIGINATED
175
$70,767
826
$72,203
755
$60,869
537
$17,980
8
$758,694
110
$53,562
APPLICATIONS APPROVED, NOT ACCEPTED
18
$59,354
67
$62,921
108
$53,760
80
$17,851
0
$0
7
$26,660
APPLICATIONS DENIED
14
$86,781
171
$50,004
448
$52,676
189
$14,671
0
$0
29
$52,168
APPLICATIONS WITHDRAWN
11
$70,370
104
$70,824
421
$52,654
60
$28,271
0
$0
9
$68,088
FILES CLOSED FOR INCOMPLETENESS
0
$0
5
$86,744
39
$54,775
0
$0
0
$0
1
$69,470
Aggregated Statistics For Year 1999 (Based on 10 full and 8 partial tracts)
A) FHA, FSA/RHS & VA Home Purchase Loans
B) Conventional Home Purchase Loans
C) Refinancings
D) Home Improvement Loans
E) Loans on Dwellings For 5+ Families
F) Non-occupant Loans on < 5 Family Dwellings (A B C & D)
2003 - 2018 National Fire Incident Reporting System (NFIRS) incidents
Based on the data from the years 2003 - 2018 the average number of fires per year is 133. The highest number of reported fire incidents - 210 took place in 2006, and the least - 83 in 2010. The data has a dropping trend.
When looking into fire subcategories, the most incidents belonged to: Structure Fires (41.9%), and Outside Fires (30.5%).
Fire incident types reported to NFIRS in Zip Code 61265


 Nearest zip codes: 61282, 61201, 52803, 61240, 52801, 52722.
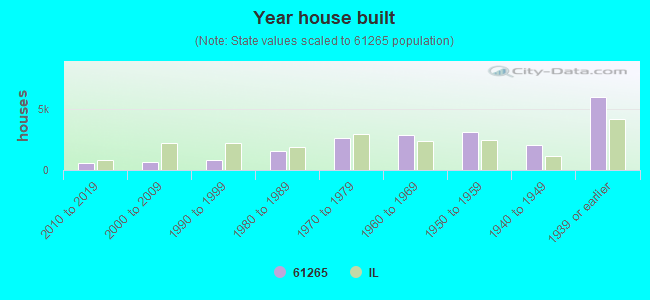


 Based on the data from the years 2003 - 2018 the average number of fires per year is 133. The highest number of reported fire incidents - 210 took place in 2006, and the least - 83 in 2010. The data has a dropping trend.
 When looking into fire subcategories, the most incidents belonged to: Structure Fires (41.9%), and Outside Fires (30.5%).