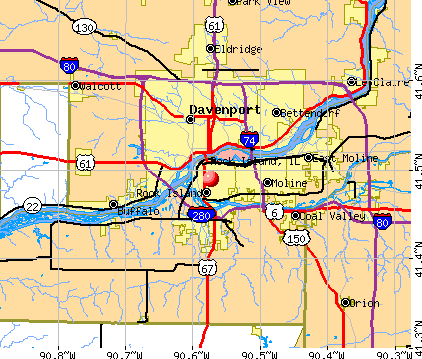
Rock Island, Illinois
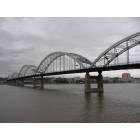
Rock Island: Centennial Bridge Rock Island to Davenport

Rock Island: Vintage Steam Train downtown Rock Island
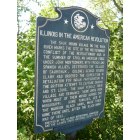
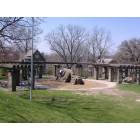
Rock Island: Black Hawk State Park

Rock Island: Large cat print found at Sunset Park, and Sculpture on Arsenal
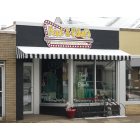
Rock Island: Fred and Ethels
Rock Island: Steve's Barber Shop

Rock Island: Hauburg Civic Center - The Tulip House
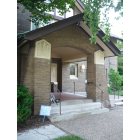
Rock Island: Hauburg Civic Center - The Tulip House
Rock Island

Rock Island: Hauburg Civic Center - The Tulip House
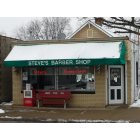
Rock Island: Steve's Barber Shop
- see
20
more - add
your
Submit your own pictures of this city and show them to the world
- OSM Map
- General Map
- Google Map
- MSN Map
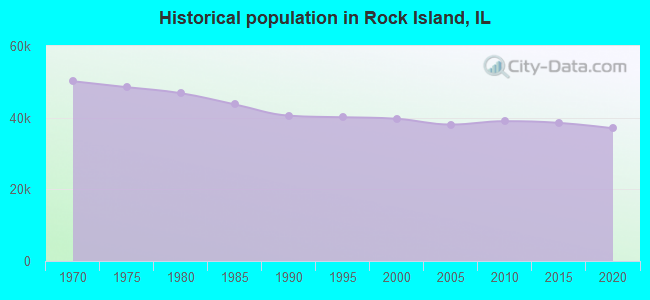
Population change since 2000: -8.6%
 |
| Males: 18,135 | |
| Females: 18,121 |
| Median resident age: | 34.9 years |
| Illinois median age: | 39.1 years |
Zip codes: 61201.
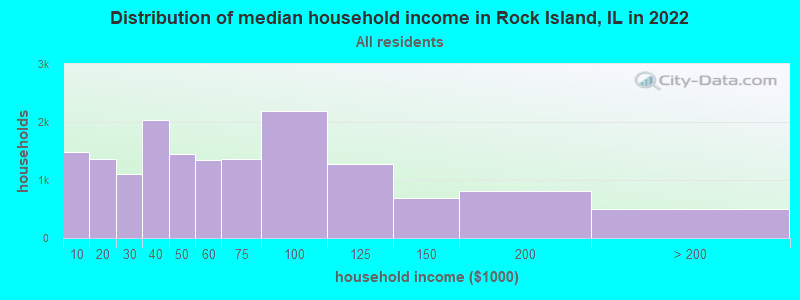
| Rock Island: | $53,700 |
| IL: | $76,708 |
Estimated per capita income in 2022: $30,266 (it was $19,202 in 2000)
Rock Island city income, earnings, and wages data
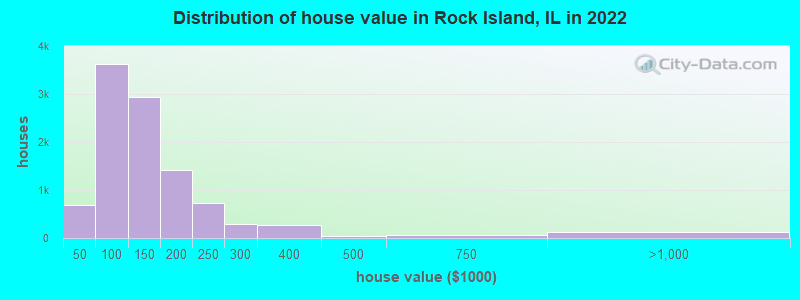
Estimated median house or condo value in 2022: $114,442 (it was $69,800 in 2000)
| Rock Island: | $114,442 |
| IL: | $251,600 |
Mean prices in 2022: all housing units: $136,107; detached houses: $135,870; townhouses or other attached units: $179,894; in 2-unit structures: $50,660; in 3-to-4-unit structures: $345,480; in 5-or-more-unit structures: $121,326; mobile homes: $59,295
Median gross rent in 2022: $751.
(14.7% for White Non-Hispanic residents, 41.6% for Black residents, 24.4% for Hispanic or Latino residents, 19.0% for American Indian residents, 19.5% for Native Hawaiian and other Pacific Islander residents, 16.2% for other race residents, 28.4% for two or more races residents)
Detailed information about poverty and poor residents in Rock Island, IL
Compare current foreclosures in Rock Island, IL:
| Photo | Address | Area | Beds / Baths | Price | Details |
|---|---|---|---|---|---|

|
#1
47th Ave
Rock Island, IL 61201
|
733 sq. feet
|
1 baths 1 beds |
$111,500
|
show details |

|
#2
101st Avenue Ct W
Rock Island, IL 61201
|
988 sq. feet
|
1 baths 3 beds |
$145,000
|
show details |

|
#3
38th St Apt 12
Rock Island, IL 61201
|
1,008 sq. feet
|
1 baths 2 beds |
$95,000
|
show details |

|
#4
95th Ave W
Rock Island, IL 61201
|
- sq. feet
|
1 baths 3 beds |
show details | |

|
#5
30th St
Rock Island, IL 61201
|
1,226 sq. feet
|
1 baths 3 beds |
show details | |

|
#6
19th Ave
Rock Island, IL 61201
|
1,110 sq. feet
|
1 baths 2 beds |
show details | |

|
#7
44th St
Rock Island, IL 61201
|
1,721 sq. feet
|
2 baths 3 beds |
show details | |

|
#8
11th St
Rock Island, IL 61201
|
790 sq. feet
|
1 baths 2 beds |
show details | |

|
#9
9th St
Rock Island, IL 61201
|
828 sq. feet
|
1 baths 3 beds |
show details | |

|
#10
15th Ave
Rock Island, IL 61201
|
1,016 sq. feet
|
1 baths 4 beds |
show details |
| Photo | Address | Area | Beds / Baths | Price | Details |
|---|---|---|---|---|---|

|
#11
13th Ave
Rock Island, IL 61201
|
1,628 sq. feet
|
- baths - beds |
show details | |

|
#12
32nd Avenue Ct
Rock Island, IL 61201
|
2,285 sq. feet
|
2 baths - beds |
show details | |

|
#13
23rd Ave
Rock Island, IL 61201
|
768 sq. feet
|
1 baths - beds |
show details | |

|
#14
35th St
Rock Island, IL 61201
|
- sq. feet
|
- baths - beds |
show details | |

|
#15
8th Ave
Rock Island, IL 61201
|
- sq. feet
|
- baths - beds |
show details | |

|
#16
9th Ave # 211
Rock Island, IL 61201
|
- sq. feet
|
- baths - beds |
show details | |

|
#17
12th St
Rock Island, IL 61201
|
- sq. feet
|
- baths - beds |
show details | |

|
#18
12th St
Rock Island, IL 61201
|
- sq. feet
|
- baths - beds |
show details | |

|
#19
18th St
Rock Island, IL 61201
|
- sq. feet
|
- baths - beds |
show details | |

|
#20
24th St
Rock Island, IL 61201
|
- sq. feet
|
- baths - beds |
show details |
| Photo | Address | Area | Beds / Baths | Price | Details |
|---|---|---|---|---|---|

|
#21
23rd Ave
Rock Island, IL 61201
|
- sq. feet
|
- baths - beds |
show details | |

|
#22
9 1/2 St
Rock Island, IL 61201
|
- sq. feet
|
- baths - beds |
show details | |

|
#23
Serenity Pl
Rock Island, IL 61201
|
- sq. feet
|
- baths - beds |
show details | |

|
#24
13th St
Rock Island, IL 61201
|
- sq. feet
|
- baths - beds |
show details | |

|
#25
10th St W
Rock Island, IL 61201
|
- sq. feet
|
- baths - beds |
show details | |

|
#26
37th Ave
Rock Island, IL 61201
|
- sq. feet
|
- baths - beds |
show details | |

|
#27
21st Ave Apt 3
Rock Island, IL 61201
|
- sq. feet
|
- baths - beds |
show details | |

|
#28
17th St
Rock Island, IL 61201
|
- sq. feet
|
- baths - beds |
show details | |

|
#29
31st St
Rock Island, IL 61201
|
- sq. feet
|
- baths - beds |
show details | |

|
#30
39th Ave
Rock Island, IL 61201
|
- sq. feet
|
- baths - beds |
show details |
| Photo | Address | Area | Beds / Baths | Price | Details |
|---|---|---|---|---|---|

|
#31
44th St
Rock Island, IL 61201
|
- sq. feet
|
- baths - beds |
show details | |

|
#32
48th Ave
Rock Island, IL 61201
|
- sq. feet
|
- baths - beds |
show details | |

|
#33
9th St
Rock Island, IL 61201
|
- sq. feet
|
- baths - beds |
show details | |

|
#34
21st St
Rock Island, IL 61201
|
- sq. feet
|
- baths - beds |
show details | |

|
#35
18th Ave Apt A8
Rock Island, IL 61201
|
- sq. feet
|
- baths - beds |
show details | |

|
#36
8th St W
Rock Island, IL 61201
|
- sq. feet
|
- baths - beds |
show details | |

|
#37
31st Ave
Rock Island, IL 61201
|
- sq. feet
|
- baths - beds |
show details | |

|
#38
35th St
Rock Island, IL 61201
|
- sq. feet
|
- baths - beds |
show details | |

|
#39
46th St
Rock Island, IL 61201
|
- sq. feet
|
- baths - beds |
show details | |

|
#40
9th St
Rock Island, IL 61201
|
- sq. feet
|
- baths - beds |
show details |
| Photo | Address | Area | Beds / Baths | Price | Details |
|---|---|---|---|---|---|

|
#41
79th Ave W
Rock Island, IL 61201
|
- sq. feet
|
- baths - beds |
show details | |

|
#42
42nd St
Rock Island, IL 61201
|
- sq. feet
|
- baths - beds |
show details | |

|
#43
43rd St
Rock Island, IL 61201
|
- sq. feet
|
- baths - beds |
show details | |

|
#44
22 1/2 Ave
Rock Island, IL 61201
|
- sq. feet
|
- baths - beds |
show details | |

|
#45
20th St
Rock Island, IL 61201
|
- sq. feet
|
- baths - beds |
show details | |

|
#46
7th Ave
Rock Island, IL 61201
|
- sq. feet
|
- baths - beds |
show details | |

|
#47
29th Ave
Rock Island, IL 61201
|
- sq. feet
|
- baths - beds |
show details | |

|
#48
15th Ave
Rock Island, IL 61201
|
- sq. feet
|
- baths - beds |
show details | |

|
#49
24th St
Rock Island, IL 61201
|
- sq. feet
|
- baths - beds |
show details | |

|
Check over 1 million property listings on Foreclosure.com!
|
browse all offers | |||


- 21,96859.9%White alone
- 5,81615.9%Black alone
- 5,14414.0%Hispanic
- 1,9755.4%Two or more races
- 1,4954.1%Asian alone
- 730.2%American Indian alone
- 360.10%Other race alone
- 140.04%Native Hawaiian and Other
Pacific Islander alone
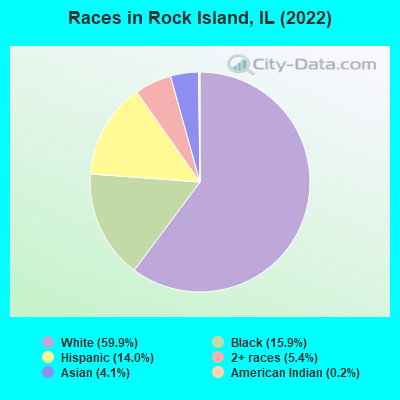
Races in Rock Island detailed stats: ancestries, foreign born residents, place of birth
According to our research of Illinois and other state lists, there were 65 registered sex offenders living in Rock Island, Illinois as of April 27, 2024.
The ratio of all residents to sex offenders in Rock Island is 587 to 1.
Type |
2009 |
2010 |
2011 |
2012 |
2013 |
2014 |
2015 |
2016 |
2017 |
2018 |
2019 |
2020 |
2021 |
2022 |
|---|---|---|---|---|---|---|---|---|---|---|---|---|---|---|
| Murders (per 100,000) | 1 (2.6) | 3 (7.7) | 2 (5.1) | 4 (10.2) | 5 (12.9) | 1 (2.6) | 3 (7.8) | 4 (10.4) | 3 (7.9) | 1 (2.6) | 1 (2.7) | 7 (18.9) | 2 (5.5) | 11 (30.4) |
| Rapes (per 100,000) | 0 (0.0) | 21 (53.8) | 14 (35.8) | 7 (17.9) | 2 (5.1) | 16 (41.2) | 3 (7.8) | 6 (15.6) | 5 (13.1) | 4 (10.5) | 14 (37.3) | 8 (21.6) | 10 (27.3) | 3 (8.3) |
| Robberies (per 100,000) | 81 (213.3) | 51 (130.7) | 52 (132.9) | 39 (99.9) | 32 (82.3) | 22 (56.6) | 22 (57.1) | 23 (59.7) | 10 (26.3) | 19 (50.0) | 29 (77.3) | 50 (135.2) | 21 (57.3) | 13 (35.9) |
| Assaults (per 100,000) | 268 (705.7) | 232 (594.6) | 222 (567.3) | 173 (443.2) | 161 (414.0) | 120 (308.9) | 143 (370.9) | 125 (324.3) | 115 (302.0) | 77 (202.7) | 95 (253.2) | 148 (400.2) | 206 (561.8) | 177 (488.5) |
| Burglaries (per 100,000) | 385 (1,014) | 356 (912.4) | 256 (654.1) | 217 (555.9) | 227 (583.7) | 158 (406.8) | 168 (435.8) | 175 (454.0) | 198 (520.0) | 166 (437.0) | 166 (442.5) | 139 (375.9) | 120 (327.3) | 164 (452.6) |
| Thefts (per 100,000) | 1,172 (3,086) | 872 (2,235) | 896 (2,290) | 856 (2,193) | 741 (1,905) | 677 (1,743) | 678 (1,759) | 782 (2,029) | 754 (1,980) | 688 (1,811) | 599 (1,597) | 441 (1,193) | 634 (1,729) | 586 (1,617) |
| Auto thefts (per 100,000) | 123 (323.9) | 78 (199.9) | 85 (217.2) | 51 (130.6) | 38 (97.7) | 42 (108.1) | 60 (155.6) | 85 (220.5) | 108 (283.6) | 133 (350.1) | 113 (301.2) | 124 (335.3) | 156 (425.5) | 189 (521.6) |
| Arson (per 100,000) | 14 (36.9) | 6 (15.4) | 7 (17.9) | 13 (33.3) | 7 (18.0) | 5 (12.9) | 10 (25.9) | 6 (15.6) | 3 (7.9) | 9 (23.7) | 5 (13.3) | 23 (62.2) | 15 (40.9) | 7 (19.3) |
| City-Data.com crime index | 430.7 | 385.8 | 346.9 | 290.5 | 262.2 | 223.7 | 226.4 | 246.6 | 232.8 | 200.3 | 227.9 | 276.6 | 288.4 | 313.9 |
The City-Data.com crime index weighs serious crimes and violent crimes more heavily. Higher means more crime, U.S. average is 246.1. It adjusts for the number of visitors and daily workers commuting into cities.
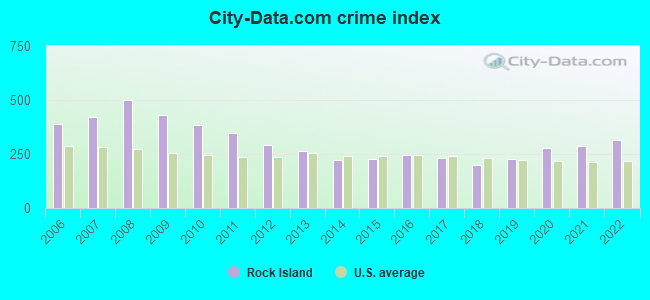
Crime rate in Rock Island detailed stats: murders, rapes, robberies, assaults, burglaries, thefts, arson
Full-time law enforcement employees in 2021, including police officers: 108 (81 officers - 75 male; 6 female).
| Officers per 1,000 residents here: | 2.21 |
| Illinois average: | 2.84 |
 Recent articles from our blog. Our writers, many of them Ph.D. graduates or candidates, create easy-to-read articles on a wide variety of topics.

 | Images of Illinois (538 replies) |
| Red line extension (55 replies) |
| Cash only condos in South Shore and Kenwood (19 replies) |
| Can Chicagoland support 2 MLB teams? (67 replies) |
| Cheapest entry level housing (NW suburbs pref) (9 replies) |
| Moving to Rock Island Arsenal - Best Apartments Close (12 replies) |
Latest news from Rock Island, IL collected exclusively by city-data.com from local newspapers, TV, and radio stations
Ancestries: German (10.8%), Irish (7.3%), African (4.7%), American (4.4%), English (4.0%), Belgian (2.4%).
Current Local Time: CST time zone
Incorporated on 12/08/1879
Elevation: 580 feet
Land area: 15.9 square miles.
Population density: 2,277 people per square mile (low).
3,476 residents are foreign born (3.3% Latin America, 2.8% Africa, 2.8% Asia).
| This city: | 9.5% |
| Illinois: | 14.1% |
Median real estate property taxes paid for housing units with mortgages in 2022: $2,617 (2.3%)
Median real estate property taxes paid for housing units with no mortgage in 2022: $2,626 (2.3%)
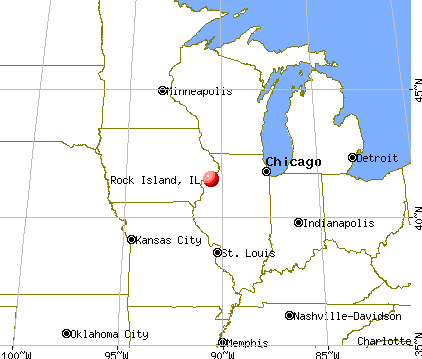
Nearest city with pop. 50,000+: Davenport, IA  (3.8 miles , pop. 98,359).
Nearest city with pop. 200,000+: Madison, WI (125.1 miles , pop. 208,054).
Nearest city with pop. 1,000,000+: Chicago, IL (151.5 miles , pop. 2,896,016).
Nearest cities:
), ), Latitude: 41.49 N, Longitude: 90.57 W
Daytime population change due to commuting: +2,689 (+7.3%)
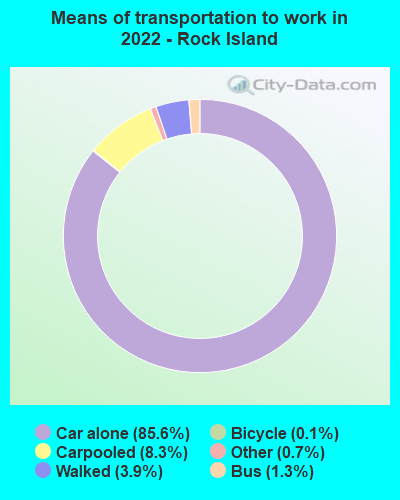
Workers who live and work in this city: 7,242 (42.8%)
Area code: 309
Rock Island tourist attractions:
Rock Island, Illinois accommodation & food services, waste management - Economy and Business Data
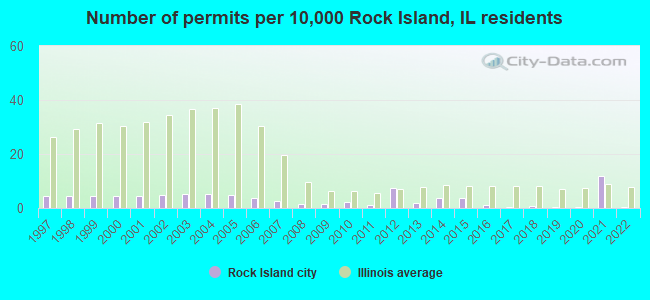
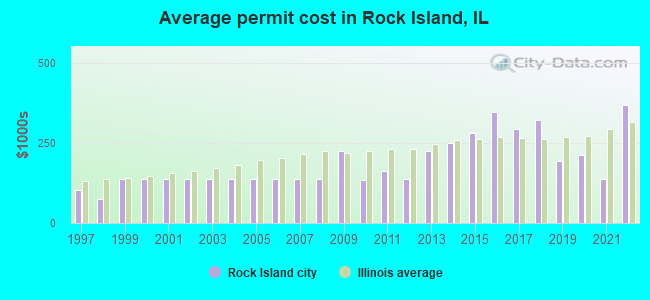
Single-family new house construction building permits:
- 2022: 2 buildings, average cost: $368,200
- 2021: 47 buildings, average cost: $138,000
- 2020: 2 buildings, average cost: $212,300
- 2019: 1 building, cost: $193,500
- 2018: 3 buildings, average cost: $320,700
- 2017: 1 building, cost: $293,000
- 2016: 4 buildings, average cost: $347,400
- 2015: 14 buildings, average cost: $280,200
- 2014: 14 buildings, average cost: $248,400
- 2013: 7 buildings, average cost: $226,200
- 2012: 29 buildings, average cost: $137,400
- 2011: 4 buildings, average cost: $162,700
- 2010: 9 buildings, average cost: $135,400
- 2009: 6 buildings, average cost: $225,300
- 2008: 6 buildings, average cost: $135,900
- 2007: 10 buildings, average cost: $135,900
- 2006: 14 buildings, average cost: $135,900
- 2005: 19 buildings, average cost: $135,900
- 2004: 20 buildings, average cost: $135,900
- 2003: 20 buildings, average cost: $135,900
- 2002: 19 buildings, average cost: $135,900
- 2001: 17 buildings, average cost: $135,900
- 2000: 17 buildings, average cost: $135,900
- 1999: 17 buildings, average cost: $135,900
- 1998: 17 buildings, average cost: $73,900
- 1997: 17 buildings, average cost: $103,900
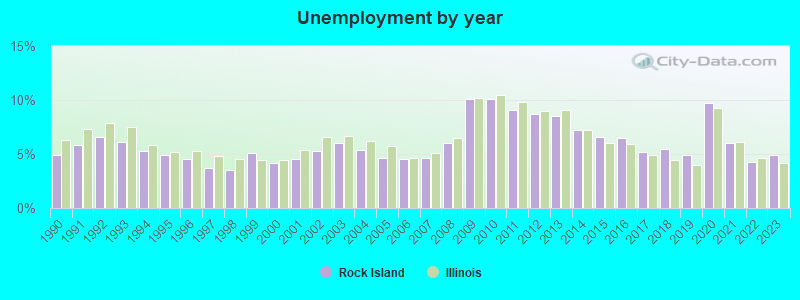
| Here: | 4.9% |
| Illinois: | 4.2% |
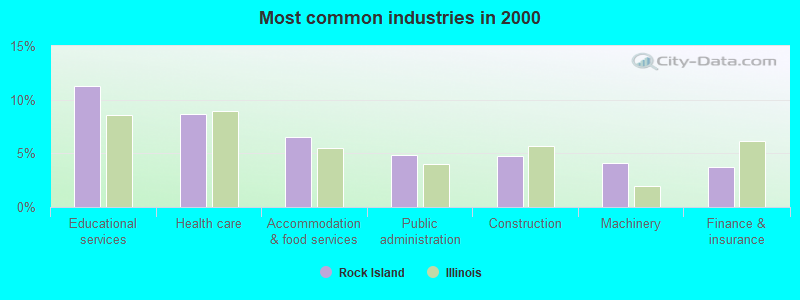
- Educational services (11.2%)
- Health care (8.6%)
- Accommodation & food services (6.5%)
- Public administration (4.9%)
- Construction (4.7%)
- Machinery (4.1%)
- Finance & insurance (3.7%)
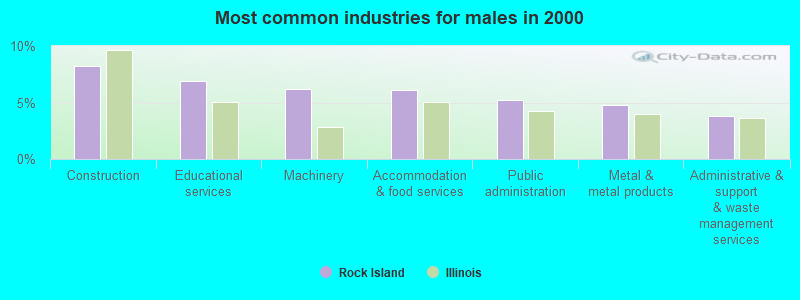
- Construction (8.2%)
- Educational services (6.9%)
- Machinery (6.2%)
- Accommodation & food services (6.1%)
- Public administration (5.2%)
- Metal & metal products (4.8%)
- Administrative & support & waste management services (3.8%)
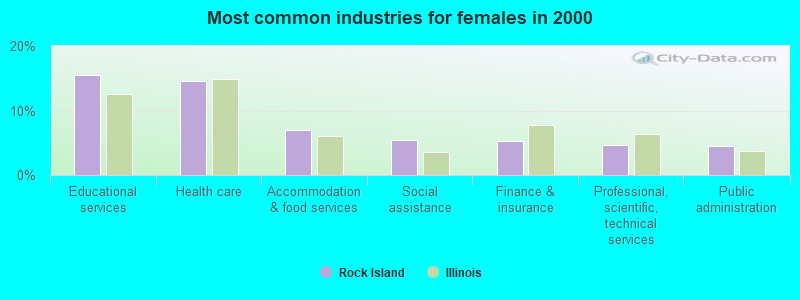
- Educational services (15.5%)
- Health care (14.5%)
- Accommodation & food services (6.9%)
- Social assistance (5.5%)
- Finance & insurance (5.3%)
- Professional, scientific, technical services (4.7%)
- Public administration (4.6%)
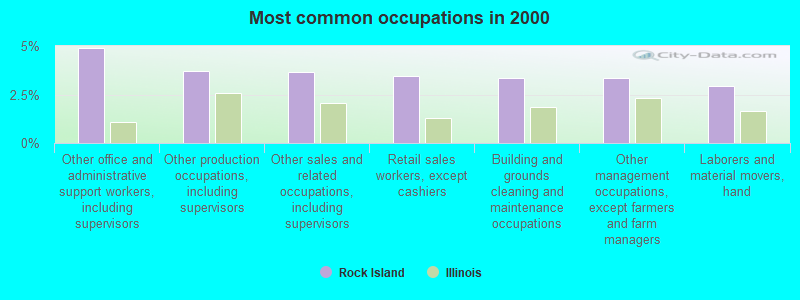
- Other office and administrative support workers, including supervisors (4.9%)
- Other production occupations, including supervisors (3.7%)
- Other sales and related occupations, including supervisors (3.6%)
- Retail sales workers, except cashiers (3.5%)
- Building and grounds cleaning and maintenance occupations (3.4%)
- Other management occupations, except farmers and farm managers (3.3%)
- Laborers and material movers, hand (2.9%)
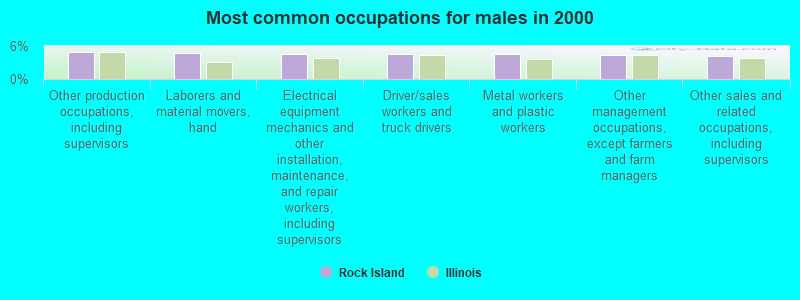
- Other production occupations, including supervisors (4.9%)
- Laborers and material movers, hand (4.6%)
- Electrical equipment mechanics and other installation, maintenance, and repair workers, including supervisors (4.6%)
- Driver/sales workers and truck drivers (4.5%)
- Metal workers and plastic workers (4.5%)
- Other management occupations, except farmers and farm managers (4.4%)
- Other sales and related occupations, including supervisors (4.2%)
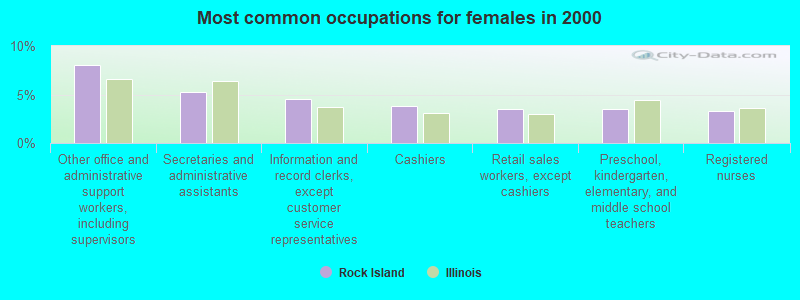
- Other office and administrative support workers, including supervisors (8.1%)
- Secretaries and administrative assistants (5.2%)
- Information and record clerks, except customer service representatives (4.5%)
- Cashiers (3.9%)
- Retail sales workers, except cashiers (3.5%)
- Preschool, kindergarten, elementary, and middle school teachers (3.5%)
- Registered nurses (3.3%)
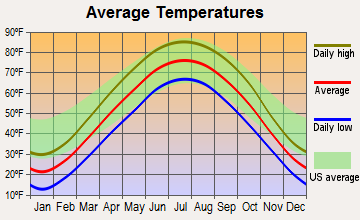
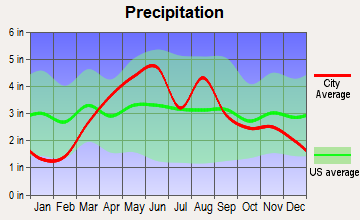
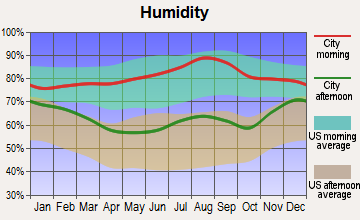
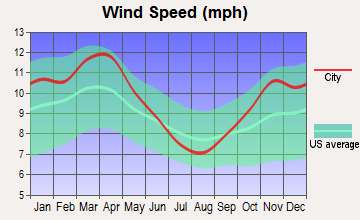
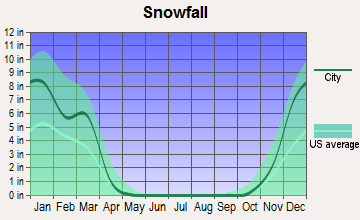
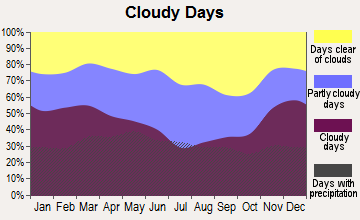
Average climate in Rock Island, Illinois
Based on data reported by over 4,000 weather stations

|
|

(lower is better)
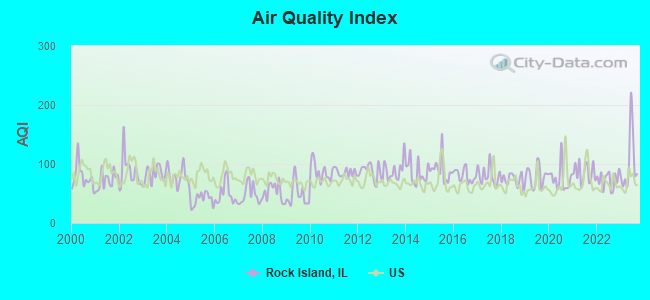
Air Quality Index (AQI) level in 2023 was 101. This is worse than average.
| City: | 101 |
| U.S.: | 73 |
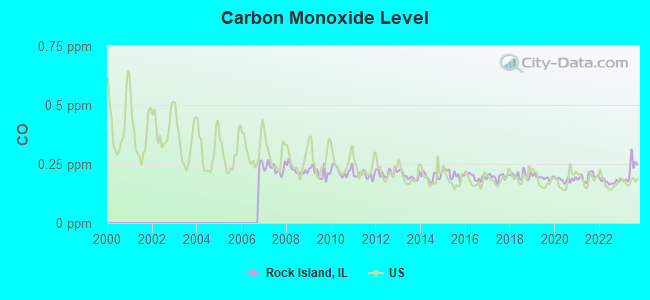
Carbon Monoxide (CO) [ppm] level in 2023 was 0.220. This is about average. Closest monitor was 1.8 miles away from the city center.
| City: | 0.220 |
| U.S.: | 0.251 |
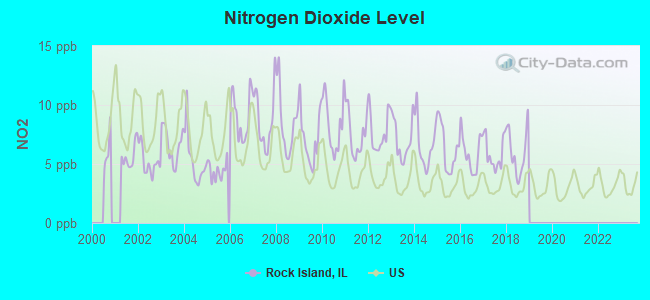
Nitrogen Dioxide (NO2) [ppb] level in 2018 was 6.00. This is about average. Closest monitor was 2.9 miles away from the city center.
| City: | 6.00 |
| U.S.: | 5.11 |
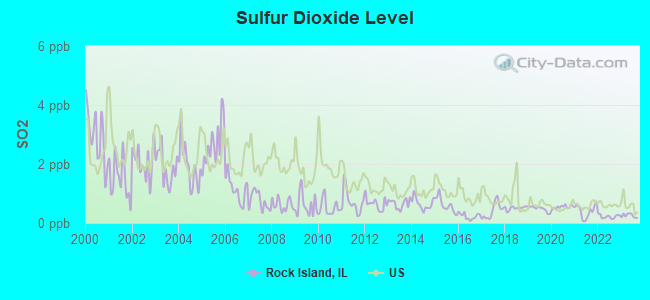
Sulfur Dioxide (SO2) [ppb] level in 2023 was 0.251. This is significantly better than average. Closest monitor was 1.8 miles away from the city center.
| City: | 0.251 |
| U.S.: | 1.515 |
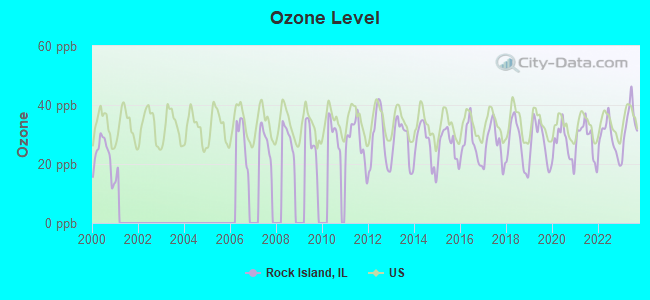
Ozone [ppb] level in 2023 was 33.9. This is about average. Closest monitor was 1.8 miles away from the city center.
| City: | 33.9 |
| U.S.: | 33.3 |
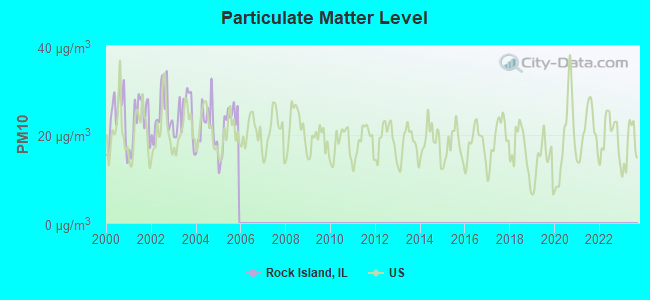
Particulate Matter (PM10) [µg/m3] level in 2005 was 21.7. This is about average. Closest monitor was 2.4 miles away from the city center.
| City: | 21.7 |
| U.S.: | 19.2 |
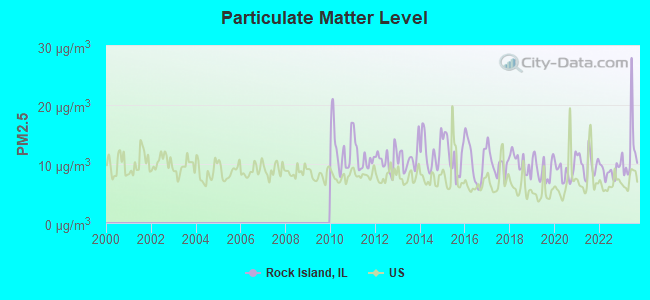
Particulate Matter (PM2.5) [µg/m3] level in 2023 was 12.3. This is significantly worse than average. Closest monitor was 2.9 miles away from the city center.
| City: | 12.3 |
| U.S.: | 8.1 |
Tornado activity:
Rock Island-area historical tornado activity is near Illinois state average. It is 77% greater than the overall U.S. average.
On 4/19/1966, a category F3 (max. wind speeds 158-206 mph) tornado 3.9 miles away from the Rock Island city center caused between $50,000 and $500,000 in damages.
On 4/11/1965, a category F4 (max. wind speeds 207-260 mph) tornado 31.0 miles away from the city center killed one person and injured 3 people and caused between $500,000 and $5,000,000 in damages.
Earthquake activity:
Rock Island-area historical earthquake activity is significantly above Illinois state average. It is 127% greater than the overall U.S. average.On 4/18/2008 at 09:36:59, a magnitude 5.4 (5.1 MB, 4.8 MS, 5.4 MW, 5.2 MW, Class: Moderate, Intensity: VI - VII) earthquake occurred 253.8 miles away from Rock Island center
On 6/10/1987 at 23:48:54, a magnitude 5.1 (4.9 MB, 4.4 MS, 4.6 MS, 5.1 LG) earthquake occurred 232.9 miles away from the city center
On 4/18/2008 at 09:36:59, a magnitude 5.2 (5.2 MW, Depth: 8.9 mi) earthquake occurred 253.8 miles away from the city center
On 6/28/2004 at 06:10:52, a magnitude 4.2 (4.2 MW, Depth: 6.2 mi, Class: Light, Intensity: IV - V) earthquake occurred 86.7 miles away from Rock Island center
On 6/18/2002 at 17:37:15, a magnitude 5.0 (4.3 MB, 4.6 MW, 5.0 LG) earthquake occurred 284.1 miles away from the city center
On 4/18/2008 at 15:14:16, a magnitude 4.8 (4.5 MB, 4.8 MW, 4.6 MW) earthquake occurred 253.6 miles away from Rock Island center
Magnitude types: regional Lg-wave magnitude (LG), body-wave magnitude (MB), surface-wave magnitude (MS), moment magnitude (MW)
Natural disasters:
The number of natural disasters in Rock Island County (14) is near the US average (15).Major Disasters (Presidential) Declared: 11
Emergencies Declared: 1
Causes of natural disasters: Floods: 11, Storms: 9, Hurricane: 1, Snowstorm: 1, Tornado: 1, Wind: 1, Winter Storm: 1, Other: 1 (Note: some incidents may be assigned to more than one category).
Hospitals and medical centers in Rock Island:
- NINTH STREET PLACE (2850 9TH STREET)
- TRINITY ROCK ISLAND (Voluntary non-profit - Other, 2701 17TH ST)
- FRIENDSHIP MANOR (1209 21ST AVENUE)
- ROCK ISLAND COUNTY HEALTHCARE CENTER (2122 25TH AVE)
- ROCK ISLAND NURSING AND REHB CENTER (2545 24TH STREET)
- ST ANTHONY'S NRSG AND REHAB CENTER (767 30TH STREET)
- TRINITY MEDICAL CENTER - WEST (2701 - 17TH STREET)
- QUAD CITIES KIDNEY CENTER-ROCK ISLAND, LLC (2623 17TH STREET)
- AMEDISYS HOME HEALTH OF ROCK ISLAND (1830 2ND AVENUE, STE 100)
- GENTIVA HEALTH SERVICES (1600 4TH AVE SUITE 201)
Heliports located in Rock Island:
Amtrak stations near Rock Island:
- 3 miles: DAVENPORT (BURLINGTON DEPOT, 304 WEST RIVER DR.) - Bus Station . Services: enclosed waiting area, public restrooms, public payphones, taxi stand.
- 5 miles: MOLINE (QUAD CITY AIRPORT, 2200 69TH ST.) - Bus Station . Services: enclosed waiting area, public restrooms, public payphones, call for taxi service.
Operable nuclear power plants near Rock Island:
- 19 miles: Quad Cities 1 and 2 in Cordova, IL.
Colleges/Universities in Rock Island:
- Augustana College (Full-time enrollment: 2,555; Location: 639 38th St; Private, not-for-profit; Website: www.augustana.edu)
- Trinity College of Nursing & Health Sciences (Full-time enrollment: 172; Location: 2122 - 25th Avenue; Private, not-for-profit; Website: www.trinitycollegeqc.edu; Offers Master's degree)
Other colleges/universities with over 2000 students near Rock Island:
- Eastern Iowa Community College District (about 3 miles; Davenport, IA; Full-time enrollment: 5,507)
- Saint Ambrose University (about 4 miles; Davenport, IA; FT enrollment: 3,053)
- Kaplan University-Davenport Campus (about 5 miles; Davenport, IA; FT enrollment: 60,376)
- Black Hawk College (about 7 miles; Moline, IL; FT enrollment: 5,086)
- Ashford University (about 32 miles; Clinton, IA; FT enrollment: 73,330)
- University of Iowa (about 52 miles; Iowa City, IA; FT enrollment: 24,735)
- Southeastern Community College (about 57 miles; West Burlington, IA; FT enrollment: 2,251)
Public high schools in Rock Island:
- ROCK ISLAND HIGH SCHOOL (Students: 1,555, Location: 1400 25TH AVE, Grades: 9-12)
- THURGOOD MARSHALL LEARNING CTR (Students: 190, Location: 600 11TH AVE, Grades: 7-12)
Biggest public elementary/middle schools in Rock Island:
- DENKMANN ELEM SCHOOL (Students: 469, Location: 4101 22ND AVE, Grades: PK-6)
- EARL H HANSON ELEM SCHOOL (Students: 430, Location: 4000 9TH ST, Grades: PK-6)
- EDISON JR HIGH SCHOOL (Students: 388, Location: 4141 9TH ST, Grades: 7-8)
- RIDGEWOOD ELEM SCHOOL (Students: 338, Location: 9607 14TH ST W, Grades: PK-6)
- FRANCES WILLARD ELEM SCHOOL (Students: 272, Location: 2503 9TH ST, Grades: PK-6)
- EUGENE FIELD ELEM SCHOOL (Students: 256, Location: 2900 31ST AVE, Grades: KG-6)
- LONGFELLOW ELEM SCHOOL (Students: 200, Location: 4198 7TH AVE, Grades: PK-6)
- MLK A R T PROGRAM (Students: 5, Location: 630 9TH ST, Grades: 6-8)
- WASHINGTON JR HIGH SCHOOL (Location: 3300 18TH AVE, Grades: 7-8)
- ROCK ISLAND ACADEMY (Location: 930 14TH ST, Grades: PK-6)
Private elementary/middle school in Rock Island:
Library in Rock Island:
- ROCK ISLAND PUBLIC LIBRARY (Operating income: $2,241,632; Location: 401 NINETEENTH STREET; 217,820 books; 2,555 e-books; 14,651 audio materials; 8,529 video materials; 11 local licensed databases; 16 state licensed databases; 2 other licensed databases; 337 print serial subscriptions; 2 electronic serial subscriptions)
User-submitted facts and corrections:
- Rock Island Greater (Noon) Lions Club Rock Island Evening Lions Club Part of the Lions Club International organization and serving the Sight and Hearing Impaired, community needs. Our motto is "WE SERVE"
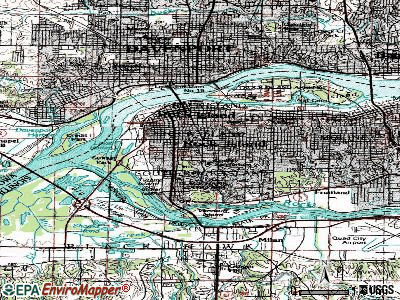
Points of interest:
Notable locations in Rock Island: Sunset Marina (A), Highland Springs Municipal Golf Course (B), Green Lakes Campground (C), Rock Valley Plaza (D), Watch Tower Plaza (E), Quad Citys Industrial Center (F), Saukie Golf Course (G), John Hauberg Indian Museum (H), Rock Island Public Library (I), Trinity Ambulance Service (J), Rock Island Fire Department Station 2 (K), Municipal Terminal (L), Martin Luther King Community Center (M), Hauberg Civic Center (N), Rock Island Fire Department Station 3 (O), Rock Island Fire Department Station 4 (P), Rock Island Fire Department Station 1 (Q). Display/hide their locations on the map
Churches in Rock Island include: Saint Marys of the Angels Convent (A), Sacred Heart Church (B), Saint Joseph Church (C), Saint Marys Church (D), Trinity Church (E), Tri City Jewish Center (F), New Apostolic Church (G). Display/hide their locations on the map
Cemeteries: Calvary Cemetery (1), Immanuel Lutheran Cemetery (2), Memorial Park Cemetery (3), William Carr Cemetery (4), Hebrew Cemetery (5), Dickson Cemetery (6), Chippiannock Cemetery (7). Display/hide their locations on the map
Lake: Lake Potter (A). Display/hide its location on the map
Streams, rivers, and creeks: Sheldon Creek (A), Sand Creek (B), Kyte Creek (C), Jimmy Creek (D), Sylvan Slough (E). Display/hide their locations on the map
Parks in Rock Island include: Black Hawk Forest Nature Preserve (1), Longview Park (2), Black Hawk State Historical Site (3), Hasselroth Park (4), McKay Park (5), Hauberg Estates Park (6), Old Horace Mann Park (7), Reservoir Park (8), Thirty-First Avenue Park (9). Display/hide their locations on the map
Tourist attractions: Colonel Davenport Historical Foundation (Museums; Rock Islnd Arsenal) (1), Augustana College - Fryxell Geology Museum (639 38th Street) (2), Area Agency On Aging (Cultural Attractions- Events- & Facilities; 729 34th Avenue) (3), Black Hawk State Historic Site (Historical Places & Services; 1510 46th Avenue) (4), Day Darrell (8217 9th Street West) (5), Great River Travel Limited (Tours & Charters; 226 17th Street Suite 12) (6). Display/hide their approximate locations on the map
Hotels: American Motor Inn (4300 11th Street) (1), Four Points By Sheraton Rock Island (226 17th Street) (2), Hillside Inn (4715 11th Street) (3). Display/hide their approximate locations on the map
Courts: United States Government - Clerk of the Court (211 19th Street) (1), United States Government - Justice Dept- Department Of Justice- Clerk Of The C (1830 2nd Avenue) (2). Display/hide their approximate locations on the map
Birthplace of: Bobby Schilling - Republican legislator, Eddie Albert - (born 1908), actor, Tim Moore (comedian) - Actor, David Ackles - Singer, Arno H. Denecke - Judge, Chester C. Thompson - Politician, Jamie Van Fossen - Politician, Helen Mack - Actress, Frazier Hunt - Radio personality, Jeffrey Gold - Dramatists and playwright.
| This city: | 2.3 people |
| Illinois: | 2.6 people |
| This city: | 57.8% |
| Whole state: | 65.8% |
| This city: | 7.4% |
| Whole state: | 6.3% |
Likely homosexual households (counted as self-reported same-sex unmarried-partner households)
- Lesbian couples: 0.4% of all households
- Gay men: 0.3% of all households
People in group quarters in Rock Island in 2010:
- 1,595 people in college/university student housing
- 452 people in nursing facilities/skilled-nursing facilities
- 232 people in local jails and other municipal confinement facilities
- 77 people in emergency and transitional shelters (with sleeping facilities) for people experiencing homelessness
- 52 people in other noninstitutional facilities
- 30 people in residential treatment centers for adults
- 2 people in group homes intended for adults
People in group quarters in Rock Island in 2000:
- 1,548 people in college dormitories (includes college quarters off campus)
- 444 people in nursing homes
- 137 people in other noninstitutional group quarters
- 135 people in local jails and other confinement facilities (including police lockups)
- 68 people in homes for the mentally retarded
- 53 people in hospitals/wards and hospices for chronically ill
- 53 people in hospices or homes for chronically ill
- 17 people in religious group quarters
- 15 people in homes for the mentally ill
- 12 people in other nonhousehold living situations
- 6 people in other group homes
Banks with branches in Rock Island (2011 data):
- American Bank and Trust Company, National Association: Rock Island Hy-Vee Branch, Downtown Ri Branch, Friendship Manor, Rock Island Branch. Info updated 2006/11/03: Bank assets: $465.6 mil, Deposits: $412.7 mil, headquarters in Davenport, IA, negative income in the last year, Commercial Lending Specialization, 11 total offices, Holding Company: Ambank Holdings, Inc.
- U.S. Bank National Association: Flatiron Branch, Hilltop Branch, Rock Island Branch. Info updated 2012/01/30: Bank assets: $330,470.8 mil, Deposits: $236,091.5 mil, headquarters in Cincinnati, OH, positive income, 3121 total offices, Holding Company: U.S. Bancorp
- Wells Fargo Bank, National Association: 30th Street Facility at 1800 30th Street, branch established on 1979/07/23; Rock Island Downtown Branch at 1830 2nd Avenue, branch established on 1966/07/15. Info updated 2011/04/05: Bank assets: $1,161,490.0 mil, Deposits: $905,653.0 mil, headquarters in Sioux Falls, SD, positive income, 6395 total offices, Holding Company: Wells Fargo & Company
- Blackhawk Bank & Trust: Lil'hawk Facility at 4610 38th Street, branch established on 1981/04/28. Info updated 2011/10/17: Bank assets: $1,009.6 mil, Deposits: $808.0 mil, headquarters in Milan, IL, positive income, Commercial Lending Specialization, 16 total offices, Holding Company: Blackhawk Bancorporation, Inc.
- MWABank: Mwabank at 100 17th Street, branch established on 2003/01/27. Info updated 2011/07/21: Bank assets: $247.1 mil, Deposits: $196.6 mil, local headquarters, positive income, Mortgage Lending Specialization, 1 total offices
- THE National Bank: Rock Island Branch at 1800 Fifth Avenue, branch established on 2005/10/03. Info updated 2009/01/28: Bank assets: $1,088.2 mil, Deposits: $914.5 mil, headquarters in Moline, IL, positive income, Commercial Lending Specialization, 29 total offices, Holding Company: National Bancshares, Inc.
For population 15 years and over in Rock Island:
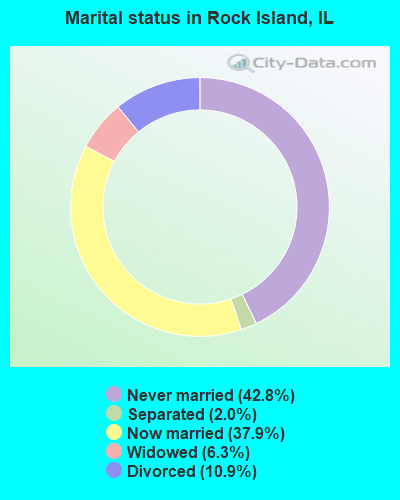
- Never married: 42.8%
- Now married: 37.9%
- Separated: 2.0%
- Widowed: 6.3%
- Divorced: 10.9%
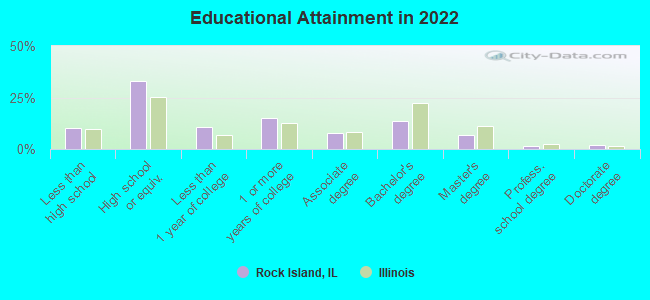
For population 25 years and over in Rock Island:
- High school or higher: 88.3%
- Bachelor's degree or higher: 22.5%
- Graduate or professional degree: 8.8%
- Unemployed: 5.2%
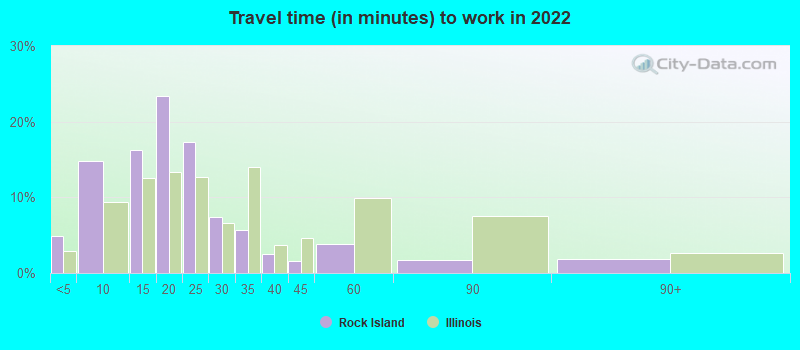
- Mean travel time to work (commute): 15.9 minutes
| Here: | 12.0 |
| Illinois average: | 12.5 |
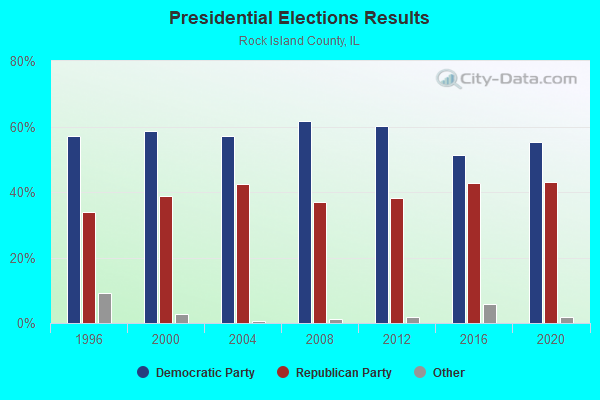
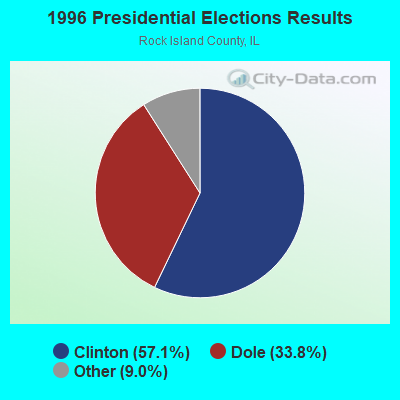
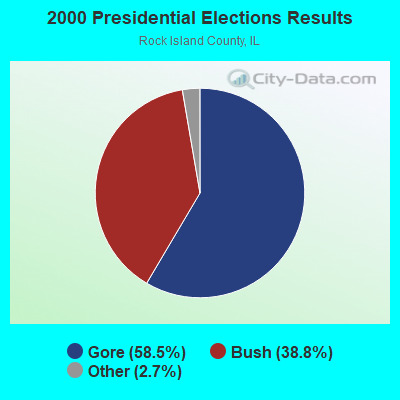
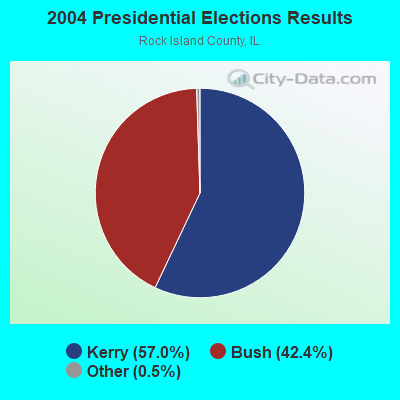
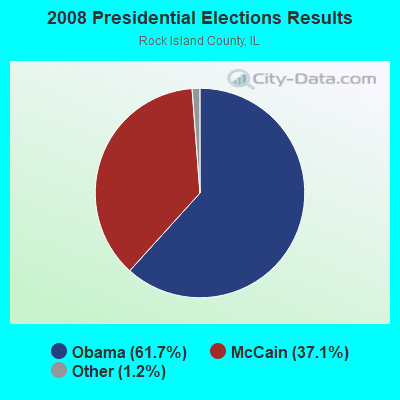
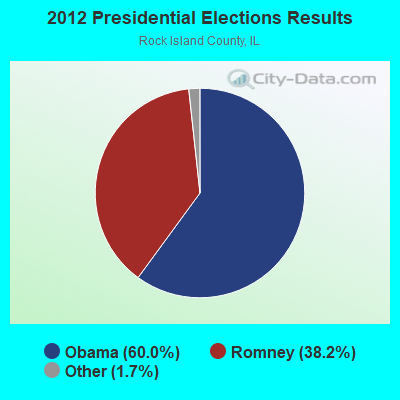
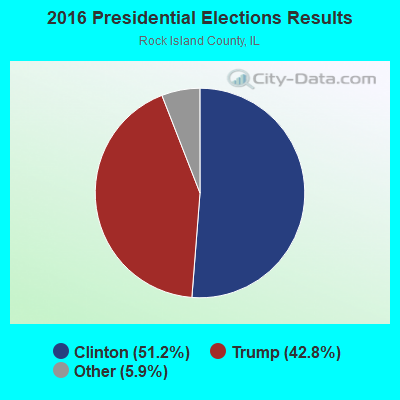

Graphs represent county-level data. Detailed 2008 Election Results
Religion statistics for Rock Island, IL (based on Rock Island County data)
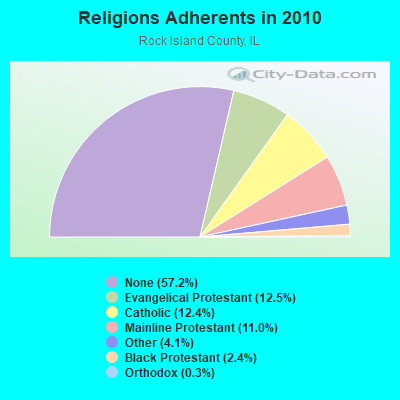
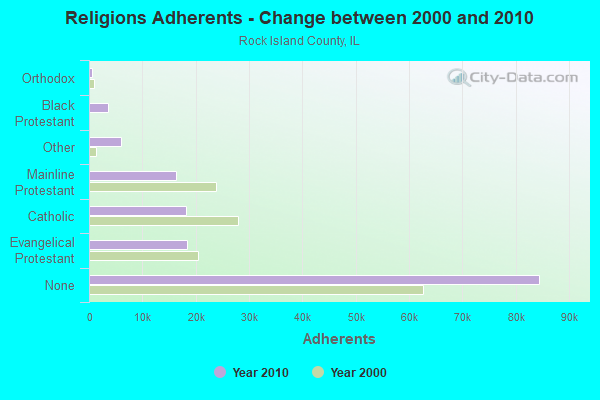
| Religion | Adherents | Congregations |
|---|---|---|
| Evangelical Protestant | 18,447 | 90 |
| Catholic | 18,258 | 14 |
| Mainline Protestant | 16,294 | 52 |
| Other | 6,037 | 12 |
| Black Protestant | 3,577 | 9 |
| Orthodox | 475 | 2 |
| None | 84,458 | - |
Food Environment Statistics:
| This county: | 1.56 / 10,000 pop. |
| Illinois: | 2.24 / 10,000 pop. |
| Here: | 0.07 / 10,000 pop. |
| Illinois: | 0.08 / 10,000 pop. |
| This county: | 0.88 / 10,000 pop. |
| Illinois: | 0.75 / 10,000 pop. |
| This county: | 4.01 / 10,000 pop. |
| Illinois: | 2.61 / 10,000 pop. |
| Rock Island County: | 7.54 / 10,000 pop. |
| Illinois: | 6.86 / 10,000 pop. |
| This county: | 9.3% |
| Illinois: | 8.3% |
| This county: | 26.9% |
| Illinois: | 25.2% |
| Rock Island County: | 7.5% |
| Illinois: | 14.5% |
Health and Nutrition:
| This city: | 49.3% |
| Illinois: | 49.5% |
| This city: | 46.3% |
| Illinois: | 47.2% |
| This city: | 28.8 |
| Illinois: | 28.6 |
| This city: | 20.9% |
| Illinois: | 20.5% |
| Here: | 11.2% |
| State: | 10.8% |
| This city: | 6.8 |
| Illinois: | 6.8 |
| This city: | 34.1% |
| State: | 33.4% |
| Here: | 55.4% |
| Illinois: | 56.4% |
| Here: | 78.6% |
| State: | 79.9% |
More about Health and Nutrition of Rock Island, IL Residents
| Local government employment and payroll (March 2022) | |||||
| Function | Full-time employees | Monthly full-time payroll | Average yearly full-time wage | Part-time employees | Monthly part-time payroll |
|---|---|---|---|---|---|
| Police Protection - Officers | 68 | $432,291 | $76,287 | 0 | $0 |
| Streets and Highways | 61 | $320,916 | $63,131 | 0 | $0 |
| Firefighters | 56 | $367,444 | $78,738 | 0 | $0 |
| Water Supply | 25 | $130,488 | $62,634 | 0 | $0 |
| Police - Other | 24 | $109,178 | $54,589 | 0 | $0 |
| Local Libraries | 17 | $86,128 | $60,796 | 0 | $0 |
| Other Government Administration | 15 | $45,541 | $36,433 | 0 | $0 |
| Housing and Community Development (Local) | 15 | $81,558 | $65,246 | 0 | $0 |
| Financial Administration | 14 | $80,819 | $69,273 | 0 | $0 |
| Sewerage | 14 | $74,554 | $63,903 | 0 | $0 |
| Other and Unallocable | 12 | $57,100 | $57,100 | 0 | $0 |
| Parks and Recreation | 9 | $50,976 | $67,968 | 0 | $0 |
| Solid Waste Management | 6 | $30,316 | $60,632 | 0 | $0 |
| Fire - Other | 1 | $5,111 | $61,332 | 0 | $0 |
| Health | 1 | $6,309 | $75,708 | 0 | $0 |
| Totals for Government | 338 | $1,878,728 | $66,700 | 0 | $0 |
Rock Island government finances - Expenditure in 2021 (per resident):
- Current Operations - Police Protection: $14,906,000 ($411.13)
Local Fire Protection: $13,742,000 ($379.03)
Water Utilities: $7,710,000 ($212.65)
General - Other: $5,659,000 ($156.08)
Parks and Recreation: $5,654,000 ($155.95)
Central Staff Services: $4,787,000 ($132.03)
Sewerage: $4,741,000 ($130.76)
Regular Highways: $4,628,000 ($127.65)
Libraries: $3,374,000 ($93.06)
Solid Waste Management: $2,112,000 ($58.25)
Financial Administration: $1,232,000 ($33.98)
General Public Buildings: $400,000 ($11.03)
Parking Facilities: $12,000 ($0.33)
- General - Interest on Debt: $3,869,000 ($106.71)
- Other Capital Outlay - Water Utilities: $6,663,000 ($183.78)
Central Staff Services: $2,749,000 ($75.82)
- Total Salaries and Wages: $25,322,000 ($698.42)
Rock Island government finances - Revenue in 2021 (per resident):
- Charges - Sewerage: $9,273,000 ($255.76)
Other: $8,019,000 ($221.18)
Parks and Recreation: $2,357,000 ($65.01)
Solid Waste Management: $2,229,000 ($61.48)
- Federal Intergovernmental - General Local Government Support: $1,702,000 ($46.94)
Other: $1,210,000 ($33.37)
- Local Intergovernmental - Other: $1,166,000 ($32.16)
- Miscellaneous - General Revenue - Other: $2,490,000 ($68.68)
Interest Earnings: $673,000 ($18.56)
Fines and Forfeits: $340,000 ($9.38)
- Revenue - Water Utilities: $8,773,000 ($241.97)
- State Intergovernmental - General Local Government Support: $13,750,000 ($379.25)
Highways: $2,277,000 ($62.80)
- Tax - Property: $19,506,000 ($538.01)
Other Selective Sales: $4,278,000 ($117.99)
Public Utilities Sales: $1,721,000 ($47.47)
Other License: $1,046,000 ($28.85)
Rock Island government finances - Debt in 2021 (per resident):
- Long Term Debt - Outstanding Unspecified Public Purpose: $64,818,000 ($1787.79)
Beginning Outstanding - Unspecified Public Purpose: $56,425,000 ($1556.29)
Issue, Unspecified Public Purpose: $12,355,000 ($340.77)
Retired Unspecified Public Purpose: $3,962,000 ($109.28)
Rock Island government finances - Cash and Securities in 2021 (per resident):
- Other Funds - Cash and Securities: $34,062,000 ($939.49)
| Businesses in Rock Island, IL | ||||
| Name | Count | Name | Count | |
|---|---|---|---|---|
| 7-Eleven | 4 | McDonald's | 2 | |
| Advance Auto Parts | 1 | Nike | 1 | |
| AutoZone | 1 | Pizza Hut | 1 | |
| CVS | 1 | Sears | 1 | |
| Circle K | 2 | Sprint Nextel | 1 | |
| Domino's Pizza | 1 | Subway | 2 | |
| FedEx | 2 | Taco Bell | 1 | |
| H&R Block | 2 | True Value | 1 | |
| Hardee's | 1 | U-Haul | 2 | |
| Holiday Inn | 1 | U.S. Cellular | 1 | |
| KFC | 1 | UPS | 3 | |
| La-Z-Boy | 1 | Walgreens | 2 | |
| Lane Furniture | 1 | Wendy's | 1 | |
| Little Caesars Pizza | 2 | |||
Strongest AM radio stations in Rock Island:
- WFXN (1230 AM; 1 kW; MOLINE, IL; Owner: CITICASTERS LICENSES, L.P.)
- WKBF (1270 AM; 5 kW; ROCK ISLAND, IL; Owner: MERCURY BROADCASTING COMPANY, INC.)
- WOC (1420 AM; 5 kW; DAVENPORT, IA; Owner: CITICASTERS LICENSES, L.P.)
- KJOC (1170 AM; 1 kW; DAVENPORT, IA; Owner: CUMULUS LICENSING CORP.)
- WDLM (960 AM; 1 kW; EAST MOLINE, IL; Owner: THE MOODY BIBLE INSTITUTE OF CHICAGO)
- WSCR (670 AM; 50 kW; CHICAGO, IL; Owner: INFINITY BROADCASTING OPERATIONS, INC.)
- WGN (720 AM; 50 kW; CHICAGO, IL; Owner: WGN CONTINENTAL BROADCASTING CO.)
- WBBM (780 AM; 50 kW; CHICAGO, IL; Owner: INFINITY BROADCASTING OPERATIONS, INC.)
- KXEL (1540 AM; 50 kW; WATERLOO, IA; Owner: KXEL BROADCASTING COMPANY, INC.)
- WTMJ (620 AM; 50 kW; MILWAUKEE, WI; Owner: JOURNAL BROADCAST CORPORATION)
- WLS (890 AM; 50 kW; CHICAGO, IL; Owner: WLS, INC.)
- WMVP (1000 AM; 50 kW; CHICAGO, IL; Owner: ABC, INC.)
- KCJJ (1630 AM; 10 kW; IOWA CITY, IA; Owner: RIVER CITY RADIO, INC.)
Strongest FM radio stations in Rock Island:
- WLLR-FM (103.7 FM; DAVENPORT, IA; Owner: CITICASTERS LICENSES, L.P.)
- WVIK (90.3 FM; ROCK ISLAND, IL; Owner: AUGUSTANA COLLEGE)
- WDLM-FM (89.3 FM; EAST MOLINE, IL; Owner: THE MOODY BIBLE INSTITUTE OF CHICAGO)
- KCQQ (106.5 FM; DAVENPORT, IA; Owner: CITICASTERS LICENSES, L.P.)
- KMXG (96.1 FM; CLINTON, IA; Owner: CITICASTERS LICENSES, L.P.)
- WHTS (98.9 FM; ROCK ISLAND, IL; Owner: MERCURY BROADCASTING COMPANY, INC.)
- KUUL (101.3 FM; EAST MOLINE, IL; Owner: CITICASTERS LICENSES, L.P.)
- K233AA (94.5 FM; DAVENPORT, IA; Owner: UNIVERSITY OF NORTHERN IOWA)
- KALA (88.5 FM; DAVENPORT, IA; Owner: ST. AMBROSE COLLEGE)
- K288CY (105.5 FM; BETTENDORF, IA; Owner: ST. AMBROSE COLLEGE)
- WXLP (96.9 FM; MOLINE, IL; Owner: CUMULUS LICENSING CORP.)
- KORB (93.5 FM; BETTENDORF, IA; Owner: CUMULUS LICENSING CORP.)
- KBOB-FM (104.9 FM; GENESEO, IL; Owner: CUMULUS LICENSING CORP.)
- KBEA-FM (99.7 FM; MUSCATINE, IA; Owner: CUMULUS LICENSING CORP.)
- KSUI (91.7 FM; IOWA CITY, IA; Owner: THE UNIVERSITY OF IOWA)
- WAXR (88.1 FM; GENESEO, IL; Owner: AMERICAN FAMILY ASSOCIATION)
- KWCC (93.1 FM; MUSCATINE, IA; Owner: WPW BROADCASTING, INC.)
- WRMJ (102.3 FM; ALEDO, IL; Owner: WESTERN ILLINOIS BROADCASTING, INC.)
TV broadcast stations around Rock Island:
- WHBF-TV (Channel 4; ROCK ISLAND, IL; Owner: CORONET COMMUNICATIONS COMPANY)
- KQIN (Channel 36; DAVENPORT, IA; Owner: IOWA PUBLIC BROADCASTING BOARD)
- WBQD-LP (Channel 26; DAVENPORT, IA; Owner: FOUR SEASONS PEORIA, LLC)
- K61HD (Channel 61; DAVENPORT, IA; Owner: TRINITY BROADCASTING NETWORK)
- KWQC-TV (Channel 6; DAVENPORT, IA; Owner: YOUNG BROADCASTING OF DAVENPORT, INC.)
- KLJB-TV (Channel 18; DAVENPORT, IA; Owner: QUAD CITIES TELEVISION ACQUISITION CORP.)
- WQAD-TV (Channel 8; MOLINE, IL; Owner: NEW YORK TIMES MANAGEMENT SERVICES)
- WQPT-TV (Channel 24; MOLINE, IL; Owner: BLACK HAWK COLLEGE)
- K16EL (Channel 66; DAVENPORT, IA; Owner: THREE ANGELS BROADCASTING NETWORK)
- KIIN (Channel 12; IOWA CITY, IA; Owner: IOWA PUBLIC BROADCASTING BOARD)
- KWKB (Channel 20; IOWA CITY, IA; Owner: KM TELEVISION OF IOWA, L.L.C.)
- National Bridge Inventory (NBI) Statistics
- 40Number of bridges
- 1,001ft / 305mTotal length
- $14,112,000Total costs
- 337,175Total average daily traffic
- 40,282Total average daily truck traffic
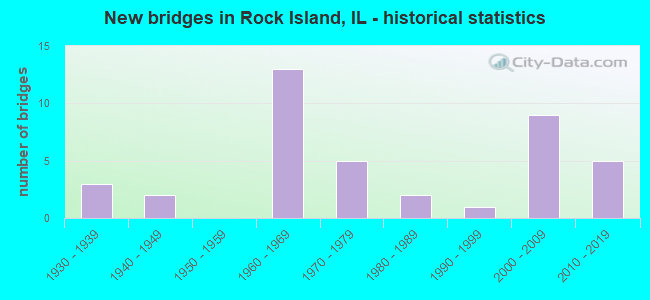
- New bridges - historical statistics
- 31930-1939
- 21940-1949
- 131960-1969
- 51970-1979
- 21980-1989
- 11990-1999
- 92000-2009
- 52010-2019
FCC Registered Antenna Towers: 78 (See the full list of FCC Registered Antenna Towers)
FCC Registered Commercial Land Mobile Towers: 4 (See the full list of FCC Registered Commercial Land Mobile Towers in Rock Island, IL)
FCC Registered Broadcast Land Mobile Towers: 32 (See the full list of FCC Registered Broadcast Land Mobile Towers)
FCC Registered Microwave Towers: 33 (See the full list of FCC Registered Microwave Towers in this town)
FCC Registered Paging Towers: 1 (See the full list of FCC Registered Paging Towers)
FCC Registered Maritime Coast & Aviation Ground Towers: 2 (See the full list of FCC Registered Maritime Coast & Aviation Ground Towers)
FCC Registered Amateur Radio Licenses: 117 (See the full list of FCC Registered Amateur Radio Licenses in Rock Island)
FAA Registered Aircraft: 18 (See the full list of FAA Registered Aircraft in Rock Island)
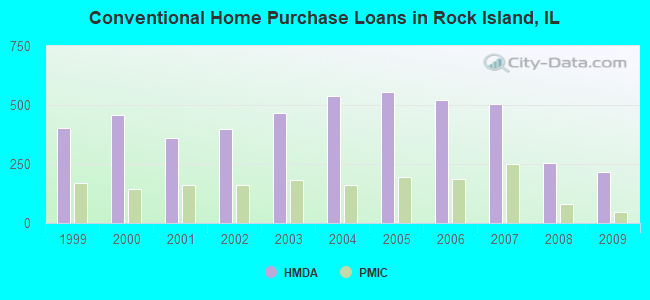
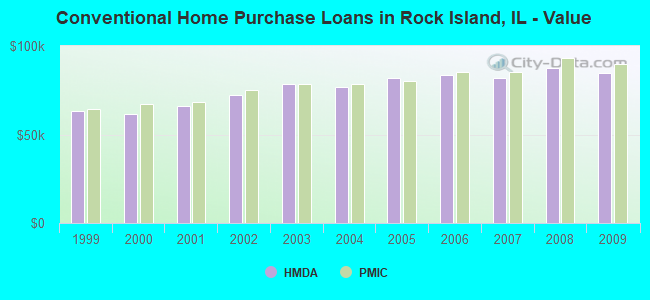
| Home Mortgage Disclosure Act Aggregated Statistics For Year 2009 (Based on 12 full and 2 partial tracts) | ||||||||||||||
| A) FHA, FSA/RHS & VA Home Purchase Loans | B) Conventional Home Purchase Loans | C) Refinancings | D) Home Improvement Loans | E) Loans on Dwellings For 5+ Families | F) Non-occupant Loans on < 5 Family Dwellings (A B C & D) | G) Loans On Manufactured Home Dwelling (A B C & D) | ||||||||
|---|---|---|---|---|---|---|---|---|---|---|---|---|---|---|
| Number | Average Value | Number | Average Value | Number | Average Value | Number | Average Value | Number | Average Value | Number | Average Value | Number | Average Value | |
| LOANS ORIGINATED | 203 | $91,940 | 216 | $84,518 | 790 | $94,393 | 185 | $25,345 | 2 | $65,000 | 101 | $62,987 | 0 | $0 |
| APPLICATIONS APPROVED, NOT ACCEPTED | 5 | $102,766 | 12 | $93,433 | 96 | $90,661 | 6 | $41,867 | 0 | $0 | 6 | $87,000 | 0 | $0 |
| APPLICATIONS DENIED | 20 | $91,947 | 24 | $69,833 | 218 | $87,698 | 68 | $20,402 | 0 | $0 | 14 | $38,165 | 2 | $39,600 |
| APPLICATIONS WITHDRAWN | 12 | $79,401 | 16 | $84,990 | 120 | $98,572 | 20 | $23,015 | 1 | $260,000 | 9 | $53,213 | 0 | $0 |
| FILES CLOSED FOR INCOMPLETENESS | 0 | $0 | 0 | $0 | 24 | $102,256 | 1 | $52,000 | 0 | $0 | 0 | $0 | 1 | $17,210 |
Detailed mortgage data for all 14 tracts in Rock Island, IL
| Private Mortgage Insurance Companies Aggregated Statistics For Year 2009 (Based on 10 full and 2 partial tracts) | ||||
| A) Conventional Home Purchase Loans | B) Refinancings | |||
|---|---|---|---|---|
| Number | Average Value | Number | Average Value | |
| LOANS ORIGINATED | 48 | $89,854 | 50 | $107,712 |
| APPLICATIONS APPROVED, NOT ACCEPTED | 7 | $87,884 | 10 | $104,195 |
| APPLICATIONS DENIED | 4 | $79,882 | 5 | $90,000 |
| APPLICATIONS WITHDRAWN | 1 | $134,370 | 3 | $109,837 |
| FILES CLOSED FOR INCOMPLETENESS | 0 | $0 | 0 | $0 |
2003 - 2018 National Fire Incident Reporting System (NFIRS) incidents
- Fire incident types reported to NFIRS in Rock Island, IL
- 32443.4%Structure Fires
- 21729.1%Outside Fires
- 13017.4%Mobile Property/Vehicle Fires
- 7510.1%Other
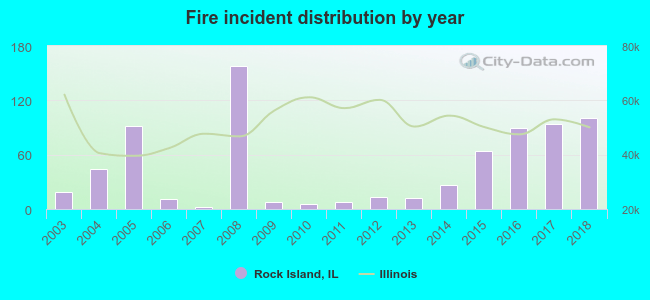 According to the data from the years 2003 - 2018 the average number of fire incidents per year is 47. The highest number of fires - 158 took place in 2008, and the least - 2 in 2007. The data has a growing trend.
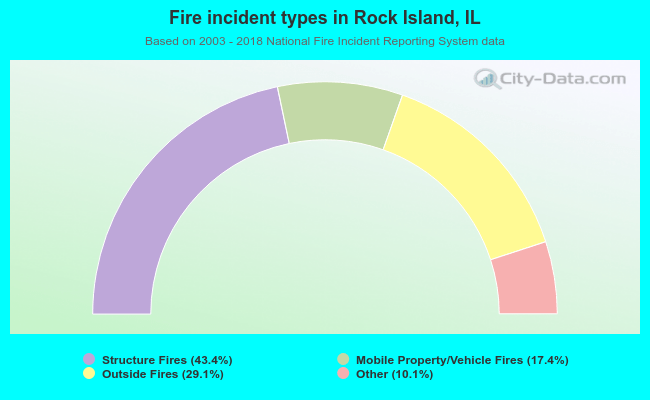 When looking into fire subcategories, the most incidents belonged to: Structure Fires (43.4%), and Outside Fires (29.1%).
Fire-safe hotels and motels in Rock Island, Illinois:
- Holiday Inn Rock Island, 226 17TH St, Rock Island, Illinois 61201 , Phone: (309) 794-1212, Fax: (309) 794-0852
- Potter House, 1906 7TH Ave, Rock Island, Illinois 61201 , Phone: (309) 788-1906
- Hillside Inn Motel, 4715 11TH St, Rock Island, Illinois 61201 , Phone: (309) 788-0612
- Jumer's Casino & Hotel, 777 Jumer Dr, Rock Island, Illinois 61201 , Phone: (309) 756-4600, Fax: (309) 756-4605
| Most common first names in Rock Island, IL among deceased individuals | ||
| Name | Count | Lived (average) |
|---|---|---|
| Mary | 393 | 78.7 years |
| John | 382 | 74.6 years |
| William | 321 | 75.2 years |
| Robert | 297 | 70.1 years |
| James | 295 | 70.1 years |
| Charles | 223 | 74.8 years |
| George | 217 | 76.5 years |
| Margaret | 216 | 81.7 years |
| Helen | 209 | 80.8 years |
| Dorothy | 192 | 79.3 years |
| Most common last names in Rock Island, IL among deceased individuals | ||
| Last name | Count | Lived (average) |
|---|---|---|
| Johnson | 227 | 77.1 years |
| Smith | 150 | 73.9 years |
| Anderson | 125 | 77.7 years |
| Miller | 100 | 74.1 years |
| Nelson | 84 | 78.1 years |
| Peterson | 76 | 80.0 years |
| Williams | 72 | 74.0 years |
| Davis | 72 | 72.0 years |
| Brown | 71 | 72.8 years |
| Jones | 65 | 72.7 years |
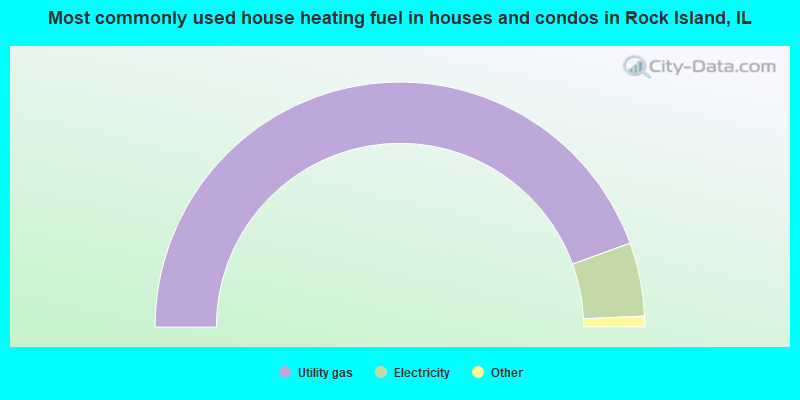
- 88.9%Utility gas
- 9.7%Electricity
- 0.6%Bottled, tank, or LP gas
- 0.6%Other fuel
- 0.1%No fuel used
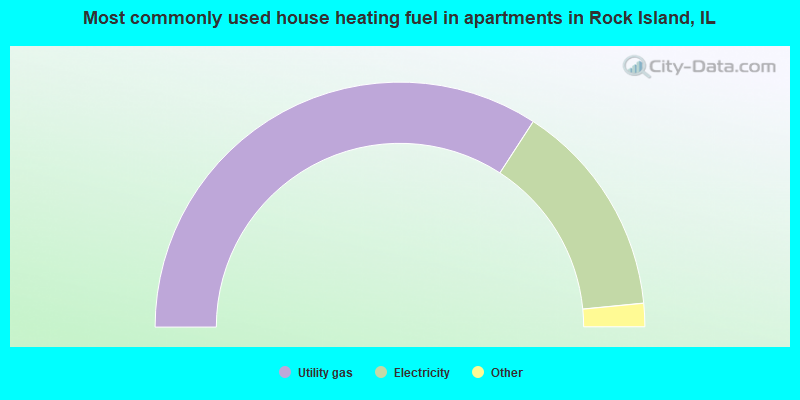
- 68.4%Utility gas
- 28.6%Electricity
- 1.6%No fuel used
- 0.8%Other fuel
- 0.5%Bottled, tank, or LP gas
- 0.1%Coal or coke
Rock Island compared to Illinois state average:
- Median house value below state average.
- Unemployed percentage significantly below state average.
- Foreign-born population percentage below state average.
- Length of stay since moving in above state average.
Rock Island on our top lists:
- #54 on the list of "Top 101 cities with the largest percentage of people in hospices or homes for chronically ill (population 1,000+)"
- #57 on the list of "Top 101 cities with the most residents born in Other South Central Asia (population 500+)"
- #52 on the list of "Top 101 counties with the largest increase in the number of births per 1000 residents 2000-2006 to 2007-2013 (pop 50,000+)"
- #79 on the list of "Top 101 counties with the largest number of people moving out compared to moving in (pop. 50,000+)"

|
|
Total of 72 patent applications in 2008-2024.