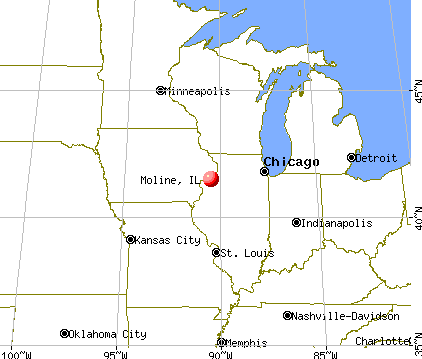
Moline, Illinois
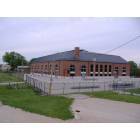
Moline: Browning Field
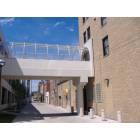
Moline: Skywalk downtown
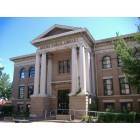
Moline: Library downtown Moline
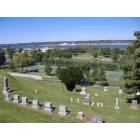
Moline: Riverside cemetery hillside
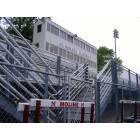
Moline: Browning Field bleachers
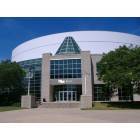
Moline: Mark of the Quad Cities Areana, Moline
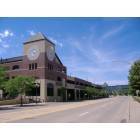
Moline: Central Station Downtown
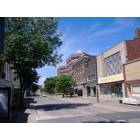
Moline: Downtown facing west
Moline: River Drive Trail summer
Moline: Deere Commons

Moline: Fall in Moline
- see
37
more - add
your
Submit your own pictures of this city and show them to the world
- OSM Map
- General Map
- Google Map
- MSN Map
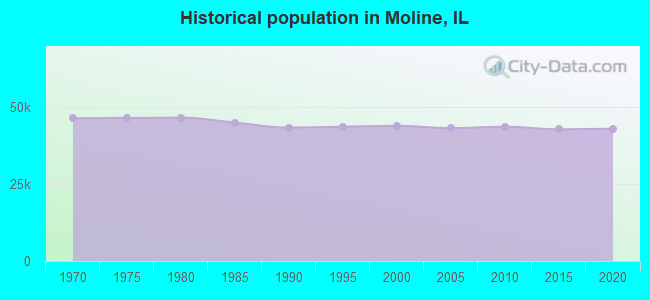
Population change since 2000: -4.0%
 |
| Males: 21,014 | |
| Females: 21,014 |
| Median resident age: | 38.7 years |
| Illinois median age: | 39.1 years |
Zip codes: 61265.
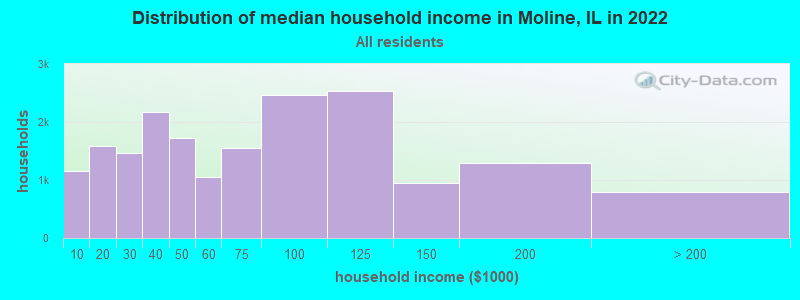
| Moline: | $61,236 |
| IL: | $76,708 |
Estimated per capita income in 2022: $34,760 (it was $21,557 in 2000)
Moline city income, earnings, and wages data
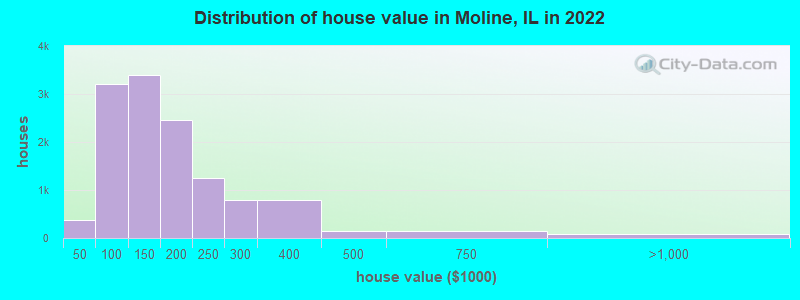
Estimated median house or condo value in 2022: $139,687 (it was $79,300 in 2000)
| Moline: | $139,687 |
| IL: | $251,600 |
Mean prices in 2022: all housing units: $165,816; detached houses: $165,646; townhouses or other attached units: $213,541; in 2-unit structures: $113,068; in 3-to-4-unit structures: $137,534; in 5-or-more-unit structures: $131,124; mobile homes: $36,361
Median gross rent in 2022: $829.
(11.0% for White Non-Hispanic residents, 44.7% for Black residents, 16.7% for Hispanic or Latino residents, 20.8% for American Indian residents, 16.1% for other race residents, 22.9% for two or more races residents)
Detailed information about poverty and poor residents in Moline, IL


Compare current foreclosures in Moline, IL:
| Photo | Address | Area | Beds / Baths | Price | Details |
|---|---|---|---|---|---|

|
#1
12th Ave
Moline, IL 61265
|
- sq. feet
|
2 baths 3 beds |
show details | |

|
#2
33rd St
Moline, IL 61265
|
1,061 sq. feet
|
1 baths 2 beds |
show details | |

|
#3
21st Ave
Moline, IL 61265
|
1,458 sq. feet
|
2 baths 4 beds |
show details | |

|
#4
50th Ave
Moline, IL 61265
|
- sq. feet
|
1 baths 3 beds |
show details | |

|
#5
32nd Ave
Moline, IL 61265
|
936 sq. feet
|
1 baths 3 beds |
show details | |

|
#6
11th Avenue A
Moline, IL 61265
|
988 sq. feet
|
- baths - beds |
show details | |

|
#7
31st St # A
Moline, IL 61265
|
- sq. feet
|
- baths - beds |
show details | |

|
#8
18th Ave
Moline, IL 61265
|
- sq. feet
|
- baths - beds |
show details | |

|
#9
23rd St
Moline, IL 61265
|
- sq. feet
|
- baths - beds |
show details | |

|
#10
12th Ave
Moline, IL 61265
|
- sq. feet
|
- baths - beds |
show details |
| Photo | Address | Area | Beds / Baths | Price | Details |
|---|---|---|---|---|---|

|
#11
15th St # B
Moline, IL 61265
|
- sq. feet
|
- baths - beds |
show details | |

|
#12
9th St
Moline, IL 61265
|
- sq. feet
|
- baths - beds |
show details | |

|
#13
13th Ave
Moline, IL 61265
|
- sq. feet
|
- baths - beds |
show details | |

|
#14
48th Ave
Moline, IL 61265
|
- sq. feet
|
- baths - beds |
show details | |

|
#15
45th St
Moline, IL 61265
|
- sq. feet
|
- baths - beds |
show details | |

|
#16
3rd St
Moline, IL 61265
|
- sq. feet
|
- baths - beds |
show details | |

|
#17
15th St
Moline, IL 61265
|
- sq. feet
|
- baths - beds |
show details | |

|
#18
27th Ave
Moline, IL 61265
|
- sq. feet
|
- baths - beds |
show details | |

|
#19
36th Ave
Moline, IL 61265
|
- sq. feet
|
- baths - beds |
show details | |

|
#20
11th Avenue B
Moline, IL 61265
|
- sq. feet
|
- baths - beds |
show details |
| Photo | Address | Area | Beds / Baths | Price | Details |
|---|---|---|---|---|---|

|
#21
44th St
Moline, IL 61265
|
- sq. feet
|
- baths - beds |
show details | |

|
#22
40th St
Moline, IL 61265
|
- sq. feet
|
- baths - beds |
show details | |

|
#23
12th Ave Apt 4
Moline, IL 61265
|
- sq. feet
|
- baths - beds |
show details | |

|
#24
15th St
Moline, IL 61265
|
- sq. feet
|
- baths - beds |
show details | |

|
#25
31st St
Moline, IL 61265
|
- sq. feet
|
- baths - beds |
show details | |

|
#26
18th Ave
Moline, IL 61265
|
- sq. feet
|
- baths - beds |
show details | |

|
#27
11th Ave # B
Moline, IL 61265
|
- sq. feet
|
- baths - beds |
show details | |

|
#28
15th Ave
Moline, IL 61265
|
- sq. feet
|
- baths - beds |
show details | |

|
#29
47th St
Moline, IL 61265
|
- sq. feet
|
- baths - beds |
show details | |

|
#30
14th St
Moline, IL 61265
|
- sq. feet
|
- baths - beds |
show details |
| Photo | Address | Area | Beds / Baths | Price | Details |
|---|---|---|---|---|---|

|
#31
51st Ave
Moline, IL 61265
|
- sq. feet
|
- baths - beds |
show details | |

|
#32
16th St
Moline, IL 61265
|
- sq. feet
|
- baths - beds |
show details | |

|
#33
15th St Ste 503
Moline, IL 61265
|
- sq. feet
|
- baths - beds |
show details | |

|
#34
38th Ave
Moline, IL 61265
|
- sq. feet
|
- baths - beds |
show details | |

|
#35
13th St
Moline, IL 61265
|
- sq. feet
|
- baths - beds |
show details | |

|
#36
17th Ave
Moline, IL 61265
|
- sq. feet
|
- baths - beds |
show details | |

|
#37
21st Ave
Moline, IL 61265
|
- sq. feet
|
- baths - beds |
show details | |

|
#38
13th St
Moline, IL 61265
|
- sq. feet
|
- baths - beds |
show details | |

|
#39
60th St Apt 1c
Moline, IL 61265
|
- sq. feet
|
- baths - beds |
show details | |

|
#40
36th St
Moline, IL 61265
|
- sq. feet
|
- baths - beds |
show details |
| Photo | Address | Area | Beds / Baths | Price | Details |
|---|---|---|---|---|---|

|
#41
4th Ave
Moline, IL 61265
|
- sq. feet
|
- baths - beds |
show details | |

|
#42
47th Ave
Moline, IL 61265
|
- sq. feet
|
- baths - beds |
show details | |

|
#43
Maple Ln
Moline, IL 61265
|
- sq. feet
|
- baths - beds |
show details | |

|
Check over 1 million property listings on Foreclosure.com!
|
browse all offers | |||


- 27,05864.8%White alone
- 7,46417.9%Hispanic
- 3,8619.2%Black alone
- 2,1595.2%Two or more races
- 8902.1%Asian alone
- 1690.4%Other race alone
- 250.06%American Indian alone
- 110.03%Native Hawaiian and Other
Pacific Islander alone
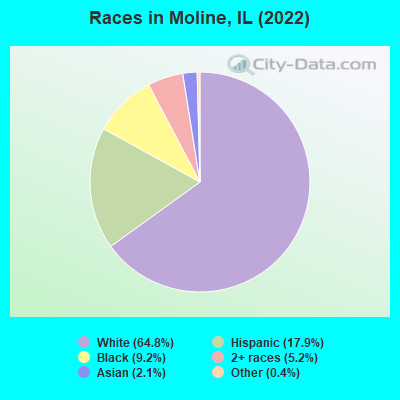
Races in Moline detailed stats: ancestries, foreign born residents, place of birth
According to our research of Illinois and other state lists, there were 75 registered sex offenders living in Moline, Illinois as of April 27, 2024.
The ratio of all residents to sex offenders in Moline is 564 to 1.
Type |
2009 |
2010 |
2011 |
2012 |
2013 |
2014 |
2015 |
2016 |
2017 |
2018 |
2019 |
2020 |
2021 |
2022 |
|---|---|---|---|---|---|---|---|---|---|---|---|---|---|---|
| Murders (per 100,000) | 0 (0.0) | 1 (2.3) | 0 (0.0) | 0 (0.0) | 0 (0.0) | 0 (0.0) | 1 (2.4) | 0 (0.0) | 0 (0.0) | 2 (4.8) | 1 (2.4) | 1 (2.4) | 0 (0.0) | 1 (2.4) |
| Rapes (per 100,000) | 0 (0.0) | 26 (59.8) | 34 (78.0) | 16 (36.8) | 8 (18.5) | 11 (25.6) | 28 (65.9) | 26 (61.2) | 31 (73.7) | 33 (78.5) | 40 (95.9) | 32 (77.8) | 68 (166.5) | 41 (97.6) |
| Robberies (per 100,000) | 23 (53.5) | 22 (50.6) | 18 (41.3) | 23 (52.9) | 13 (30.1) | 16 (37.2) | 19 (44.7) | 19 (44.7) | 20 (47.6) | 24 (57.1) | 26 (62.3) | 25 (60.8) | 16 (39.2) | 11 (26.2) |
| Assaults (per 100,000) | 184 (427.9) | 167 (384.1) | 159 (364.6) | 137 (314.9) | 100 (231.6) | 129 (299.9) | 131 (308.4) | 151 (355.2) | 173 (411.5) | 169 (401.9) | 156 (374.1) | 146 (355.0) | 170 (416.3) | 157 (373.7) |
| Burglaries (per 100,000) | 285 (662.9) | 302 (694.5) | 277 (635.1) | 204 (468.9) | 235 (544.3) | 232 (539.3) | 174 (409.6) | 227 (533.9) | 234 (556.6) | 190 (451.8) | 190 (455.6) | 225 (547.1) | 162 (396.7) | 183 (435.6) |
| Thefts (per 100,000) | 1,191 (2,770) | 1,140 (2,622) | 1,242 (2,848) | 1,095 (2,517) | 1,127 (2,610) | 1,196 (2,780) | 1,105 (2,601) | 1,205 (2,834) | 1,083 (2,576) | 780 (1,855) | 727 (1,743) | 745 (1,811) | 858 (2,101) | 831 (1,978) |
| Auto thefts (per 100,000) | 59 (137.2) | 45 (103.5) | 68 (155.9) | 55 (126.4) | 27 (62.5) | 19 (44.2) | 15 (35.3) | 27 (63.5) | 46 (109.4) | 80 (190.2) | 61 (146.3) | 76 (184.8) | 158 (387.0) | 176 (419.0) |
| Arson (per 100,000) | 12 (27.9) | 3 (6.9) | 5 (11.5) | 11 (25.3) | 9 (20.8) | 8 (18.6) | 3 (7.1) | 4 (9.4) | 7 (16.7) | 8 (19.0) | 3 (7.2) | 14 (34.0) | 7 (17.1) | 11 (26.2) |
| City-Data.com crime index | 269.8 | 306.2 | 318.5 | 251.9 | 217.7 | 244.1 | 268.1 | 289.2 | 306.3 | 290.8 | 288.4 | 281.9 | 371.0 | 308.6 |
The City-Data.com crime index weighs serious crimes and violent crimes more heavily. Higher means more crime, U.S. average is 246.1. It adjusts for the number of visitors and daily workers commuting into cities.
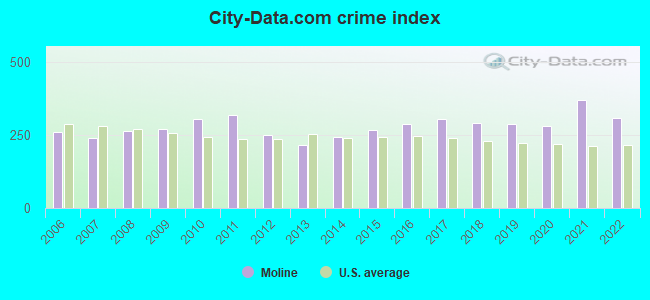
Crime rate in Moline detailed stats: murders, rapes, robberies, assaults, burglaries, thefts, arson
Full-time law enforcement employees in 2020, including police officers: 87 (81 officers - 67 male; 14 female).
| Officers per 1,000 residents here: | 1.97 |
| Illinois average: | 3.04 |
 Recent articles from our blog. Our writers, many of them Ph.D. graduates or candidates, create easy-to-read articles on a wide variety of topics.

 | I'd like input from Arizonans that have moved to Chicago (31 replies) |
| Anyone from the Quad Cities? (12 replies) |
| Tell me about Moline (2 replies) |
| Will Chicago's population pass 3 million by the 2030 census? (199 replies) |
| Illinois is headed for disaster and I don't want to be here for it (484 replies) |
| Three IL cities may merge. God bless them. (4 replies) |
Latest news from Moline, IL collected exclusively by city-data.com from local newspapers, TV, and radio stations
Ancestries: German (12.5%), English (6.2%), Irish (5.8%), American (5.7%), Swedish (4.1%), European (3.3%).
Current Local Time: CST time zone
Incorporated on 11/15/1872
Elevation: 600 feet
Land area: 15.6 square miles.
Population density: 2,694 people per square mile (average).
3,779 residents are foreign born (5.1% Latin America, 1.8% Africa, 1.6% Asia).
| This city: | 9.0% |
| Illinois: | 14.1% |
Median real estate property taxes paid for housing units with mortgages in 2022: $3,073 (2.3%)
Median real estate property taxes paid for housing units with no mortgage in 2022: $3,009 (2.0%)
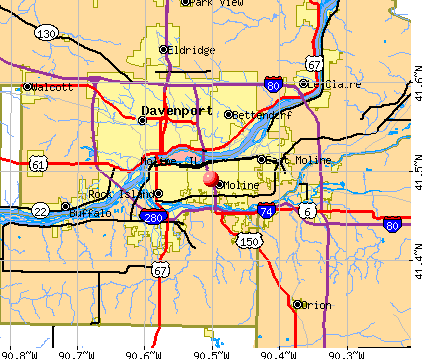
Nearest city with pop. 50,000+: Davenport, IA  (5.8 miles , pop. 98,359).
Nearest city with pop. 200,000+: Madison, WI (123.3 miles , pop. 208,054).
Nearest city with pop. 1,000,000+: Chicago, IL (147.8 miles , pop. 2,896,016).
Nearest cities:
Latitude: 41.49 N, Longitude: 90.50 W
Daytime population change due to commuting: +2,290 (+5.5%)
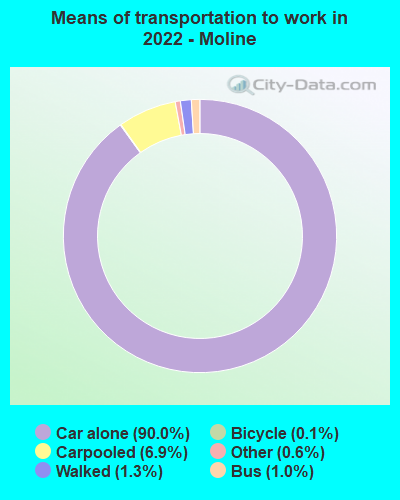
Workers who live and work in this city: 7,959 (38.5%)
Area code: 309
Moline tourist attractions:
Moline, Illinois accommodation & food services, waste management - Economy and Business Data
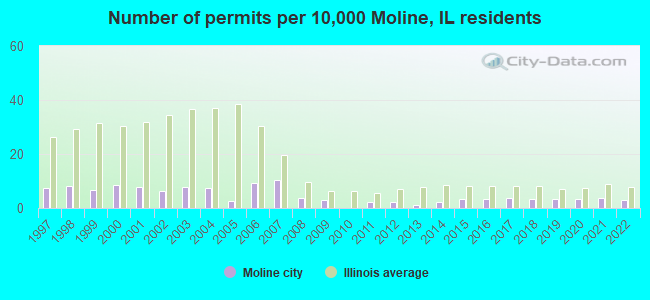
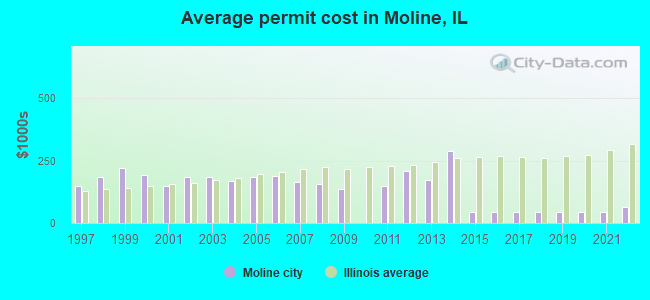
Single-family new house construction building permits:
- 2022: 13 buildings, average cost: $63,500
- 2021: 17 buildings, average cost: $46,000
- 2020: 15 buildings, average cost: $46,000
- 2019: 14 buildings, average cost: $46,000
- 2018: 15 buildings, average cost: $46,000
- 2017: 16 buildings, average cost: $46,000
- 2016: 15 buildings, average cost: $46,000
- 2015: 15 buildings, average cost: $46,000
- 2014: 10 buildings, average cost: $288,200
- 2013: 5 buildings, average cost: $172,400
- 2012: 10 buildings, average cost: $209,700
- 2011: 10 buildings, average cost: $147,100
- 2009: 13 buildings, average cost: $136,300
- 2008: 17 buildings, average cost: $156,900
- 2007: 46 buildings, average cost: $164,700
- 2006: 41 buildings, average cost: $188,300
- 2005: 11 buildings, average cost: $184,400
- 2004: 33 buildings, average cost: $166,700
- 2003: 34 buildings, average cost: $184,600
- 2002: 27 buildings, average cost: $184,200
- 2001: 34 buildings, average cost: $148,200
- 2000: 37 buildings, average cost: $193,300
- 1999: 30 buildings, average cost: $221,100
- 1998: 36 buildings, average cost: $184,100
- 1997: 32 buildings, average cost: $147,700
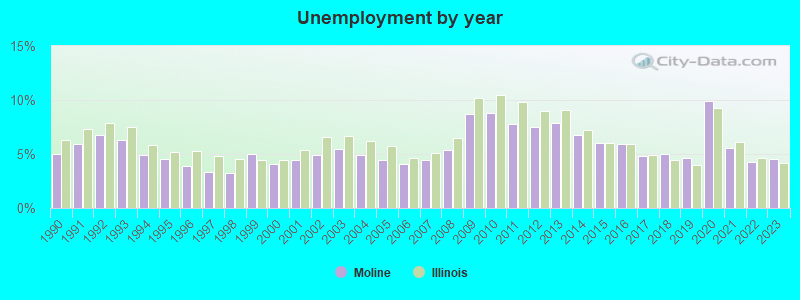
| Here: | 4.5% |
| Illinois: | 4.2% |
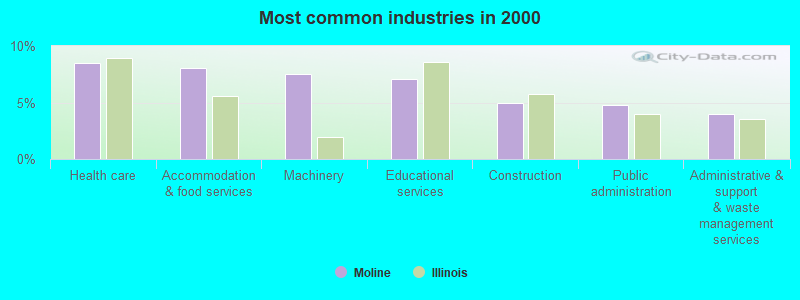
- Health care (8.5%)
- Accommodation & food services (8.0%)
- Machinery (7.5%)
- Educational services (7.1%)
- Construction (5.0%)
- Public administration (4.8%)
- Administrative & support & waste management services (4.0%)
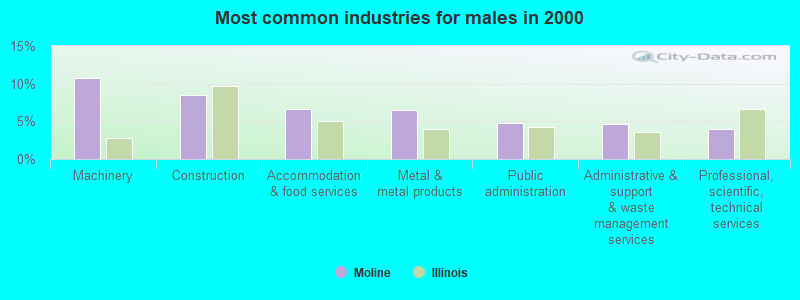
- Machinery (10.7%)
- Construction (8.5%)
- Accommodation & food services (6.6%)
- Metal & metal products (6.5%)
- Public administration (4.8%)
- Administrative & support & waste management services (4.7%)
- Professional, scientific, technical services (3.9%)
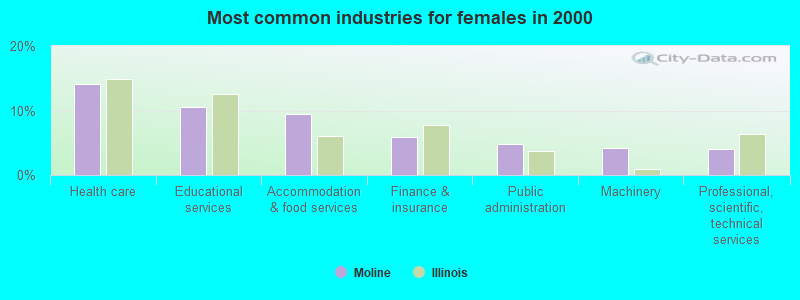
- Health care (14.1%)
- Educational services (10.5%)
- Accommodation & food services (9.5%)
- Finance & insurance (5.9%)
- Public administration (4.8%)
- Machinery (4.2%)
- Professional, scientific, technical services (4.0%)
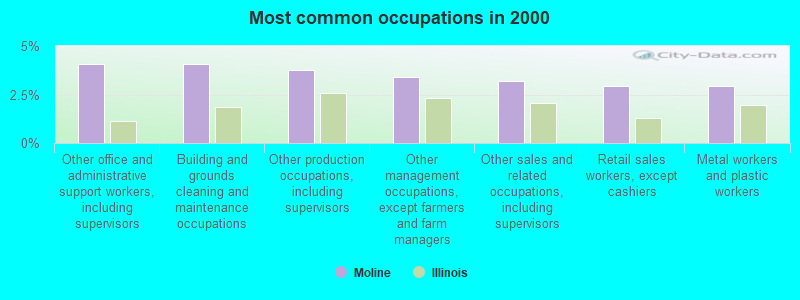
- Other office and administrative support workers, including supervisors (4.1%)
- Building and grounds cleaning and maintenance occupations (4.1%)
- Other production occupations, including supervisors (3.8%)
- Other management occupations, except farmers and farm managers (3.4%)
- Other sales and related occupations, including supervisors (3.2%)
- Retail sales workers, except cashiers (3.0%)
- Metal workers and plastic workers (2.9%)
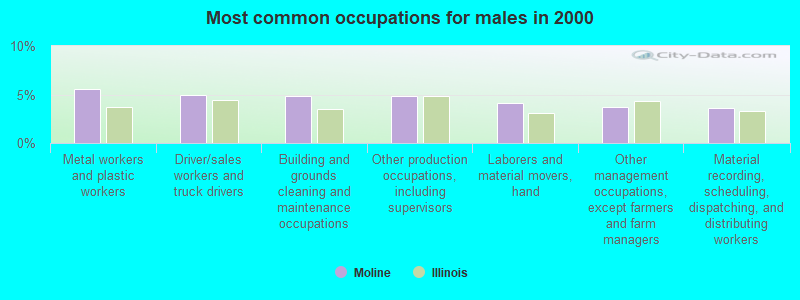
- Metal workers and plastic workers (5.6%)
- Driver/sales workers and truck drivers (5.0%)
- Building and grounds cleaning and maintenance occupations (4.8%)
- Other production occupations, including supervisors (4.8%)
- Laborers and material movers, hand (4.1%)
- Other management occupations, except farmers and farm managers (3.7%)
- Material recording, scheduling, dispatching, and distributing workers (3.6%)
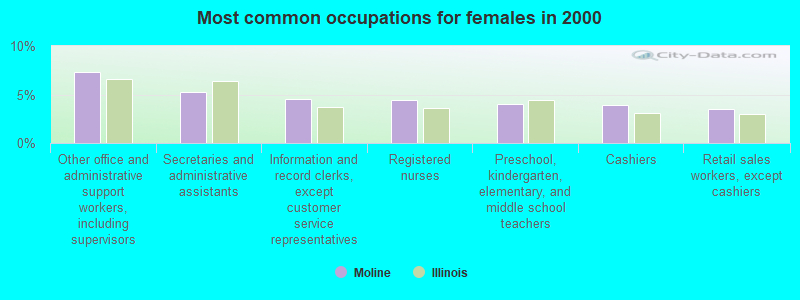
- Other office and administrative support workers, including supervisors (7.3%)
- Secretaries and administrative assistants (5.2%)
- Information and record clerks, except customer service representatives (4.5%)
- Registered nurses (4.5%)
- Preschool, kindergarten, elementary, and middle school teachers (4.0%)
- Cashiers (3.9%)
- Retail sales workers, except cashiers (3.5%)
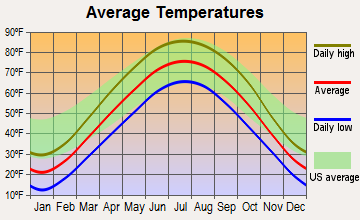
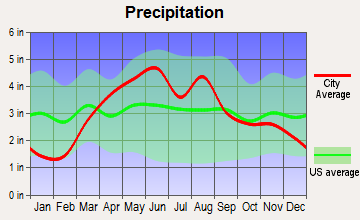
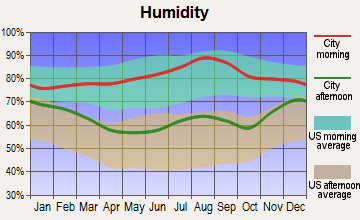
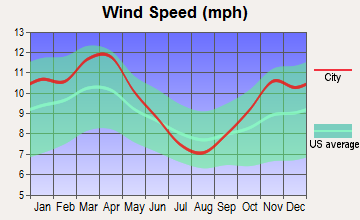
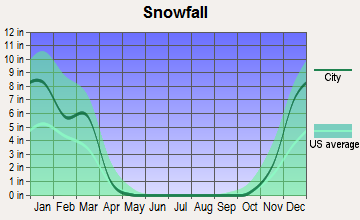
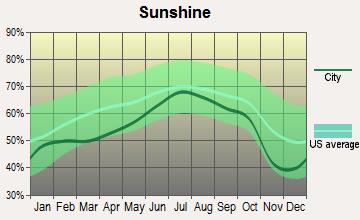
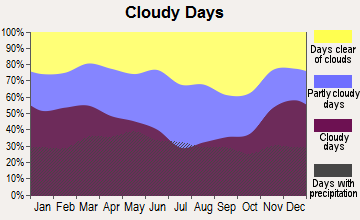
Average climate in Moline, Illinois
Based on data reported by over 4,000 weather stations
|
|

(lower is better)
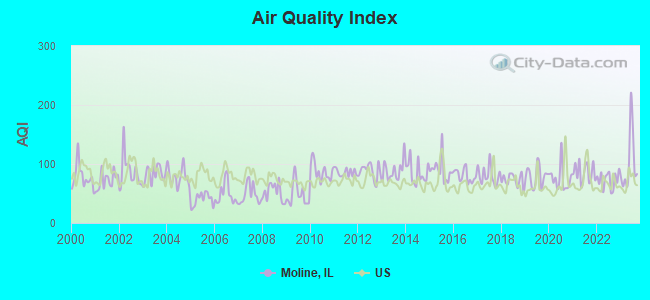
Air Quality Index (AQI) level in 2023 was 101. This is worse than average.
| City: | 101 |
| U.S.: | 73 |
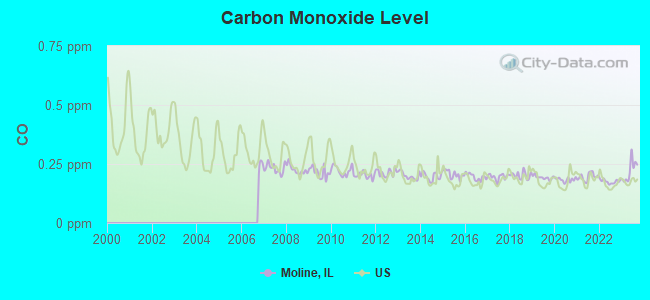
Carbon Monoxide (CO) [ppm] level in 2023 was 0.220. This is about average. Closest monitor was 1.2 miles away from the city center.
| City: | 0.220 |
| U.S.: | 0.251 |
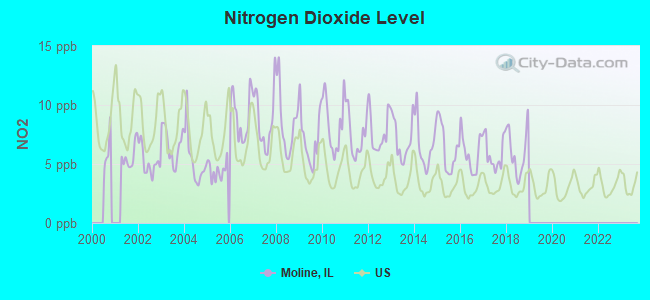
Nitrogen Dioxide (NO2) [ppb] level in 2018 was 6.00. This is about average. Closest monitor was 3.6 miles away from the city center.
| City: | 6.00 |
| U.S.: | 5.11 |
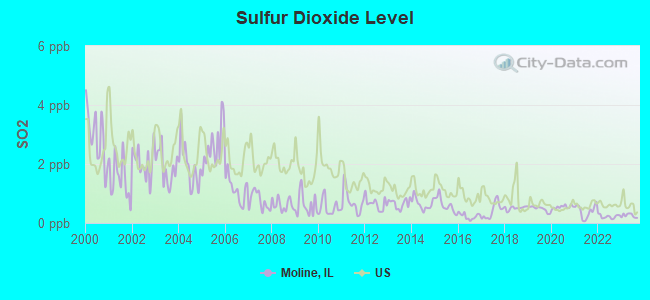
Sulfur Dioxide (SO2) [ppb] level in 2023 was 0.251. This is significantly better than average. Closest monitor was 3.6 miles away from the city center.
| City: | 0.251 |
| U.S.: | 1.515 |

Ozone [ppb] level in 2023 was 33.9. This is about average. Closest monitor was 1.6 miles away from the city center.
| City: | 33.9 |
| U.S.: | 33.3 |
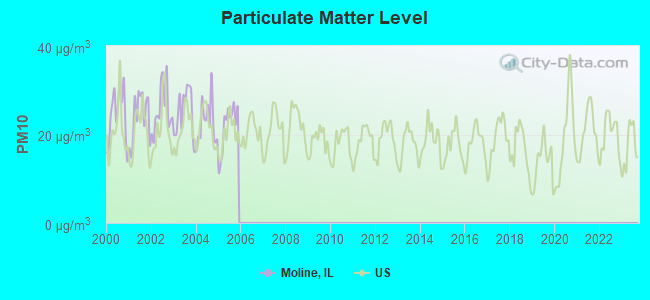
Particulate Matter (PM10) [µg/m3] level in 2005 was 21.7. This is about average. Closest monitor was 4.6 miles away from the city center.
| City: | 21.7 |
| U.S.: | 19.2 |
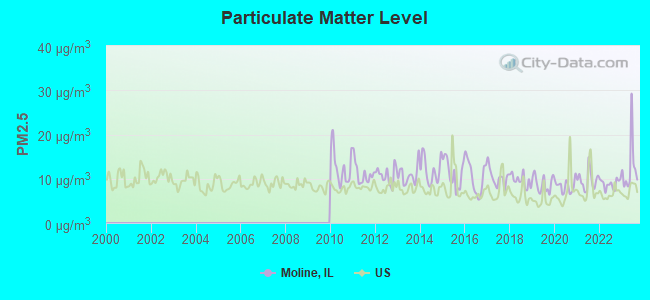
Particulate Matter (PM2.5) [µg/m3] level in 2023 was 12.4. This is significantly worse than average. Closest monitor was 1.6 miles away from the city center.
| City: | 12.4 |
| U.S.: | 8.1 |
Tornado activity:
Moline-area historical tornado activity is near Illinois state average. It is 76% greater than the overall U.S. average.
On 4/19/1966, a category F3 (max. wind speeds 158-206 mph) tornado 0.6 miles away from the Moline city center caused between $50,000 and $500,000 in damages.
On 3/29/1981, a category F4 (max. wind speeds 207-260 mph) tornado 31.4 miles away from the city center caused between $500,000 and $5,000,000 in damages.
Earthquake activity:
Moline-area historical earthquake activity is significantly above Illinois state average. It is 125% greater than the overall U.S. average.On 4/18/2008 at 09:36:59, a magnitude 5.4 (5.1 MB, 4.8 MS, 5.4 MW, 5.2 MW, Class: Moderate, Intensity: VI - VII) earthquake occurred 251.8 miles away from the city center
On 6/10/1987 at 23:48:54, a magnitude 5.1 (4.9 MB, 4.4 MS, 4.6 MS, 5.1 LG) earthquake occurred 230.7 miles away from Moline center
On 4/18/2008 at 09:36:59, a magnitude 5.2 (5.2 MW, Depth: 8.9 mi) earthquake occurred 251.8 miles away from Moline center
On 6/28/2004 at 06:10:52, a magnitude 4.2 (4.2 MW, Depth: 6.2 mi, Class: Light, Intensity: IV - V) earthquake occurred 83.0 miles away from the city center
On 6/18/2002 at 17:37:15, a magnitude 5.0 (4.3 MB, 4.6 MW, 5.0 LG) earthquake occurred 282.3 miles away from Moline center
On 4/18/2008 at 15:14:16, a magnitude 4.8 (4.5 MB, 4.8 MW, 4.6 MW) earthquake occurred 251.5 miles away from the city center
Magnitude types: regional Lg-wave magnitude (LG), body-wave magnitude (MB), surface-wave magnitude (MS), moment magnitude (MW)
Natural disasters:
The number of natural disasters in Rock Island County (14) is near the US average (15).Major Disasters (Presidential) Declared: 11
Emergencies Declared: 1
Causes of natural disasters: Floods: 11, Storms: 9, Hurricane: 1, Snowstorm: 1, Tornado: 1, Wind: 1, Winter Storm: 1, Other: 1 (Note: some incidents may be assigned to more than one category).
Main business address for: QCR HOLDINGS INC (STATE COMMERCIAL BANKS), DEERE & CO (FARM MACHINERY & EQUIPMENT).
Hospitals in Moline:
- HERITAGE FIFTY-THREE (4601 53RD STREET)
- ROSE HOUSE (7301 34TH AVENUE)
- SMITH SQUARE (7401 34TH AVENUE)
- TISH HEWITT HOUSE, THE (5102 52ND AVENUE)
- TRINITY MEDICAL CENTER-EAST (501 10TH AVE)
- TRINITY V N AND HOMECARE ASSN PATHWAY HOSPICE (106 19TH AVENUE, SUITE 101)
Nursing Homes in Moline:
Dialysis Facilities in Moline:
Home Health Centers in Moline:
Airports, heliports and other landing facilities located in Moline:
- Quad City International Airport (MLI) (Runways: 3, Commercial Ops: 4,035, Air Taxi Ops: 12,344, Itinerant Ops: 11,212, Local Ops: 6,007, Military Ops: 558)
- Trinity Medical Center - Moline Heliport (IS97)
- Quad-City Seaplane Base (I04)
Operable nuclear power plants near Moline:
- 16 miles: Quad Cities 1 and 2 in Cordova, IL.
Colleges/Universities in Moline:
Other colleges/universities with over 2000 students near Moline:
- Augustana College (about 3 miles; Rock Island, IL; Full-time enrollment: 2,555)
- Eastern Iowa Community College District (about 5 miles; Davenport, IA; FT enrollment: 5,507)
- Kaplan University-Davenport Campus (about 6 miles; Davenport, IA; FT enrollment: 60,376)
- Saint Ambrose University (about 6 miles; Davenport, IA; FT enrollment: 3,053)
- Ashford University (about 30 miles; Clinton, IA; FT enrollment: 73,330)
- University of Iowa (about 55 miles; Iowa City, IA; FT enrollment: 24,735)
- Southeastern Community College (about 59 miles; West Burlington, IA; FT enrollment: 2,251)
Public high schools in Moline:
- MOLINE SR HIGH SCHOOL (Students: 2,181, Location: 3600 AVENUE OF THE CITIES, Grades: 9-12)
- MOLINE HIGH SCH AT COOLIDGE CAMPUS (Location: 3428 AVENUE OF THE CITIES, Grades: 8-12)
Private high school in Moline:
Biggest public elementary/middle schools in Moline:
- WOODROW WILSON MIDDLE SCHOOL (Students: 586, Location: 1301 48TH ST, Grades: 6-8)
- JOHN DEERE MIDDLE SCHOOL (Students: 505, Location: 2035 11TH ST, Grades: 6-8)
- LINCOLN-IRVING ELEM SCHOOL (Students: 478, Location: 1015 16TH AVE, Grades: KG-5)
- LOGAN ELEM SCHOOL (Students: 466, Location: 1602 25TH ST, Grades: KG-5)
- ROOSEVELT ELEM SCHOOL (Students: 349, Location: 3530 AVENUE OF THE CITIES, Grades: PK-5)
- BUTTERWORTH ELEM SCHOOL (Students: 333, Location: 4205 48TH ST, Grades: KG-5)
- BENJAMIN FRANKLIN ELEM SCHOOL (Students: 316, Location: 5312 11TH AVENUE C, Grades: KG-5)
- GEORGE WASHINGTON ELEM SCHOOL (Students: 310, Location: 1550 41ST ST, Grades: PK-5)
- JANE ADDAMS ELEMENTARY SCHOOL (Students: 298, Location: 3520 53RD ST, Grades: KG-5)
- ERICSSON ELEM SCHOOL (Students: 177, Location: 335 5TH AVE, Grades: PK-5)
Private elementary/middle schools in Moline:
- SETON CATHOLIC SCHOOL (Students: 569, Location: 1320 16TH AVE, Grades: PK-8)
- VILLA MONTESSORI SCHOOL (Students: 111, Location: 2100 48TH ST, Grades: PK-5)
- TEMPLE CHRISTIAN ACADEMY (Students: 106, Location: 2305 7TH AVE, Grades: PK-6)
- ST PAULS LUTHERAN SCHOOL (Students: 46, Location: 153 19TH AVE, Grades: PK-8)
Library in Moline:
- MOLINE PUBLIC LIBRARY (Operating income: $2,820,188; Location: 3210 41ST STREET; 169,895 books; 11,525 e-books; 8,659 audio materials; 11,228 video materials; 6 local licensed databases; 17 state licensed databases; 2 other licensed databases; 495 print serial subscriptions; 1 electronic serial subscriptions)
User-submitted facts and corrections:
- brith place of william john smutz college stud (southern illinois universtiy illinois cougars) added by willie
- ken berry, of F-Troop television fame, was from Moline.
Points of interest:
Notable locations in Moline: Moline YMCA (A), FAA Weather Station (B), City Line Plaza (C), Wharton Field House (D), Moline Public Library (E), Moline Fire Department Training Center (F), Moline Fire Department Station 4 (G), Moline Fire Department Station 3 (H), Moline Fire Department Station 2 (I), Moline Fire Department Central Station (J). Display/hide their locations on the map
Shopping Center: Southpark Shopping Center (1). Display/hide its location on the map
Main business address in Moline: QCR HOLDINGS INC (A). Display/hide its location on the map
Churches in Moline include: Gospel Temple (A), Grace Korean Church (B), Elim Covenant Church (C), Community Christian Church (D), Kennedy Drive Baptist Church (E), Christ the King Catholic Church (F), Grace Baptist Church (G), Seventh Day Adventist Church (H), Gospel Assembly Church (I). Display/hide their locations on the map
Cemeteries: Memorial Park Cemetery (1), Riverside Cemetery (2), Rock River View Cemetery (3), Rose Lawn Memorial Estates Cemetery (4). Display/hide their locations on the map
Parks in Moline include: Peterson Park (1), Prospect Park (2), Riverside Park (3), Stephens Park (4), Green Valley Park (5), Kiwanis Park (6), Optimist Park (7), East End Park (8), Browning Field (9). Display/hide their locations on the map
Tourist attractions: Belgian Culture Center (Museums; 712 18th Avenue) (1), Deere & Company - Butterworth Center & Deere-Wiman House (Historical Places & Services; 1105 8th Street) (2). Display/hide their approximate locations on the map
Hotels: Comfort Inn Moline (2600 52nd Avenue) (1), Comfort Inn of Moline (2600 52nd Avenue) (2), Econo Lodge Moline (6920 27th Street) (3), Best Western Airport Inn (2550 52nd Avenue) (4), Hampton Inn Moline (6920 27th Street) (5), Country Inn-Suites Moline Arpt (2721 69th Avenue Court) (6), Fairfield Inn Moline Airport (2705 48th Ave) (7), Hampton Inn of Moline (6920 27th Street) (8), Exel Inn of Moline (2501 52nd Avenue) (9). Display/hide their approximate locations on the map
Courts: Federal Bureau Of Investigation (1515 5th Avenue) (1), Moline City - Circuit Court Clerk Traffic Tickets Etc (525 16th Street) (2). Display/hide their approximate locations on the map
Birthplace of: Ken Berry - Comedian, Nicholas Mayall - Astronomer, Warren E. Hearnes - Politician, Dean Stone - Baseball player, Don Sundquist - Politician, Dorothy Van - Artist, Dwight Deere Wiman - Actor, Katherine Lanpher - Journalist, Laurdine "Pat" Patrick - Musician, Theophilus Brown - Artist.
Drinking water stations with addresses in Moline and their reported violations in the past:
CLOVER LEAF VILLAGE MHP (Population served: 950, Purch surface water):Past monitoring violations:TESKES PET AND GARDEN CENTER (Address: 2423 16TH STREET , Population served: 25, Purch groundwater):
- Monitoring and Reporting (DBP) - Between JAN-2006 and DEC-2006, Contaminant: Total Haloacetic Acids (HAA5). Follow-up actions: St Public Notif requested (OCT-17-2006), St Violation/Reminder Notice (OCT-17-2006), St Public Notif received (NOV-19-2006), St Formal NOV issued (JUN-18-2007), St Compliance achieved (JUN-21-2007), St BCA signed (JUL-26-2007)
- Monitoring and Reporting (DBP) - Between JAN-2006 and DEC-2006, Contaminant: TTHM. Follow-up actions: St Public Notif requested (OCT-17-2006), St Violation/Reminder Notice (OCT-17-2006), St Public Notif received (NOV-19-2006), St Formal NOV issued (JUN-18-2007), St Compliance achieved (JUN-21-2007), St BCA signed (JUL-26-2007)
- One routine major monitoring violation
Past health violations:Past monitoring violations:
- MCL, Monthly (TCR) - Between JAN-2006 and DEC-2006, Contaminant: Coliform. Follow-up actions: St Formal NOV issued (MAY-23-2006), St Public Notif received (MAY-23-2006), St Public Notif requested (MAY-23-2006), St Compliance achieved (JUN-22-2006)
- One routine major monitoring violation
Drinking water stations with addresses in Moline that have no violations reported:
- HOLLARS (Address: 4050 27TH STREET , Population served: 75, Primary Water Source Type: Groundwater)
- NORTH SHORE INN (Population served: 75, Primary Water Source Type: Groundwater)
- MOLINE MISSIONARY CHURCH (Population served: 30, Primary Water Source Type: Groundwater)
- FRIZZELLE & PARSONS DIE SINKING (Population served: 28, Primary Water Source Type: Groundwater)
- HERITAGE NATURAL FOODS INC (Population served: 25, Primary Water Source Type: Purch groundwater)
| This city: | 2.3 people |
| Illinois: | 2.6 people |
| This city: | 61.2% |
| Whole state: | 65.8% |
| This city: | 7.3% |
| Whole state: | 6.3% |
Likely homosexual households (counted as self-reported same-sex unmarried-partner households)
- Lesbian couples: 0.3% of all households
- Gay men: 0.2% of all households
People in group quarters in Moline in 2010:
- 280 people in nursing facilities/skilled-nursing facilities
- 36 people in group homes intended for adults
- 6 people in other noninstitutional facilities
People in group quarters in Moline in 2000:
- 222 people in nursing homes
- 63 people in schools, hospitals, or wards for the intellectually disabled
- 16 people in homes for the mentally retarded
- 15 people in homes for the mentally ill
- 15 people in other noninstitutional group quarters
- 7 people in college dormitories (includes college quarters off campus)
- 7 people in religious group quarters
- 5 people in hospitals/wards and hospices for chronically ill
- 5 people in hospices or homes for chronically ill
Banks with most branches in Moline (2011 data):
- BankOrion: 69th Avenue Moline Branch, 44th Avenue Branch, Messenger Service In Moline. Info updated 2011/12/14: Bank assets: $404.8 mil, Deposits: $342.9 mil, headquarters in Orion, IL, positive income, 8 total offices, Holding Company: Orion Bancorporation, Inc.
- THE National Bank: Moline Facility, Wal-Mart Facility, The National Bank. Info updated 2009/01/28: Bank assets: $1,088.2 mil, Deposits: $914.5 mil, local headquarters, positive income, Commercial Lending Specialization, 29 total offices, Holding Company: National Bancshares, Inc.
- Wells Fargo Bank, National Association: 16th Street Branch, John Deere Road Branch, Moline Hy-Vee Branch. Info updated 2011/04/05: Bank assets: $1,161,490.0 mil, Deposits: $905,653.0 mil, headquarters in Sioux Falls, SD, positive income, 6395 total offices, Holding Company: Wells Fargo & Company
- Southeast National Bank: 53rd Street Facility at 5110 22nd Avenue, branch established on 1979/06/05; Moline Branch at 3535 Avenue Of The Cities, branch established on 1961/07/11. Info updated 2006/11/03: Bank assets: $139.0 mil, Deposits: $114.1 mil, headquarters in Davenport, IA, positive income, 4 total offices, Holding Company: Mclaughlin Holding Company
- Blackhawk Bank & Trust: Moline Valley Facility at 4100 - 44th Avenue, branch established on 1980/07/14; Moline Branch at 3600 70th Street, branch established on 1998/06/08. Info updated 2011/10/17: Bank assets: $1,009.6 mil, Deposits: $808.0 mil, headquarters in Milan, IL, positive income, Commercial Lending Specialization, 16 total offices, Holding Company: Blackhawk Bancorporation, Inc.
- JPMorgan Chase Bank, National Association: Moline Main Branch at 501 15th Street, branch established on 1998/03/20; City Line Branch at 151 Nineteenth Avenue, branch established on 1979/06/11. Info updated 2011/11/10: Bank assets: $1,811,678.0 mil, Deposits: $1,190,738.0 mil, headquarters in Columbus, OH, positive income, International Specialization, 5577 total offices, Holding Company: Jpmorgan Chase & Co.
- First Midwest Bank: Moline Main Branch at 506 15th Street, branch established on 1906/01/01; Moline 41st Street Branch at 2222 41st Street, branch established on 1958/01/01. Info updated 2011/12/22: Bank assets: $7,848.0 mil, Deposits: $6,529.2 mil, headquarters in Itasca, IL, positive income, Commercial Lending Specialization, 100 total offices, Holding Company: First Midwest Bancorp, Inc.
- U.S. Bank National Association: Quad Cities 22nd Branch at 4701 22nd Avenue, branch established on 1930/01/01. Info updated 2012/01/30: Bank assets: $330,470.8 mil, Deposits: $236,091.5 mil, headquarters in Cincinnati, OH, positive income, 3121 total offices, Holding Company: U.S. Bancorp
- American Bank and Trust Company, National Association: Moline Branch at 4051 Avenue Of The Cities, branch established on 1887/01/01. Info updated 2006/11/03: Bank assets: $465.6 mil, Deposits: $412.7 mil, headquarters in Davenport, IA, negative income in the last year, Commercial Lending Specialization, 11 total offices, Holding Company: Ambank Holdings, Inc.
- 5 other banks with 5 local branches
For population 15 years and over in Moline:
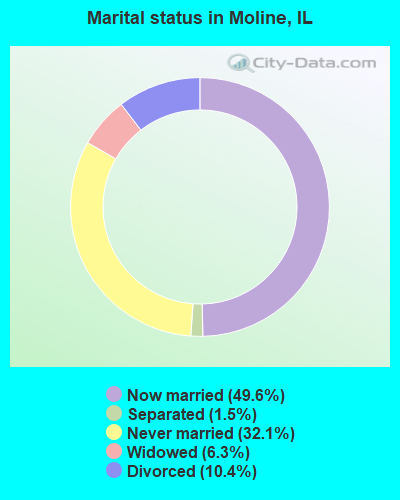
- Never married: 32.1%
- Now married: 49.6%
- Separated: 1.5%
- Widowed: 6.3%
- Divorced: 10.4%
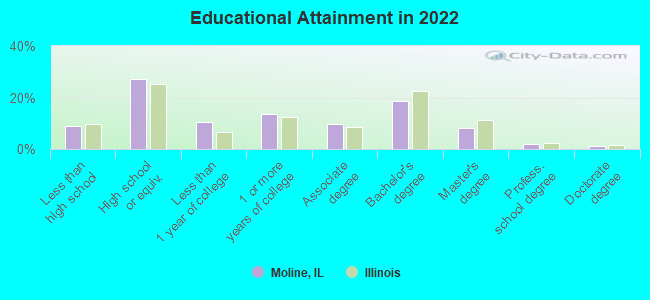
For population 25 years and over in Moline:
- High school or higher: 89.5%
- Bachelor's degree or higher: 28.5%
- Graduate or professional degree: 10.0%
- Unemployed: 5.8%
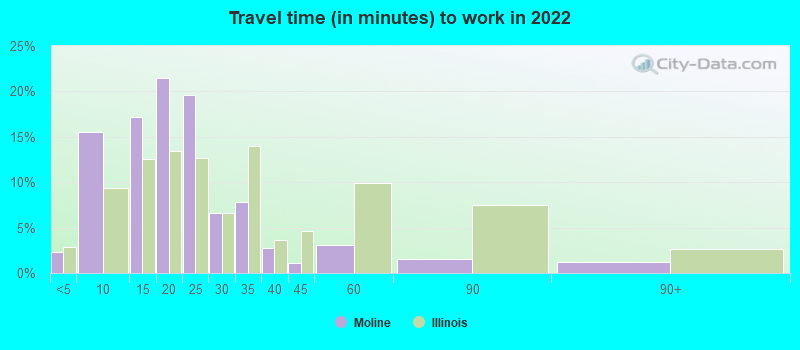
- Mean travel time to work (commute): 15.8 minutes
| Here: | 11.6 |
| Illinois average: | 12.5 |
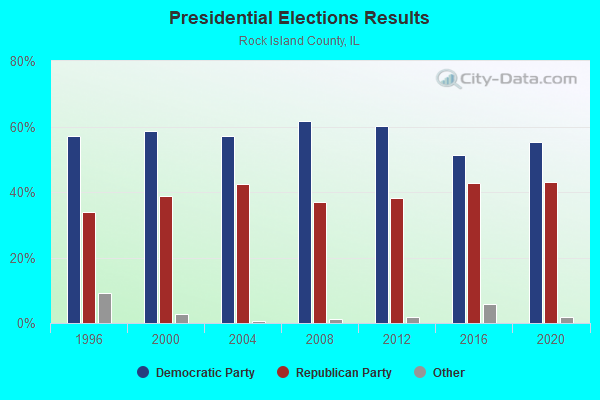
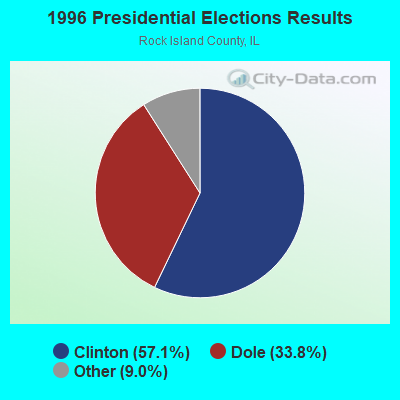
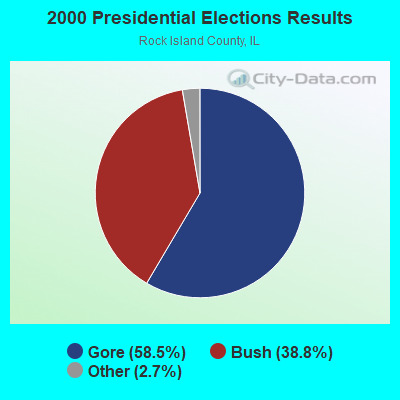
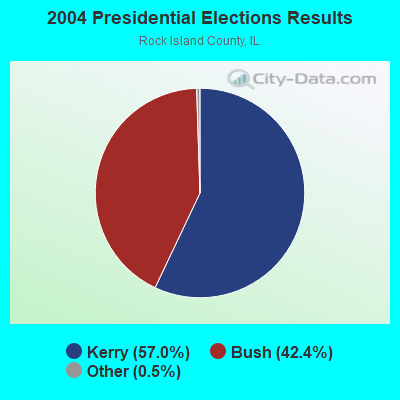
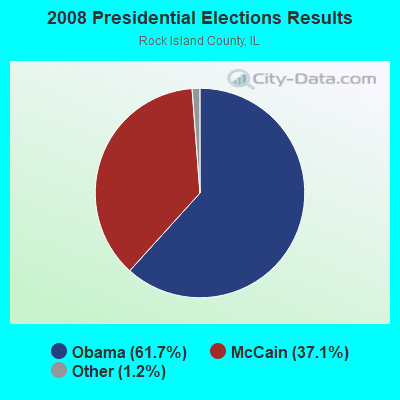
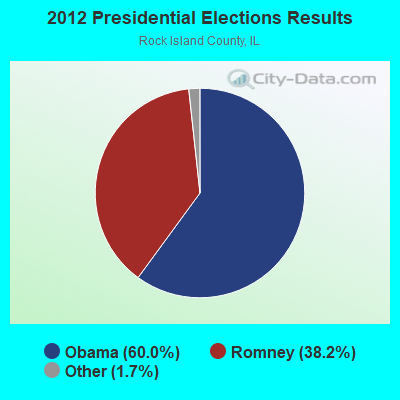
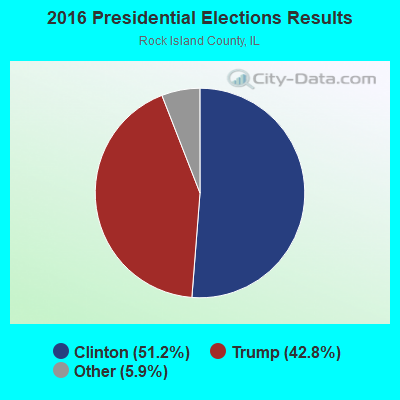

Graphs represent county-level data. Detailed 2008 Election Results
Religion statistics for Moline, IL (based on Rock Island County data)
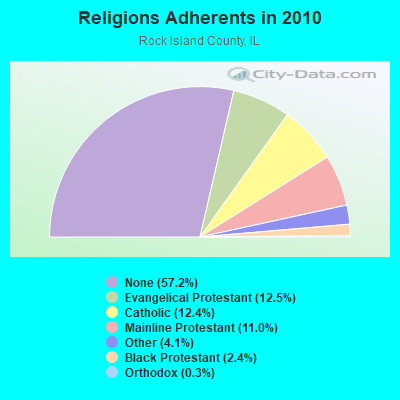
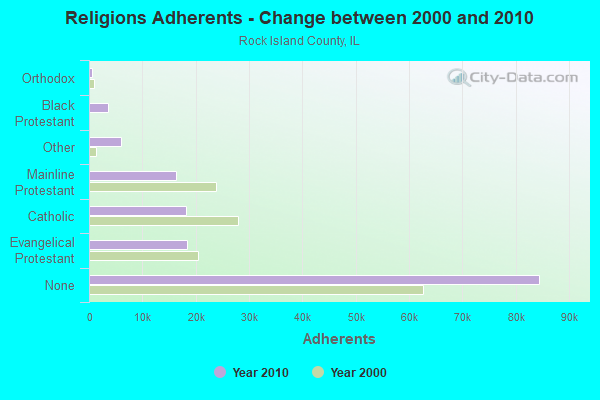
| Religion | Adherents | Congregations |
|---|---|---|
| Evangelical Protestant | 18,447 | 90 |
| Catholic | 18,258 | 14 |
| Mainline Protestant | 16,294 | 52 |
| Other | 6,037 | 12 |
| Black Protestant | 3,577 | 9 |
| Orthodox | 475 | 2 |
| None | 84,458 | - |
Food Environment Statistics:
| This county: | 1.56 / 10,000 pop. |
| Illinois: | 2.24 / 10,000 pop. |
| This county: | 0.07 / 10,000 pop. |
| Illinois: | 0.08 / 10,000 pop. |
| Rock Island County: | 0.88 / 10,000 pop. |
| Illinois: | 0.75 / 10,000 pop. |
| Rock Island County: | 4.01 / 10,000 pop. |
| State: | 2.61 / 10,000 pop. |
| This county: | 7.54 / 10,000 pop. |
| State: | 6.86 / 10,000 pop. |
| Rock Island County: | 9.3% |
| Illinois: | 8.3% |
| Rock Island County: | 26.9% |
| State: | 25.2% |
| Rock Island County: | 7.5% |
| Illinois: | 14.5% |
Health and Nutrition:
| Moline: | 48.8% |
| Illinois: | 49.5% |
| Moline: | 45.6% |
| Illinois: | 47.2% |
| Moline: | 28.5 |
| Illinois: | 28.6 |
| Moline: | 22.4% |
| Illinois: | 20.5% |
| Moline: | 10.3% |
| State: | 10.8% |
| Moline: | 6.8 |
| State: | 6.8 |
| Moline: | 33.8% |
| Illinois: | 33.4% |
| Moline: | 55.0% |
| Illinois: | 56.4% |
| Moline: | 77.8% |
| Illinois: | 79.9% |
More about Health and Nutrition of Moline, IL Residents
| Local government employment and payroll (March 2022) | |||||
| Function | Full-time employees | Monthly full-time payroll | Average yearly full-time wage | Part-time employees | Monthly part-time payroll |
|---|---|---|---|---|---|
| Police Protection - Officers | 81 | $579,983 | $85,923 | 0 | $0 |
| Firefighters | 62 | $530,647 | $102,706 | 0 | $0 |
| Streets and Highways | 38 | $214,137 | $67,622 | 0 | $0 |
| Other and Unallocable | 35 | $183,387 | $62,876 | 0 | $0 |
| Local Libraries | 32 | $162,385 | $60,894 | 0 | $0 |
| Water Supply | 30 | $192,238 | $76,895 | 0 | $0 |
| Sewerage | 22 | $128,763 | $70,234 | 0 | $0 |
| Financial Administration | 16 | $96,822 | $72,617 | 0 | $0 |
| Other Government Administration | 14 | $99,576 | $85,351 | 9 | $7,154 |
| Solid Waste Management | 7 | $35,513 | $60,879 | 0 | $0 |
| Police - Other | 7 | $36,410 | $62,417 | 16 | $6,523 |
| Parks and Recreation | 6 | $37,652 | $75,304 | 0 | $0 |
| Housing and Community Development (Local) | 3 | $17,546 | $70,184 | 0 | $0 |
| Judicial and Legal | 3 | $16,837 | $67,348 | 0 | $0 |
| Fire - Other | 1 | $4,258 | $51,096 | 0 | $0 |
| Health | 1 | $5,184 | $62,208 | 0 | $0 |
| Natural Resources | 1 | $6,714 | $80,568 | 0 | $0 |
| Totals for Government | 359 | $2,348,051 | $78,486 | 25 | $13,678 |
Moline government finances - Expenditure in 2021 (per resident):
- Construction - Parks and Recreation: $2,155,000 ($51.28)
Regular Highways: $1,959,000 ($46.61)
Solid Waste Management: $1,270,000 ($30.22)
Water Utilities: $1,004,000 ($23.89)
Central Staff Services: $565,000 ($13.44)
General - Other: $417,000 ($9.92)
- Current Operations - Police Protection: $16,606,000 ($395.12)
Water Utilities: $14,744,000 ($350.81)
Local Fire Protection: $14,565,000 ($346.55)
General - Other: $6,246,000 ($148.62)
Regular Highways: $3,234,000 ($76.95)
Libraries: $2,827,000 ($67.26)
Parks and Recreation: $2,639,000 ($62.79)
Central Staff Services: $1,682,000 ($40.02)
General Public Buildings: $1,206,000 ($28.70)
Financial Administration: $854,000 ($20.32)
Protective Inspection and Regulation - Other: $526,000 ($12.52)
Parking Facilities: $368,000 ($8.76)
- General - Interest on Debt: $7,595,000 ($180.71)
- Other Capital Outlay - Central Staff Services: $2,034,000 ($48.40)
Police Protection: $108,000 ($2.57)
- Total Salaries and Wages: $23,088,000 ($549.35)
Moline government finances - Revenue in 2021 (per resident):
- Charges - Other: $24,637,000 ($586.20)
Parks and Recreation: $354,000 ($8.42)
Parking Facilities: $18,000 ($0.43)
- Federal Intergovernmental - Public Welfare: $2,184,000 ($51.97)
Housing and Community Development: $458,000 ($10.90)
- Miscellaneous - General Revenue - Other: $1,793,000 ($42.66)
Interest Earnings: $568,000 ($13.51)
Fines and Forfeits: $258,000 ($6.14)
- State Intergovernmental - General Local Government Support: $18,330,000 ($436.14)
Highways: $2,643,000 ($62.89)
Housing and Community Development: $581,000 ($13.82)
Other: $234,000 ($5.57)
Public Welfare: $40,000 ($0.95)
- Tax - Property: $20,999,000 ($499.64)
Other Selective Sales: $8,120,000 ($193.20)
General Sales and Gross Receipts: $4,662,000 ($110.93)
Public Utilities Sales: $2,038,000 ($48.49)
Other License: $1,162,000 ($27.65)
Moline government finances - Debt in 2021 (per resident):
- Long Term Debt - Beginning Outstanding - Unspecified Public Purpose: $189,870,000 ($4517.70)
Outstanding Unspecified Public Purpose: $169,668,000 ($4037.02)
Retired Unspecified Public Purpose: $53,612,000 ($1275.63)
Issue, Unspecified Public Purpose: $33,410,000 ($794.95)
Moline government finances - Cash and Securities in 2021 (per resident):
- Other Funds - Cash and Securities: $49,421,000 ($1175.91)
| Businesses in Moline, IL | ||||
| Name | Count | Name | Count | |
|---|---|---|---|---|
| 7-Eleven | 4 | LensCrafters | 1 | |
| ALDI | 1 | Little Caesars Pizza | 1 | |
| AT&T | 1 | Long John Silver's | 1 | |
| Advance Auto Parts | 1 | Lowe's | 1 | |
| Aeropostale | 1 | Marriott | 2 | |
| American Eagle Outfitters | 1 | MasterBrand Cabinets | 3 | |
| Applebee's | 1 | Maurices | 1 | |
| Arby's | 2 | Mazda | 1 | |
| AutoZone | 1 | McDonald's | 3 | |
| Bath & Body Works | 1 | Menards | 1 | |
| Best Western | 1 | Motel 6 | 1 | |
| Blockbuster | 1 | Motherhood Maternity | 1 | |
| Budget Car Rental | 1 | New Balance | 2 | |
| Buffalo Wild Wings | 1 | Nike | 3 | |
| Burger King | 1 | Nissan | 1 | |
| CVS | 1 | OfficeMax | 1 | |
| Caribou Coffee | 1 | Old Navy | 1 | |
| Carson Pirie Scott | 1 | Pac Sun | 1 | |
| Catherines | 1 | Panera Bread | 1 | |
| Chevrolet | 1 | Papa John's Pizza | 2 | |
| Chick-Fil-A | 1 | Payless | 2 | |
| Comfort Inn | 1 | Pizza Hut | 1 | |
| Curves | 1 | Qdoba Mexican Grill | 1 | |
| DHL | 2 | RadioShack | 2 | |
| Dairy Queen | 2 | Ramada | 1 | |
| Days Inn | 1 | Rue21 | 1 | |
| Deb | 1 | Ryan's Grill | 1 | |
| Dennys | 2 | SAS Shoes | 2 | |
| Dunkin Donuts | 1 | Sears | 2 | |
| Express | 1 | Slumberland | 1 | |
| Famous Footwear | 2 | Spencer Gifts | 1 | |
| FedEx | 10 | Sprint Nextel | 2 | |
| Finish Line | 1 | Staples | 1 | |
| Firestone Complete Auto Care | 1 | Starbucks | 2 | |
| Ford | 1 | Steak 'n Shake | 1 | |
| GNC | 1 | Subaru | 1 | |
| GameStop | 2 | Subway | 6 | |
| Goodwill | 1 | Super 8 | 1 | |
| H&R Block | 3 | T.G.I. Driday's | 1 | |
| Hardee's | 2 | Taco Bell | 2 | |
| Honda | 1 | Target | 1 | |
| Hot Topic | 1 | The Limited | 1 | |
| Hyundai | 1 | Toyota | 1 | |
| IHOP | 1 | Toys"R"Us | 1 | |
| JCPenney | 1 | True Value | 1 | |
| Jewel-Osco | 1 | U-Haul | 2 | |
| Jones New York | 1 | U.S. Cellular | 2 | |
| Journeys | 1 | UPS | 14 | |
| Justice | 1 | Vans | 2 | |
| KFC | 1 | Verizon Wireless | 2 | |
| Kmart | 1 | Victoria's Secret | 1 | |
| Kohl's | 1 | Village Inn | 2 | |
| Kroger | 1 | Walgreens | 3 | |
| La Quinta | 1 | Walmart | 1 | |
| La-Z-Boy | 1 | Wendy's | 2 | |
| Lane Bryant | 1 | Wet Seal | 1 | |
| Lane Furniture | 2 | YMCA | 1 | |
Strongest AM radio stations in Moline:
- WKBF (1270 AM; 5 kW; ROCK ISLAND, IL; Owner: MERCURY BROADCASTING COMPANY, INC.)
- WFXN (1230 AM; 1 kW; MOLINE, IL; Owner: CITICASTERS LICENSES, L.P.)
- WOC (1420 AM; 5 kW; DAVENPORT, IA; Owner: CITICASTERS LICENSES, L.P.)
- WDLM (960 AM; 1 kW; EAST MOLINE, IL; Owner: THE MOODY BIBLE INSTITUTE OF CHICAGO)
- KJOC (1170 AM; 1 kW; DAVENPORT, IA; Owner: CUMULUS LICENSING CORP.)
- WSCR (670 AM; 50 kW; CHICAGO, IL; Owner: INFINITY BROADCASTING OPERATIONS, INC.)
- WGN (720 AM; 50 kW; CHICAGO, IL; Owner: WGN CONTINENTAL BROADCASTING CO.)
- WBBM (780 AM; 50 kW; CHICAGO, IL; Owner: INFINITY BROADCASTING OPERATIONS, INC.)
- WTMJ (620 AM; 50 kW; MILWAUKEE, WI; Owner: JOURNAL BROADCAST CORPORATION)
- KXEL (1540 AM; 50 kW; WATERLOO, IA; Owner: KXEL BROADCASTING COMPANY, INC.)
- WLS (890 AM; 50 kW; CHICAGO, IL; Owner: WLS, INC.)
- WMVP (1000 AM; 50 kW; CHICAGO, IL; Owner: ABC, INC.)
- WYLL (1160 AM; 50 kW; CHICAGO, IL; Owner: SCA LICENSE CORPORATION)
Strongest FM radio stations in Moline:
- WLLR-FM (103.7 FM; DAVENPORT, IA; Owner: CITICASTERS LICENSES, L.P.)
- WVIK (90.3 FM; ROCK ISLAND, IL; Owner: AUGUSTANA COLLEGE)
- WDLM-FM (89.3 FM; EAST MOLINE, IL; Owner: THE MOODY BIBLE INSTITUTE OF CHICAGO)
- KCQQ (106.5 FM; DAVENPORT, IA; Owner: CITICASTERS LICENSES, L.P.)
- KMXG (96.1 FM; CLINTON, IA; Owner: CITICASTERS LICENSES, L.P.)
- WHTS (98.9 FM; ROCK ISLAND, IL; Owner: MERCURY BROADCASTING COMPANY, INC.)
- KUUL (101.3 FM; EAST MOLINE, IL; Owner: CITICASTERS LICENSES, L.P.)
- WXLP (96.9 FM; MOLINE, IL; Owner: CUMULUS LICENSING CORP.)
- KORB (93.5 FM; BETTENDORF, IA; Owner: CUMULUS LICENSING CORP.)
- WAXR (88.1 FM; GENESEO, IL; Owner: AMERICAN FAMILY ASSOCIATION)
- KALA (88.5 FM; DAVENPORT, IA; Owner: ST. AMBROSE COLLEGE)
- KBOB-FM (104.9 FM; GENESEO, IL; Owner: CUMULUS LICENSING CORP.)
- K288CY (105.5 FM; BETTENDORF, IA; Owner: ST. AMBROSE COLLEGE)
- KBEA-FM (99.7 FM; MUSCATINE, IA; Owner: CUMULUS LICENSING CORP.)
- KSUI (91.7 FM; IOWA CITY, IA; Owner: THE UNIVERSITY OF IOWA)
- K233AA (94.5 FM; DAVENPORT, IA; Owner: UNIVERSITY OF NORTHERN IOWA)
- K276DE (103.1 FM; DAVENPORT, IA; Owner: POWER DU PREE BROADCASTING COMPANY)
TV broadcast stations around Moline:
- WBQD-LP (Channel 26; DAVENPORT, IA; Owner: FOUR SEASONS PEORIA, LLC)
- WHBF-TV (Channel 4; ROCK ISLAND, IL; Owner: CORONET COMMUNICATIONS COMPANY)
- K61HD (Channel 61; DAVENPORT, IA; Owner: TRINITY BROADCASTING NETWORK)
- KQIN (Channel 36; DAVENPORT, IA; Owner: IOWA PUBLIC BROADCASTING BOARD)
- KWQC-TV (Channel 6; DAVENPORT, IA; Owner: YOUNG BROADCASTING OF DAVENPORT, INC.)
- KLJB-TV (Channel 18; DAVENPORT, IA; Owner: QUAD CITIES TELEVISION ACQUISITION CORP.)
- WQAD-TV (Channel 8; MOLINE, IL; Owner: NEW YORK TIMES MANAGEMENT SERVICES)
- WQPT-TV (Channel 24; MOLINE, IL; Owner: BLACK HAWK COLLEGE)
- K16EL (Channel 66; DAVENPORT, IA; Owner: THREE ANGELS BROADCASTING NETWORK)
- KIIN (Channel 12; IOWA CITY, IA; Owner: IOWA PUBLIC BROADCASTING BOARD)
- KWKB (Channel 20; IOWA CITY, IA; Owner: KM TELEVISION OF IOWA, L.L.C.)
- National Bridge Inventory (NBI) Statistics
- 97Number of bridges
- 1,509ft / 460mTotal length
- $16,452,000Total costs
- 1,337,625Total average daily traffic
- 89,230Total average daily truck traffic
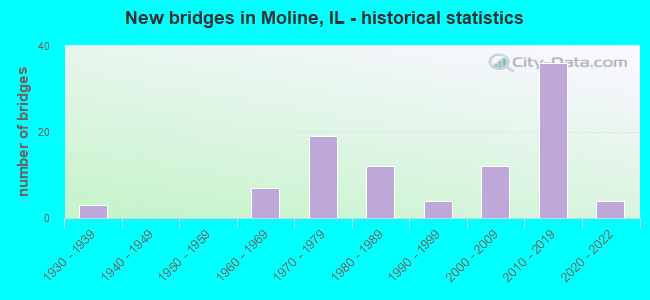
- New bridges - historical statistics
- 31930-1939
- 71960-1969
- 191970-1979
- 121980-1989
- 41990-1999
- 122000-2009
- 362010-2019
- 42020-2022
FCC Registered Antenna Towers: 181 (See the full list of FCC Registered Antenna Towers)
FCC Registered Commercial Land Mobile Towers: 2 (See the full list of FCC Registered Commercial Land Mobile Towers in Moline, IL)
FCC Registered Broadcast Land Mobile Towers: 29 (See the full list of FCC Registered Broadcast Land Mobile Towers)
FCC Registered Microwave Towers: 41 (See the full list of FCC Registered Microwave Towers in this town)
FCC Registered Paging Towers: 2 (See the full list of FCC Registered Paging Towers)
FCC Registered Maritime Coast & Aviation Ground Towers: 24 (See the full list of FCC Registered Maritime Coast & Aviation Ground Towers)
FCC Registered Amateur Radio Licenses: 174 (See the full list of FCC Registered Amateur Radio Licenses in Moline)
FAA Registered Aircraft Manufacturers and Dealers: 2 (See the full list of FAA Registered Manufacturers and Dealers in Moline)
FAA Registered Aircraft: 21 (See the full list of FAA Registered Aircraft)
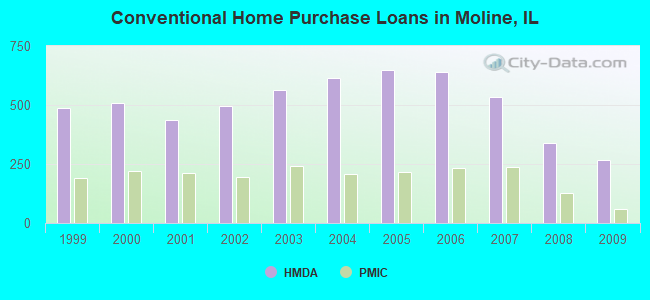
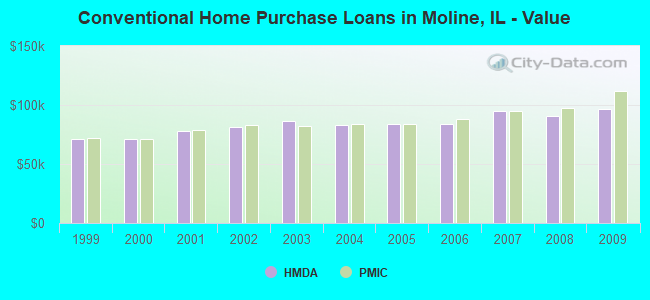
| Home Mortgage Disclosure Act Aggregated Statistics For Year 2009 (Based on 8 full and 5 partial tracts) | ||||||||||||||
| A) FHA, FSA/RHS & VA Home Purchase Loans | B) Conventional Home Purchase Loans | C) Refinancings | D) Home Improvement Loans | E) Loans on Dwellings For 5+ Families | F) Non-occupant Loans on < 5 Family Dwellings (A B C & D) | G) Loans On Manufactured Home Dwelling (A B C & D) | ||||||||
|---|---|---|---|---|---|---|---|---|---|---|---|---|---|---|
| Number | Average Value | Number | Average Value | Number | Average Value | Number | Average Value | Number | Average Value | Number | Average Value | Number | Average Value | |
| LOANS ORIGINATED | 279 | $103,825 | 266 | $96,368 | 1,003 | $100,962 | 205 | $33,533 | 5 | $364,600 | 106 | $62,394 | 1 | $36,370 |
| APPLICATIONS APPROVED, NOT ACCEPTED | 10 | $85,306 | 15 | $119,466 | 96 | $102,253 | 15 | $37,030 | 0 | $0 | 8 | $83,698 | 1 | $43,000 |
| APPLICATIONS DENIED | 38 | $98,679 | 30 | $60,822 | 187 | $107,285 | 65 | $34,074 | 1 | $1,000,000 | 17 | $165,580 | 1 | $8,900 |
| APPLICATIONS WITHDRAWN | 13 | $87,403 | 16 | $111,292 | 136 | $112,322 | 23 | $29,937 | 0 | $0 | 15 | $63,635 | 0 | $0 |
| FILES CLOSED FOR INCOMPLETENESS | 2 | $180,000 | 1 | $67,000 | 30 | $96,663 | 3 | $28,007 | 0 | $0 | 0 | $0 | 0 | $0 |
Detailed mortgage data for all 13 tracts in Moline, IL
| Private Mortgage Insurance Companies Aggregated Statistics For Year 2009 (Based on 8 full and 5 partial tracts) | ||||||
| A) Conventional Home Purchase Loans | B) Refinancings | C) Non-occupant Loans on < 5 Family Dwellings (A & B) | ||||
|---|---|---|---|---|---|---|
| Number | Average Value | Number | Average Value | Number | Average Value | |
| LOANS ORIGINATED | 58 | $112,140 | 59 | $110,090 | 0 | $0 |
| APPLICATIONS APPROVED, NOT ACCEPTED | 13 | $115,479 | 17 | $115,876 | 1 | $122,000 |
| APPLICATIONS DENIED | 4 | $106,238 | 1 | $56,560 | 0 | $0 |
| APPLICATIONS WITHDRAWN | 2 | $100,000 | 5 | $160,050 | 0 | $0 |
| FILES CLOSED FOR INCOMPLETENESS | 2 | $142,000 | 2 | $104,265 | 0 | $0 |
2003 - 2018 National Fire Incident Reporting System (NFIRS) incidents
- Fire incident types reported to NFIRS in Moline, IL
- 89242.1%Structure Fires
- 64530.4%Outside Fires
- 47622.5%Mobile Property/Vehicle Fires
- 1065.0%Other
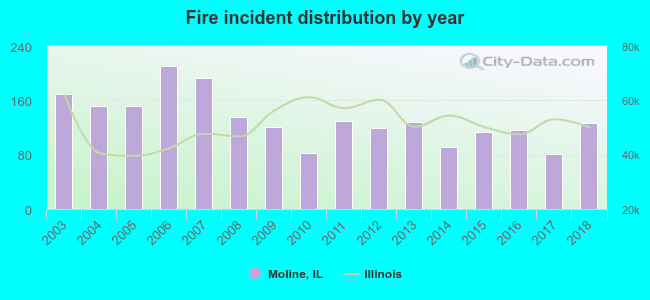 Based on the data from the years 2003 - 2018 the average number of fires per year is 132. The highest number of reported fire incidents - 210 took place in 2006, and the least - 81 in 2017. The data has a decreasing trend.
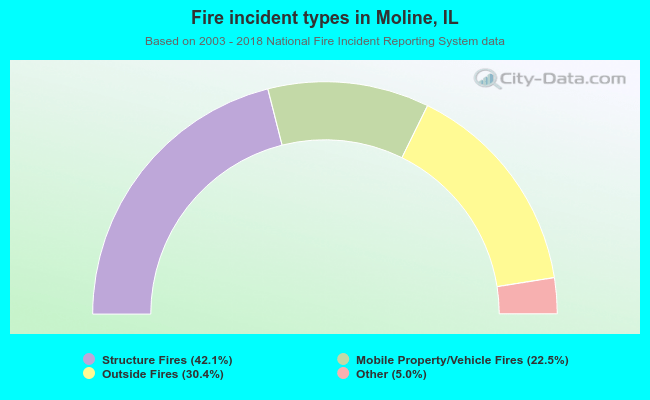 When looking into fire subcategories, the most reports belonged to: Structure Fires (42.1%), and Outside Fires (30.4%).
Fire-safe hotels and motels in Moline, Illinois:
- Fifth Season Hotel And Convention Center, 6902 27TH St, Moline, Illinois 61265 , Phone: (309) 762-8811, Fax: (309) 762-3393
- Best Western Airport Inn, 2550 52nd Ave, Moline, Illinois 61265 , Phone: (309) 762-9191, Fax: (866) 477-1523
- Super 8 Motel, 1191 19th St & 12th Ave, Moline, Illinois 61265 , Phone: (309) 764-9644, Fax: (309) 764-9644
- Fairfield Inn Moline, 2705 48TH Ave, Moline, Illinois 61265 , Phone: (309) 762-9083
- Comfort Inn Moline, 2600 52nd Ave, Moline, Illinois 61265 , Phone: (309) 762-7000, Fax: (309) 762-7000
- Motel 6 Moline, 2359 69TH Ave, Moline, Illinois 61265 , Phone: (309) 764-8711, Fax: (309) 762-4092
- Super 8 Moline, 2501 52ND Ave, Moline, Illinois 61265 , Phone: (309) 797-5580, Fax: (309) 797-1561
- La Quinta Inn, 5450 27TH St, Moline, Illinois 61265 , Phone: (309) 762-9008, Fax: (309) 762-2455
- 7 other hotels and motels
| Most common first names in Moline, IL among deceased individuals | ||
| Name | Count | Lived (average) |
|---|---|---|
| John | 362 | 76.6 years |
| Mary | 325 | 79.9 years |
| William | 300 | 75.4 years |
| Robert | 286 | 71.7 years |
| Charles | 223 | 74.9 years |
| James | 212 | 70.3 years |
| Helen | 207 | 80.6 years |
| George | 179 | 77.2 years |
| Dorothy | 177 | 77.8 years |
| Carl | 166 | 78.3 years |
| Most common last names in Moline, IL among deceased individuals | ||
| Last name | Count | Lived (average) |
|---|---|---|
| Johnson | 331 | 79.8 years |
| Anderson | 210 | 80.2 years |
| Peterson | 140 | 80.3 years |
| Nelson | 129 | 82.2 years |
| Carlson | 120 | 79.2 years |
| Swanson | 107 | 80.6 years |
| Smith | 100 | 77.1 years |
| Miller | 80 | 75.5 years |
| Olson | 65 | 77.6 years |
| Larson | 63 | 78.5 years |
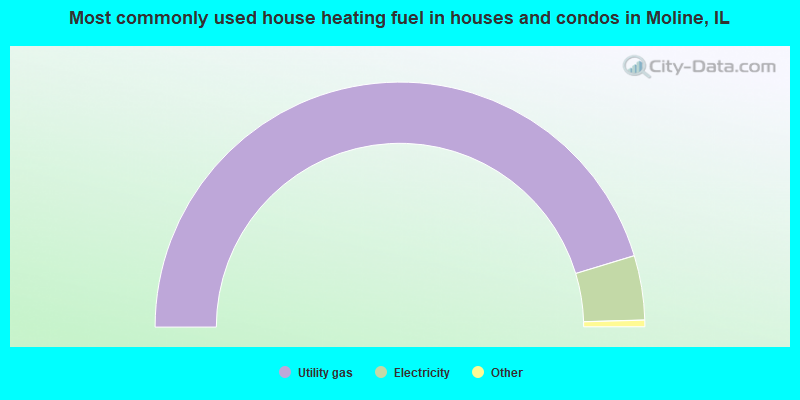
- 90.6%Utility gas
- 8.5%Electricity
- 0.5%Bottled, tank, or LP gas
- 0.3%No fuel used
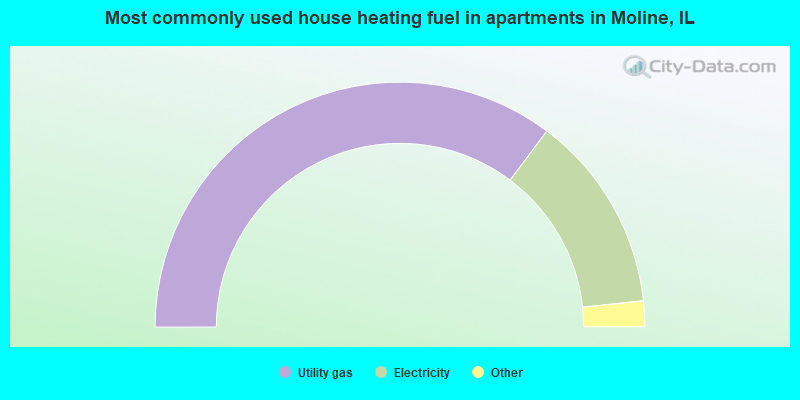
- 70.5%Utility gas
- 26.1%Electricity
- 1.6%Bottled, tank, or LP gas
- 1.4%No fuel used
- 0.3%Other fuel
Moline compared to Illinois state average:
- Median house value below state average.
- Unemployed percentage below state average.
- Foreign-born population percentage below state average.
- Length of stay since moving in significantly above state average.
Moline on our top lists:
- #44 on the list of "Top 101 cities with the most residents born in Other Western Africa (population 500+)"
- #92 on the list of "Top 101 cities with the most full-time local library workers per 1000 residents (population 5,000+)"
- #84 (61265) on the list of "Top 101 zip codes with the most alcohol drinking places in 2005"
- #52 on the list of "Top 101 counties with the largest increase in the number of births per 1000 residents 2000-2006 to 2007-2013 (pop 50,000+)"
- #79 on the list of "Top 101 counties with the largest number of people moving out compared to moving in (pop. 50,000+)"

|
|
Total of 173 patent applications in 2008-2024.