East Moline, Illinois Submit your own pictures of this city and show them to the world
OSM Map
General Map
Google Map
MSN Map
OSM Map
General Map
Google Map
MSN Map
OSM Map
General Map
Google Map
MSN Map
OSM Map
General Map
Google Map
MSN Map
Please wait while loading the map...
Population in 2022: 20,874 (100% urban, 0% rural). Population change since 2000: +2.7%Males: 10,139 Females: 10,735
March 2022 cost of living index in East Moline: 84.2 (less than average, U.S. average is 100) Percentage of residents living in poverty in 2022: 15.1%for White Non-Hispanic residents , 15.6% for Black residents , 24.6% for Hispanic or Latino residents , 25.9% for other race residents , 40.2% for two or more races residents )
Profiles of local businesses
Business Search - 14 Million verified businesses
Data:
Median household income ($)
Median household income (% change since 2000)
Household income diversity
Ratio of average income to average house value (%)
Ratio of average income to average rent
Median household income ($) - White
Median household income ($) - Black or African American
Median household income ($) - Asian
Median household income ($) - Hispanic or Latino
Median household income ($) - American Indian and Alaska Native
Median household income ($) - Multirace
Median household income ($) - Other Race
Median household income for houses/condos with a mortgage ($)
Median household income for apartments without a mortgage ($)
Races - White alone (%)
Races - White alone (% change since 2000)
Races - Black alone (%)
Races - Black alone (% change since 2000)
Races - American Indian alone (%)
Races - American Indian alone (% change since 2000)
Races - Asian alone (%)
Races - Asian alone (% change since 2000)
Races - Hispanic (%)
Races - Hispanic (% change since 2000)
Races - Native Hawaiian and Other Pacific Islander alone (%)
Races - Native Hawaiian and Other Pacific Islander alone (% change since 2000)
Races - Two or more races (%)
Races - Two or more races (% change since 2000)
Races - Other race alone (%)
Races - Other race alone (% change since 2000)
Racial diversity
Unemployment (%)
Unemployment (% change since 2000)
Unemployment (%) - White
Unemployment (%) - Black or African American
Unemployment (%) - Asian
Unemployment (%) - Hispanic or Latino
Unemployment (%) - American Indian and Alaska Native
Unemployment (%) - Multirace
Unemployment (%) - Other Race
Population density (people per square mile)
Population - Males (%)
Population - Females (%)
Population - Males (%) - White
Population - Males (%) - Black or African American
Population - Males (%) - Asian
Population - Males (%) - Hispanic or Latino
Population - Males (%) - American Indian and Alaska Native
Population - Males (%) - Multirace
Population - Males (%) - Other Race
Population - Females (%) - White
Population - Females (%) - Black or African American
Population - Females (%) - Asian
Population - Females (%) - Hispanic or Latino
Population - Females (%) - American Indian and Alaska Native
Population - Females (%) - Multirace
Population - Females (%) - Other Race
Coronavirus confirmed cases (Apr 27, 2024)
Deaths caused by coronavirus (Apr 27, 2024)
Coronavirus confirmed cases (per 100k population) (Apr 27, 2024)
Deaths caused by coronavirus (per 100k population) (Apr 27, 2024)
Daily increase in number of cases (Apr 27, 2024)
Weekly increase in number of cases (Apr 27, 2024)
Cases doubled (in days) (Apr 27, 2024)
Hospitalized patients (Apr 18, 2022)
Negative test results (Apr 18, 2022)
Total test results (Apr 18, 2022)
COVID Vaccine doses distributed (per 100k population) (Sep 19, 2023)
COVID Vaccine doses administered (per 100k population) (Sep 19, 2023)
COVID Vaccine doses distributed (Sep 19, 2023)
COVID Vaccine doses administered (Sep 19, 2023)
Likely homosexual households (%)
Likely homosexual households (% change since 2000)
Likely homosexual households - Lesbian couples (%)
Likely homosexual households - Lesbian couples (% change since 2000)
Likely homosexual households - Gay men (%)
Likely homosexual households - Gay men (% change since 2000)
Cost of living index
Median gross rent ($)
Median contract rent ($)
Median monthly housing costs ($)
Median house or condo value ($)
Median house or condo value ($ change since 2000)
Mean house or condo value by units in structure - 1, detached ($)
Mean house or condo value by units in structure - 1, attached ($)
Mean house or condo value by units in structure - 2 ($)
Mean house or condo value by units in structure by units in structure - 3 or 4 ($)
Mean house or condo value by units in structure - 5 or more ($)
Mean house or condo value by units in structure - Boat, RV, van, etc. ($)
Mean house or condo value by units in structure - Mobile home ($)
Median house or condo value ($) - White
Median house or condo value ($) - Black or African American
Median house or condo value ($) - Asian
Median house or condo value ($) - Hispanic or Latino
Median house or condo value ($) - American Indian and Alaska Native
Median house or condo value ($) - Multirace
Median house or condo value ($) - Other Race
Median resident age
Resident age diversity
Median resident age - Males
Median resident age - Females
Median resident age - White
Median resident age - Black or African American
Median resident age - Asian
Median resident age - Hispanic or Latino
Median resident age - American Indian and Alaska Native
Median resident age - Multirace
Median resident age - Other Race
Median resident age - Males - White
Median resident age - Males - Black or African American
Median resident age - Males - Asian
Median resident age - Males - Hispanic or Latino
Median resident age - Males - American Indian and Alaska Native
Median resident age - Males - Multirace
Median resident age - Males - Other Race
Median resident age - Females - White
Median resident age - Females - Black or African American
Median resident age - Females - Asian
Median resident age - Females - Hispanic or Latino
Median resident age - Females - American Indian and Alaska Native
Median resident age - Females - Multirace
Median resident age - Females - Other Race
Commute - mean travel time to work (minutes)
Travel time to work - Less than 5 minutes (%)
Travel time to work - Less than 5 minutes (% change since 2000)
Travel time to work - 5 to 9 minutes (%)
Travel time to work - 5 to 9 minutes (% change since 2000)
Travel time to work - 10 to 19 minutes (%)
Travel time to work - 10 to 19 minutes (% change since 2000)
Travel time to work - 20 to 29 minutes (%)
Travel time to work - 20 to 29 minutes (% change since 2000)
Travel time to work - 30 to 39 minutes (%)
Travel time to work - 30 to 39 minutes (% change since 2000)
Travel time to work - 40 to 59 minutes (%)
Travel time to work - 40 to 59 minutes (% change since 2000)
Travel time to work - 60 to 89 minutes (%)
Travel time to work - 60 to 89 minutes (% change since 2000)
Travel time to work - 90 or more minutes (%)
Travel time to work - 90 or more minutes (% change since 2000)
Marital status - Never married (%)
Marital status - Now married (%)
Marital status - Separated (%)
Marital status - Widowed (%)
Marital status - Divorced (%)
Median family income ($)
Median family income (% change since 2000)
Median non-family income ($)
Median non-family income (% change since 2000)
Median per capita income ($)
Median per capita income (% change since 2000)
Median family income ($) - White
Median family income ($) - Black or African American
Median family income ($) - Asian
Median family income ($) - Hispanic or Latino
Median family income ($) - American Indian and Alaska Native
Median family income ($) - Multirace
Median family income ($) - Other Race
Median year house/condo built
Median year apartment built
Year house built - Built 2005 or later (%)
Year house built - Built 2000 to 2004 (%)
Year house built - Built 1990 to 1999 (%)
Year house built - Built 1980 to 1989 (%)
Year house built - Built 1970 to 1979 (%)
Year house built - Built 1960 to 1969 (%)
Year house built - Built 1950 to 1959 (%)
Year house built - Built 1940 to 1949 (%)
Year house built - Built 1939 or earlier (%)
Average household size
Household density (households per square mile)
Average household size - White
Average household size - Black or African American
Average household size - Asian
Average household size - Hispanic or Latino
Average household size - American Indian and Alaska Native
Average household size - Multirace
Average household size - Other Race
Occupied housing units (%)
Vacant housing units (%)
Owner occupied housing units (%)
Renter occupied housing units (%)
Vacancy status - For rent (%)
Vacancy status - For sale only (%)
Vacancy status - Rented or sold, not occupied (%)
Vacancy status - For seasonal, recreational, or occasional use (%)
Vacancy status - For migrant workers (%)
Vacancy status - Other vacant (%)
Residents with income below the poverty level (%)
Residents with income below 50% of the poverty level (%)
Children below poverty level (%)
Poor families by family type - Married-couple family (%)
Poor families by family type - Male, no wife present (%)
Poor families by family type - Female, no husband present (%)
Poverty status for native-born residents (%)
Poverty status for foreign-born residents (%)
Poverty among high school graduates not in families (%)
Poverty among people who did not graduate high school not in families (%)
Residents with income below the poverty level (%) - White
Residents with income below the poverty level (%) - Black or African American
Residents with income below the poverty level (%) - Asian
Residents with income below the poverty level (%) - Hispanic or Latino
Residents with income below the poverty level (%) - American Indian and Alaska Native
Residents with income below the poverty level (%) - Multirace
Residents with income below the poverty level (%) - Other Race
Air pollution - Air Quality Index (AQI)
Air pollution - CO
Air pollution - NO2
Air pollution - SO2
Air pollution - Ozone
Air pollution - PM10
Air pollution - PM25
Air pollution - Pb
Crime - Murders per 100,000 population
Crime - Rapes per 100,000 population
Crime - Robberies per 100,000 population
Crime - Assaults per 100,000 population
Crime - Burglaries per 100,000 population
Crime - Thefts per 100,000 population
Crime - Auto thefts per 100,000 population
Crime - Arson per 100,000 population
Crime - City-data.com crime index
Crime - Violent crime index
Crime - Property crime index
Crime - Murders per 100,000 population (5 year average)
Crime - Rapes per 100,000 population (5 year average)
Crime - Robberies per 100,000 population (5 year average)
Crime - Assaults per 100,000 population (5 year average)
Crime - Burglaries per 100,000 population (5 year average)
Crime - Thefts per 100,000 population (5 year average)
Crime - Auto thefts per 100,000 population (5 year average)
Crime - Arson per 100,000 population (5 year average)
Crime - City-data.com crime index (5 year average)
Crime - Violent crime index (5 year average)
Crime - Property crime index (5 year average)
1996 Presidential Elections Results (%) - Democratic Party (Clinton)
1996 Presidential Elections Results (%) - Republican Party (Dole)
1996 Presidential Elections Results (%) - Other
2000 Presidential Elections Results (%) - Democratic Party (Gore)
2000 Presidential Elections Results (%) - Republican Party (Bush)
2000 Presidential Elections Results (%) - Other
2004 Presidential Elections Results (%) - Democratic Party (Kerry)
2004 Presidential Elections Results (%) - Republican Party (Bush)
2004 Presidential Elections Results (%) - Other
2008 Presidential Elections Results (%) - Democratic Party (Obama)
2008 Presidential Elections Results (%) - Republican Party (McCain)
2008 Presidential Elections Results (%) - Other
2012 Presidential Elections Results (%) - Democratic Party (Obama)
2012 Presidential Elections Results (%) - Republican Party (Romney)
2012 Presidential Elections Results (%) - Other
2016 Presidential Elections Results (%) - Democratic Party (Clinton)
2016 Presidential Elections Results (%) - Republican Party (Trump)
2016 Presidential Elections Results (%) - Other
2020 Presidential Elections Results (%) - Democratic Party (Biden)
2020 Presidential Elections Results (%) - Republican Party (Trump)
2020 Presidential Elections Results (%) - Other
Ancestries Reported - Arab (%)
Ancestries Reported - Czech (%)
Ancestries Reported - Danish (%)
Ancestries Reported - Dutch (%)
Ancestries Reported - English (%)
Ancestries Reported - French (%)
Ancestries Reported - French Canadian (%)
Ancestries Reported - German (%)
Ancestries Reported - Greek (%)
Ancestries Reported - Hungarian (%)
Ancestries Reported - Irish (%)
Ancestries Reported - Italian (%)
Ancestries Reported - Lithuanian (%)
Ancestries Reported - Norwegian (%)
Ancestries Reported - Polish (%)
Ancestries Reported - Portuguese (%)
Ancestries Reported - Russian (%)
Ancestries Reported - Scotch-Irish (%)
Ancestries Reported - Scottish (%)
Ancestries Reported - Slovak (%)
Ancestries Reported - Subsaharan African (%)
Ancestries Reported - Swedish (%)
Ancestries Reported - Swiss (%)
Ancestries Reported - Ukrainian (%)
Ancestries Reported - United States (%)
Ancestries Reported - Welsh (%)
Ancestries Reported - West Indian (%)
Ancestries Reported - Other (%)
Educational Attainment - No schooling completed (%)
Educational Attainment - Less than high school (%)
Educational Attainment - High school or equivalent (%)
Educational Attainment - Less than 1 year of college (%)
Educational Attainment - 1 or more years of college (%)
Educational Attainment - Associate degree (%)
Educational Attainment - Bachelor's degree (%)
Educational Attainment - Master's degree (%)
Educational Attainment - Professional school degree (%)
Educational Attainment - Doctorate degree (%)
School Enrollment - Nursery, preschool (%)
School Enrollment - Kindergarten (%)
School Enrollment - Grade 1 to 4 (%)
School Enrollment - Grade 5 to 8 (%)
School Enrollment - Grade 9 to 12 (%)
School Enrollment - College undergrad (%)
School Enrollment - Graduate or professional (%)
School Enrollment - Not enrolled in school (%)
School enrollment - Public schools (%)
School enrollment - Private schools (%)
School enrollment - Not enrolled (%)
Median number of rooms in houses and condos
Median number of rooms in apartments
Housing units lacking complete plumbing facilities (%)
Housing units lacking complete kitchen facilities (%)
Density of houses
Urban houses (%)
Rural houses (%)
Households with people 60 years and over (%)
Households with people 65 years and over (%)
Households with people 75 years and over (%)
Households with one or more nonrelatives (%)
Households with no nonrelatives (%)
Population in households (%)
Family households (%)
Nonfamily households (%)
Population in families (%)
Family households with own children (%)
Median number of bedrooms in owner occupied houses
Mean number of bedrooms in owner occupied houses
Median number of bedrooms in renter occupied houses
Mean number of bedrooms in renter occupied houses
Median number of vehichles in owner occupied houses
Mean number of vehichles in owner occupied houses
Median number of vehichles in renter occupied houses
Mean number of vehichles in renter occupied houses
Mortgage status - with mortgage (%)
Mortgage status - with second mortgage (%)
Mortgage status - with home equity loan (%)
Mortgage status - with both second mortgage and home equity loan (%)
Mortgage status - without a mortgage (%)
Average family size
Average family size - White
Average family size - Black or African American
Average family size - Asian
Average family size - Hispanic or Latino
Average family size - American Indian and Alaska Native
Average family size - Multirace
Average family size - Other Race
Geographical mobility - Same house 1 year ago (%)
Geographical mobility - Moved within same county (%)
Geographical mobility - Moved from different county within same state (%)
Geographical mobility - Moved from different state (%)
Geographical mobility - Moved from abroad (%)
Place of birth - Born in state of residence (%)
Place of birth - Born in other state (%)
Place of birth - Native, outside of US (%)
Place of birth - Foreign born (%)
Housing units in structures - 1, detached (%)
Housing units in structures - 1, attached (%)
Housing units in structures - 2 (%)
Housing units in structures - 3 or 4 (%)
Housing units in structures - 5 to 9 (%)
Housing units in structures - 10 to 19 (%)
Housing units in structures - 20 to 49 (%)
Housing units in structures - 50 or more (%)
Housing units in structures - Mobile home (%)
Housing units in structures - Boat, RV, van, etc. (%)
House/condo owner moved in on average (years ago)
Renter moved in on average (years ago)
Year householder moved into unit - Moved in 1999 to March 2000 (%)
Year householder moved into unit - Moved in 1995 to 1998 (%)
Year householder moved into unit - Moved in 1990 to 1994 (%)
Year householder moved into unit - Moved in 1980 to 1989 (%)
Year householder moved into unit - Moved in 1970 to 1979 (%)
Year householder moved into unit - Moved in 1969 or earlier (%)
Means of transportation to work - Drove car alone (%)
Means of transportation to work - Carpooled (%)
Means of transportation to work - Public transportation (%)
Means of transportation to work - Bus or trolley bus (%)
Means of transportation to work - Streetcar or trolley car (%)
Means of transportation to work - Subway or elevated (%)
Means of transportation to work - Railroad (%)
Means of transportation to work - Ferryboat (%)
Means of transportation to work - Taxicab (%)
Means of transportation to work - Motorcycle (%)
Means of transportation to work - Bicycle (%)
Means of transportation to work - Walked (%)
Means of transportation to work - Other means (%)
Working at home (%)
Industry diversity
Most Common Industries - Agriculture, forestry, fishing and hunting, and mining (%)
Most Common Industries - Agriculture, forestry, fishing and hunting (%)
Most Common Industries - Mining, quarrying, and oil and gas extraction (%)
Most Common Industries - Construction (%)
Most Common Industries - Manufacturing (%)
Most Common Industries - Wholesale trade (%)
Most Common Industries - Retail trade (%)
Most Common Industries - Transportation and warehousing, and utilities (%)
Most Common Industries - Transportation and warehousing (%)
Most Common Industries - Utilities (%)
Most Common Industries - Information (%)
Most Common Industries - Finance and insurance, and real estate and rental and leasing (%)
Most Common Industries - Finance and insurance (%)
Most Common Industries - Real estate and rental and leasing (%)
Most Common Industries - Professional, scientific, and management, and administrative and waste management services (%)
Most Common Industries - Professional, scientific, and technical services (%)
Most Common Industries - Management of companies and enterprises (%)
Most Common Industries - Administrative and support and waste management services (%)
Most Common Industries - Educational services, and health care and social assistance (%)
Most Common Industries - Educational services (%)
Most Common Industries - Health care and social assistance (%)
Most Common Industries - Arts, entertainment, and recreation, and accommodation and food services (%)
Most Common Industries - Arts, entertainment, and recreation (%)
Most Common Industries - Accommodation and food services (%)
Most Common Industries - Other services, except public administration (%)
Most Common Industries - Public administration (%)
Occupation diversity
Most Common Occupations - Management, business, science, and arts occupations (%)
Most Common Occupations - Management, business, and financial occupations (%)
Most Common Occupations - Management occupations (%)
Most Common Occupations - Business and financial operations occupations (%)
Most Common Occupations - Computer, engineering, and science occupations (%)
Most Common Occupations - Computer and mathematical occupations (%)
Most Common Occupations - Architecture and engineering occupations (%)
Most Common Occupations - Life, physical, and social science occupations (%)
Most Common Occupations - Education, legal, community service, arts, and media occupations (%)
Most Common Occupations - Community and social service occupations (%)
Most Common Occupations - Legal occupations (%)
Most Common Occupations - Education, training, and library occupations (%)
Most Common Occupations - Arts, design, entertainment, sports, and media occupations (%)
Most Common Occupations - Healthcare practitioners and technical occupations (%)
Most Common Occupations - Health diagnosing and treating practitioners and other technical occupations (%)
Most Common Occupations - Health technologists and technicians (%)
Most Common Occupations - Service occupations (%)
Most Common Occupations - Healthcare support occupations (%)
Most Common Occupations - Protective service occupations (%)
Most Common Occupations - Fire fighting and prevention, and other protective service workers including supervisors (%)
Most Common Occupations - Law enforcement workers including supervisors (%)
Most Common Occupations - Food preparation and serving related occupations (%)
Most Common Occupations - Building and grounds cleaning and maintenance occupations (%)
Most Common Occupations - Personal care and service occupations (%)
Most Common Occupations - Sales and office occupations (%)
Most Common Occupations - Sales and related occupations (%)
Most Common Occupations - Office and administrative support occupations (%)
Most Common Occupations - Natural resources, construction, and maintenance occupations (%)
Most Common Occupations - Farming, fishing, and forestry occupations (%)
Most Common Occupations - Construction and extraction occupations (%)
Most Common Occupations - Installation, maintenance, and repair occupations (%)
Most Common Occupations - Production, transportation, and material moving occupations (%)
Most Common Occupations - Production occupations (%)
Most Common Occupations - Transportation occupations (%)
Most Common Occupations - Material moving occupations (%)
People in Group quarters - Institutionalized population (%)
People in Group quarters - Correctional institutions (%)
People in Group quarters - Federal prisons and detention centers (%)
People in Group quarters - Halfway houses (%)
People in Group quarters - Local jails and other confinement facilities (including police lockups) (%)
People in Group quarters - Military disciplinary barracks (%)
People in Group quarters - State prisons (%)
People in Group quarters - Other types of correctional institutions (%)
People in Group quarters - Nursing homes (%)
People in Group quarters - Hospitals/wards, hospices, and schools for the handicapped (%)
People in Group quarters - Hospitals/wards and hospices for chronically ill (%)
People in Group quarters - Hospices or homes for chronically ill (%)
People in Group quarters - Military hospitals or wards for chronically ill (%)
People in Group quarters - Other hospitals or wards for chronically ill (%)
People in Group quarters - Hospitals or wards for drug/alcohol abuse (%)
People in Group quarters - Mental (Psychiatric) hospitals or wards (%)
People in Group quarters - Schools, hospitals, or wards for the mentally retarded (%)
People in Group quarters - Schools, hospitals, or wards for the physically handicapped (%)
People in Group quarters - Institutions for the deaf (%)
People in Group quarters - Institutions for the blind (%)
People in Group quarters - Orthopedic wards and institutions for the physically handicapped (%)
People in Group quarters - Wards in general hospitals for patients who have no usual home elsewhere (%)
People in Group quarters - Wards in military hospitals for patients who have no usual home elsewhere (%)
People in Group quarters - Juvenile institutions (%)
People in Group quarters - Long-term care (%)
People in Group quarters - Homes for abused, dependent, and neglected children (%)
People in Group quarters - Residential treatment centers for emotionally disturbed children (%)
People in Group quarters - Training schools for juvenile delinquents (%)
People in Group quarters - Short-term care, detention or diagnostic centers for delinquent children (%)
People in Group quarters - Type of juvenile institution unknown (%)
People in Group quarters - Noninstitutionalized population (%)
People in Group quarters - College dormitories (includes college quarters off campus) (%)
People in Group quarters - Military quarters (%)
People in Group quarters - On base (%)
People in Group quarters - Barracks, unaccompanied personnel housing (UPH), (Enlisted/Officer), ;and similar group living quarters for military personnel (%)
People in Group quarters - Transient quarters for temporary residents (%)
People in Group quarters - Military ships (%)
People in Group quarters - Group homes (%)
People in Group quarters - Homes or halfway houses for drug/alcohol abuse (%)
People in Group quarters - Homes for the mentally ill (%)
People in Group quarters - Homes for the mentally retarded (%)
People in Group quarters - Homes for the physically handicapped (%)
People in Group quarters - Other group homes (%)
People in Group quarters - Religious group quarters (%)
People in Group quarters - Dormitories (%)
People in Group quarters - Agriculture workers' dormitories on farms (%)
People in Group quarters - Job Corps and vocational training facilities (%)
People in Group quarters - Other workers' dormitories (%)
People in Group quarters - Crews of maritime vessels (%)
People in Group quarters - Other nonhousehold living situations (%)
People in Group quarters - Other noninstitutional group quarters (%)
Residents speaking English at home (%)
Residents speaking English at home - Born in the United States (%)
Residents speaking English at home - Native, born elsewhere (%)
Residents speaking English at home - Foreign born (%)
Residents speaking Spanish at home (%)
Residents speaking Spanish at home - Born in the United States (%)
Residents speaking Spanish at home - Native, born elsewhere (%)
Residents speaking Spanish at home - Foreign born (%)
Residents speaking other language at home (%)
Residents speaking other language at home - Born in the United States (%)
Residents speaking other language at home - Native, born elsewhere (%)
Residents speaking other language at home - Foreign born (%)
Class of Workers - Employee of private company (%)
Class of Workers - Self-employed in own incorporated business (%)
Class of Workers - Private not-for-profit wage and salary workers (%)
Class of Workers - Local government workers (%)
Class of Workers - State government workers (%)
Class of Workers - Federal government workers (%)
Class of Workers - Self-employed workers in own not incorporated business and Unpaid family workers (%)
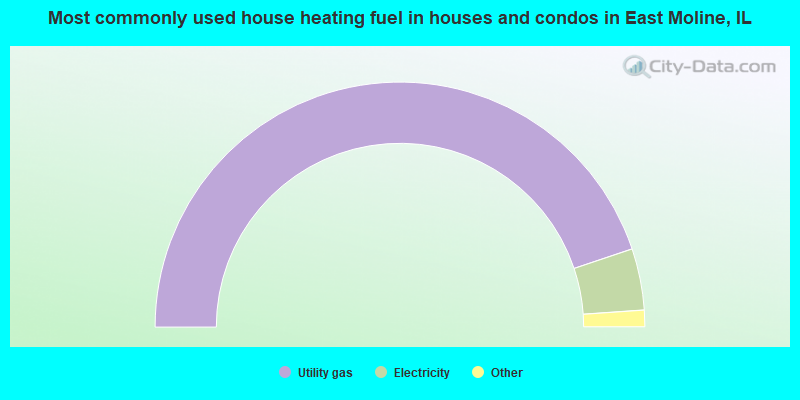
House heating fuel used in houses and condos - Utility gas (%)
House heating fuel used in houses and condos - Bottled, tank, or LP gas (%)
House heating fuel used in houses and condos - Electricity (%)
House heating fuel used in houses and condos - Fuel oil, kerosene, etc. (%)
House heating fuel used in houses and condos - Coal or coke (%)
House heating fuel used in houses and condos - Wood (%)
House heating fuel used in houses and condos - Solar energy (%)
House heating fuel used in houses and condos - Other fuel (%)
House heating fuel used in houses and condos - No fuel used (%)
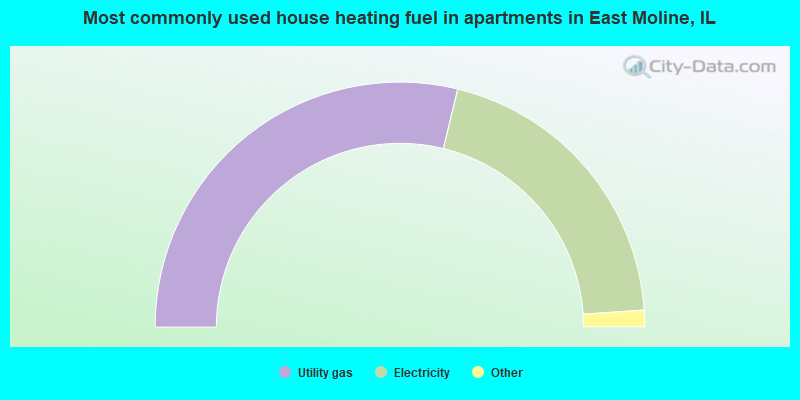
House heating fuel used in apartments - Utility gas (%)
House heating fuel used in apartments - Bottled, tank, or LP gas (%)
House heating fuel used in apartments - Electricity (%)
House heating fuel used in apartments - Fuel oil, kerosene, etc. (%)
House heating fuel used in apartments - Coal or coke (%)
House heating fuel used in apartments - Wood (%)
House heating fuel used in apartments - Solar energy (%)
House heating fuel used in apartments - Other fuel (%)
House heating fuel used in apartments - No fuel used (%)
Armed forces status - In Armed Forces (%)
Armed forces status - Civilian (%)
Armed forces status - Civilian - Veteran (%)
Armed forces status - Civilian - Nonveteran (%)
Fatal accidents locations in years 2005-2021
Fatal accidents locations in 2005
Fatal accidents locations in 2006
Fatal accidents locations in 2007
Fatal accidents locations in 2008
Fatal accidents locations in 2009
Fatal accidents locations in 2010
Fatal accidents locations in 2011
Fatal accidents locations in 2012
Fatal accidents locations in 2013
Fatal accidents locations in 2014
Fatal accidents locations in 2015
Fatal accidents locations in 2016
Fatal accidents locations in 2017
Fatal accidents locations in 2018
Fatal accidents locations in 2019
Fatal accidents locations in 2020
Fatal accidents locations in 2021
Alcohol use - People drinking some alcohol every month (%)
Alcohol use - People not drinking at all (%)
Alcohol use - Average days/month drinking alcohol
Alcohol use - Average drinks/week
Alcohol use - Average days/year people drink much
Audiometry - Average condition of hearing (%)
Audiometry - People that can hear a whisper from across a quiet room (%)
Audiometry - People that can hear normal voice from across a quiet room (%)
Audiometry - Ears ringing, roaring, buzzing (%)
Audiometry - Had a job exposure to loud noise (%)
Audiometry - Had off-work exposure to loud noise (%)
Blood Pressure & Cholesterol - Has high blood pressure (%)
Blood Pressure & Cholesterol - Checking blood pressure at home (%)
Blood Pressure & Cholesterol - Frequently checking blood cholesterol (%)
Blood Pressure & Cholesterol - Has high cholesterol level (%)
Consumer Behavior - Money monthly spent on food at supermarket/grocery store
Consumer Behavior - Money monthly spent on food at other stores
Consumer Behavior - Money monthly spent on eating out
Consumer Behavior - Money monthly spent on carryout/delivered foods
Consumer Behavior - Income spent on food at supermarket/grocery store (%)
Consumer Behavior - Income spent on food at other stores (%)
Consumer Behavior - Income spent on eating out (%)
Consumer Behavior - Income spent on carryout/delivered foods (%)
Current Health Status - General health condition (%)
Current Health Status - Blood donors (%)
Current Health Status - Has blood ever tested for HIV virus (%)
Current Health Status - Left-handed people (%)
Dermatology - People using sunscreen (%)
Diabetes - Diabetics (%)
Diabetes - Had a blood test for high blood sugar (%)
Diabetes - People taking insulin (%)
Diet Behavior & Nutrition - Diet health (%)
Diet Behavior & Nutrition - Milk product consumption (# of products/month)
Diet Behavior & Nutrition - Meals not home prepared (#/week)
Diet Behavior & Nutrition - Meals from fast food or pizza place (#/week)
Diet Behavior & Nutrition - Ready-to-eat foods (#/month)
Diet Behavior & Nutrition - Frozen meals/pizza (#/month)
Drug Use - People that ever used marijuana or hashish (%)
Drug Use - Ever used hard drugs (%)
Drug Use - Ever used any form of cocaine (%)
Drug Use - Ever used heroin (%)
Drug Use - Ever used methamphetamine (%)
Health Insurance - People covered by health insurance (%)
Kidney Conditions-Urology - Avg. # of times urinating at night
Medical Conditions - People with asthma (%)
Medical Conditions - People with anemia (%)
Medical Conditions - People with psoriasis (%)
Medical Conditions - People with overweight (%)
Medical Conditions - Elderly people having difficulties in thinking or remembering (%)
Medical Conditions - People who ever received blood transfusion (%)
Medical Conditions - People having trouble seeing even with glass/contacts (%)
Medical Conditions - People with arthritis (%)
Medical Conditions - People with gout (%)
Medical Conditions - People with congestive heart failure (%)
Medical Conditions - People with coronary heart disease (%)
Medical Conditions - People with angina pectoris (%)
Medical Conditions - People who ever had heart attack (%)
Medical Conditions - People who ever had stroke (%)
Medical Conditions - People with emphysema (%)
Medical Conditions - People with thyroid problem (%)
Medical Conditions - People with chronic bronchitis (%)
Medical Conditions - People with any liver condition (%)
Medical Conditions - People who ever had cancer or malignancy (%)
Mental Health - People who have little interest in doing things (%)
Mental Health - People feeling down, depressed, or hopeless (%)
Mental Health - People who have trouble sleeping or sleeping too much (%)
Mental Health - People feeling tired or having little energy (%)
Mental Health - People with poor appetite or overeating (%)
Mental Health - People feeling bad about themself (%)
Mental Health - People who have trouble concentrating on things (%)
Mental Health - People moving or speaking slowly or too fast (%)
Mental Health - People having thoughts they would be better off dead (%)
Oral Health - Average years since last visit a dentist
Oral Health - People embarrassed because of mouth (%)
Oral Health - People with gum disease (%)
Oral Health - General health of teeth and gums (%)
Oral Health - Average days a week using dental floss/device
Oral Health - Average days a week using mouthwash for dental problem
Oral Health - Average number of teeth
Pesticide Use - Households using pesticides to control insects (%)
Pesticide Use - Households using pesticides to kill weeds (%)
Physical Activity - People doing vigorous-intensity work activities (%)
Physical Activity - People doing moderate-intensity work activities (%)
Physical Activity - People walking or bicycling (%)
Physical Activity - People doing vigorous-intensity recreational activities (%)
Physical Activity - People doing moderate-intensity recreational activities (%)
Physical Activity - Average hours a day doing sedentary activities
Physical Activity - Average hours a day watching TV or videos
Physical Activity - Average hours a day using computer
Physical Functioning - People having limitations keeping them from working (%)
Physical Functioning - People limited in amount of work they can do (%)
Physical Functioning - People that need special equipment to walk (%)
Physical Functioning - People experiencing confusion/memory problems (%)
Physical Functioning - People requiring special healthcare equipment (%)
Prescription Medications - Average number of prescription medicines taking
Preventive Aspirin Use - Adults 40+ taking low-dose aspirin (%)
Reproductive Health - Vaginal deliveries (%)
Reproductive Health - Cesarean deliveries (%)
Reproductive Health - Deliveries resulted in a live birth (%)
Reproductive Health - Pregnancies resulted in a delivery (%)
Reproductive Health - Women breastfeeding newborns (%)
Reproductive Health - Women that had a hysterectomy (%)
Reproductive Health - Women that had both ovaries removed (%)
Reproductive Health - Women that have ever taken birth control pills (%)
Reproductive Health - Women taking birth control pills (%)
Reproductive Health - Women that have ever used Depo-Provera or injectables (%)
Reproductive Health - Women that have ever used female hormones (%)
Sexual Behavior - People 18+ that ever had sex (vaginal, anal, or oral) (%)
Sexual Behavior - Males 18+ that ever had vaginal sex with a woman (%)
Sexual Behavior - Males 18+ that ever performed oral sex on a woman (%)
Sexual Behavior - Males 18+ that ever had anal sex with a woman (%)
Sexual Behavior - Males 18+ that ever had any sex with a man (%)
Sexual Behavior - Females 18+ that ever had vaginal sex with a man (%)
Sexual Behavior - Females 18+ that ever performed oral sex on a man (%)
Sexual Behavior - Females 18+ that ever had anal sex with a man (%)
Sexual Behavior - Females 18+ that ever had any kind of sex with a woman (%)
Sexual Behavior - Average age people first had sex
Sexual Behavior - Average number of female sex partners in lifetime (males 18+)
Sexual Behavior - Average number of female vaginal sex partners in lifetime (males 18+)
Sexual Behavior - Average age people first performed oral sex on a woman (18+)
Sexual Behavior - Average number of woman performed oral sex on in lifetime (18+)
Sexual Behavior - Average number of male sex partners in lifetime (males 18+)
Sexual Behavior - Average number of male anal sex partners in lifetime (males 18+)
Sexual Behavior - Average age people first performed oral sex on a man (18+)
Sexual Behavior - Average number of male oral sex partners in lifetime (18+)
Sexual Behavior - People using protection when performing oral sex (%)
Sexual Behavior - Average number of times people have vaginal or anal sex a year
Sexual Behavior - People having sex without condom (%)
Sexual Behavior - Average number of male sex partners in lifetime (females 18+)
Sexual Behavior - Average number of male vaginal sex partners in lifetime (females 18+)
Sexual Behavior - Average number of female sex partners in lifetime (females 18+)
Sexual Behavior - Circumcised males 18+ (%)
Sleep Disorders - Average hours sleeping at night
Sleep Disorders - People that has trouble sleeping (%)
Smoking-Cigarette Use - People smoking cigarettes (%)
Taste & Smell - People 40+ having problems with smell (%)
Taste & Smell - People 40+ having problems with taste (%)
Taste & Smell - People 40+ that ever had wisdom teeth removed (%)
Taste & Smell - People 40+ that ever had tonsils teeth removed (%)
Taste & Smell - People 40+ that ever had a loss of consciousness because of a head injury (%)
Taste & Smell - People 40+ that ever had a broken nose or other serious injury to face or skull (%)
Taste & Smell - People 40+ that ever had two or more sinus infections (%)
Weight - Average height (inches)
Weight - Average weight (pounds)
Weight - Average BMI
Weight - People that are obese (%)
Weight - People that ever were obese (%)
Weight - People trying to lose weight (%)
Officers per 1,000 residents here:
1.70Illinois average:
3.04
Latest news from East Moline, IL collected exclusively by city-data.com from local newspapers, TV, and radio stations
Ancestries: African (8.3%), German (6.9%), American (5.9%), English (4.5%), Irish (2.8%), Swedish (2.2%).
Current Local Time:
Incorporated on 02/20/1903
Land area: 9.02 square miles.
Population density: 2,315 people per square mile (low).
3,002 residents are foreign born (5.8% Africa , 4.1% Latin America , 3.1% Asia ).
This city:
14.6%Illinois:
14.1%
Median real estate property taxes paid for housing units with mortgages in 2022: $3,203 (2.6%)Median real estate property taxes paid for housing units with no mortgage in 2022: $3,086 (2.2%)
Nearest city with pop. 50,000+: Davenport, IA
Nearest city with pop. 200,000+: Madison, WI
Nearest city with pop. 1,000,000+: Chicago, IL
Nearest cities:
Panorama Park, IA (1.8 miles),
Latitude: 41.51 N, Longitude: 90.44 W
Daytime population change due to commuting: -529 (-2.6%)Workers who live and work in this city: 2,071 (22.6%)
Single-family new house construction building permits:
2022: 3 buildings , average cost: $176,2002021: 3 buildings , average cost: $176,2002020: 3 buildings , average cost: $176,2002019: 3 buildings , average cost: $176,2002018: 3 buildings , average cost: $176,2002017: 2 buildings , average cost: $173,5002016: 2 buildings , average cost: $173,5002013: 6 buildings , average cost: $178,0002012: 5 buildings , average cost: $178,0002011: 4 buildings , average cost: $178,0002010: 3 buildings , average cost: $191,8002009: 4 buildings , average cost: $181,8002008: 3 buildings , average cost: $134,5002007: 8 buildings , average cost: $155,1002006: 13 buildings , average cost: $152,8002005: 17 buildings , average cost: $128,1002004: 10 buildings , average cost: $134,4002003: 13 buildings , average cost: $158,7002002: 14 buildings , average cost: $140,6002001: 20 buildings , average cost: $169,3002000: 11 buildings , average cost: $161,4001999: 12 buildings , average cost: $148,0001998: 13 buildings , average cost: $141,2001997: 10 buildings , average cost: $144,800Unemployment in December 2023:
Population change in the 1990s: +74 (+0.4%).
Most common occupations in East Moline, IL (%)
Both Males Females
Building and grounds cleaning and maintenance occupations (5.2%)
Other production occupations, including supervisors (4.5%)
Other sales and related occupations, including supervisors (4.5%)
Other office and administrative support workers, including supervisors (3.7%)
Laborers and material movers, hand (3.7%)
Material recording, scheduling, dispatching, and distributing workers (3.3%)
Other management occupations, except farmers and farm managers (3.3%)
Other production occupations, including supervisors (6.1%)
Laborers and material movers, hand (5.8%)
Metal workers and plastic workers (5.1%)
Building and grounds cleaning and maintenance occupations (4.9%)
Driver/sales workers and truck drivers (4.6%)
Computer specialists (4.2%)
Electrical equipment mechanics and other installation, maintenance, and repair workers, including supervisors (4.1%)
Other office and administrative support workers, including supervisors (6.7%)
Secretaries and administrative assistants (5.9%)
Building and grounds cleaning and maintenance occupations (5.5%)
Other sales and related occupations, including supervisors (5.4%)
Preschool, kindergarten, elementary, and middle school teachers (4.9%)
Registered nurses (4.0%)
Other management occupations, except farmers and farm managers (3.4%)
Tornado activity:
East Moline-area historical tornado activity is near Illinois state average. It is 74% greater than the overall U.S. average.
On 3/29/1981, a category F4 (max. wind speeds 207-260 mph) tornado 27.7 miles away from the East Moline city center caused between $500,000 and $5,000,000 in damages.
On 4/19/1966, a category F3 (max. wind speeds 158-206 mph) tornado 3.5 miles away from the city center caused between $50,000 and $500,000 in damages.
Earthquake activity:
East Moline-area historical earthquake activity is significantly above Illinois state average. It is 122% greater than the overall U.S. average. On 4/18/2008 at 09:36:59, a magnitude 5.4 (5.1 MB, 4.8 MS, 5.4 MW, 5.2 MW, Class: Moderate, Intensity: VI - VII) earthquake occurred 251.1 miles away from the city center On 6/10/1987 at 23:48:54, a magnitude 5.1 (4.9 MB, 4.4 MS, 4.6 MS, 5.1 LG) earthquake occurred 229.8 miles away from East Moline center On 4/18/2008 at 09:36:59, a magnitude 5.2 (5.2 MW, Depth: 8.9 mi) earthquake occurred 251.1 miles away from East Moline center On 6/28/2004 at 06:10:52, a magnitude 4.2 (4.2 MW, Depth: 6.2 mi, Class: Light, Intensity: IV - V) earthquake occurred 79.6 miles away from the city center On 6/18/2002 at 17:37:15, a magnitude 5.0 (4.3 MB, 4.6 MW, 5.0 LG) earthquake occurred 281.7 miles away from the city center On 4/18/2008 at 15:14:16, a magnitude 4.8 (4.5 MB, 4.8 MW, 4.6 MW) earthquake occurred 250.8 miles away from the city center Magnitude types: regional Lg-wave magnitude (LG), body-wave magnitude (MB), surface-wave magnitude (MS), moment magnitude (MW) Natural disasters: The number of natural disasters in Rock Island County (14) is near the US average (15).Major Disasters (Presidential) Declared: 11Emergencies Declared: 1Floods: 11, Storms: 9, Hurricane: 1, Snowstorm: 1, Tornado: 1, Wind: 1, Winter Storm: 1, Other: 1 (Note: some incidents may be assigned to more than one category). Hospitals and medical centers in East Moline: EAST MOLINE CARE CTR (4700 10TH ST)
EAST MOLINE NURSING AND REHAB (430 SOUTH 30TH AVENUE)
FOREST HILL HEALTH AND REHAB (4747 11TH STREET)
HOPE CREEK CARE CENTER (4343 KENNEDY DRIVE)
OLD - PARKVIEW TERRACE (430 SOUTH 30TH AVENUE)
Amtrak stations near East Moline: 6 miles: MOLINE (QUAD CITY AIRPORT, 2200 69TH ST.) - Bus Station Services: enclosed waiting area, public restrooms, public payphones, call for taxi service.
8 miles: DAVENPORT (BURLINGTON DEPOT, 304 WEST RIVER DR.) - Bus Station Services: enclosed waiting area, public restrooms, public payphones, taxi stand.
Operable nuclear power plants near East Moline:
13 miles: Quad Cities 1 and 2 in Cordova, IL.
College/University in East Moline: La James International College-East Moline Full-time enrollment: 37; Location: 485 42nd Ave; Private, for-profit; Website: www.lajamesinternational.com)
Colleges/universities with over 2000 students nearest to East Moline:
Black Hawk College (about 3 miles; Moline, IL ; Full-time enrollment: 5,086)
Augustana College (about 7 miles; Rock Island, IL ; FT enrollment: 2,555)
Kaplan University-Davenport Campus (about 7 miles; Davenport, IA ; FT enrollment: 60,376)
Eastern Iowa Community College District (about 8 miles; Davenport, IA ; FT enrollment: 5,507)
Saint Ambrose University (about 8 miles; Davenport, IA ; FT enrollment: 3,053)
Ashford University (about 27 miles; Clinton, IA ; FT enrollment: 73,330)
University of Iowa (about 58 miles; Iowa City, IA ; FT enrollment: 24,735)
Public high school in East Moline:
Private high school in East Moline:
Public elementary/middle schools in East Moline: GLENVIEW MIDDLE SCHOOL Students: 1,045, Location: 3100 7TH ST, Grades: 5-8)RIDGEWOOD ELEM SCHOOL Students: 391, Location: 814 30TH AVE, Grades: KG-4)HILLCREST ELEM SCHOOL Students: 330, Location: 451 22ND AVE, Grades: KG-4)WELLS ELEM SCHOOL Location: 490 AVENUE OF THE CITIES, Grades: PK-4)
NORTHEAST JR HIGH SCHOOL Location: 4280 4TH AVE, Grades: 6-8)
Private elementary/middle school in East Moline: OUR LADY OF GRACE Students: 153, Location: 603 18TH AVE, Grades: PK-8)
See full list of schools located in East Moline Library in East Moline: EAST MOLINE PUBLIC LIBRARY Operating income: $737,166; Location: 740 SIXTEENTH AVENUE; 57,816 books ; 5,749 e-books ; 7,142 audio materials ; 3,661 video materials ; 15 state licensed databases ; 122 print serial subscriptions )
User-submitted facts and corrections:
ST ANNE SCHOOL IS NOW CALLED 'OUR LADY OF GRACE ACADAMY' ST MARYS EM,IL MERGED WITH ST ANNE AND NOW HAS NAME ABOVE. STARTING 2005-2006 SCHOOL YEAR.
93.5 fm call letters are KQCS "Star 93.5"
ILLINI HOSPITAL IS NOW CALLED GENESIS/ILLINI CAMPUS.
Notable locations in East Moline: (A) , East Moline Speedway (B) , Short Hills Country Club (C) , Upper Rock Island County Landfill (D) , East Moline Correctional Center (E) , East Moline Fire Department Station 23 (F) , East Moline Fire Department Station 21 (G) , East Moline Fire Department Station 22 (H) . Display/hide their locations on the map
Shopping Centers: (1) , Hilltop Plaza Shopping Center (2) , Ridgeview Shopping Center (3) . Display/hide their locations on the map
Churches in East Moline include: (A) , First Assembly of God Church (B) , Prayer Faith Mission Church (C) , Saint Marys Convent (D) , Saint Marys Catholic Church (E) , East Moline Church of God (F) , First Presbyterian Church (G) , Primera Iglesia Bautista Hispana Church (H) , Grace Bible Missionary Church (I) . Display/hide their locations on the map
Cemeteries: (1) , State Cemetery (2) . Display/hide their locations on the map
Creek: (A) . Display/hide its location on the map
Parks in East Moline include: (1) , Wiman Park (2) , Mitchell Park (3) , Butterworth Park (4) , Hereford Park (5) , Quad City Downs Racetrack (6) , Northeast Park (7) . Display/hide their locations on the map
Tourist attraction:
Birthplace of: Eric Wisely - Mixed martial artist.
Rock Island County has a predicted average indoor radon screening level greater than 4 pCi/L (pico curies per liter) - Highest Potential Drinking water stations with addresses in East Moline and their reported violations in the past:
EAST MOLINE (Population served: 20,500, Surface water):
Past health violations:
Treatment Technique (SWTR and GWR) - In JUL-2006. Follow-up actions: St Formal NOV issued (JUN-05-2006), St BCA signed (JUL-11-2006), St Compliance achieved (JUL-19-2006), St Public Notif requested (SEP-11-2006), St Violation/Reminder Notice (SEP-11-2006), St Public Notif received (OCT-03-2006)
Treatment Technique (SWTR and GWR) - In JUN-2006. Follow-up actions: St Formal NOV issued (JUN-05-2006), St BCA signed (JUL-11-2006), St Compliance achieved (JUL-19-2006), St Public Notif requested (SEP-11-2006), St Violation/Reminder Notice (SEP-11-2006), St Public Notif received (OCT-03-2006)
Treatment Technique (SWTR and GWR) - In MAY-2006. Follow-up actions: St Formal NOV issued (JUN-05-2006), St BCA signed (JUL-11-2006), St Compliance achieved (JUL-19-2006), St Public Notif requested (SEP-11-2006), St Violation/Reminder Notice (SEP-11-2006), St Public Notif received (OCT-03-2006)
Treatment Technique (SWTR and GWR) - In APR-2006. Follow-up actions: St Public Notif requested (JUN-02-2006), St Violation/Reminder Notice (JUN-02-2006), St Formal NOV issued (JUN-05-2006), St Public Notif received (JUL-05-2006), St BCA signed (JUL-11-2006), St Compliance achieved (JUL-19-2006)
Treatment Technique (SWTR and GWR) - In MAR-2006. Follow-up actions: St Public Notif requested (JUN-02-2006), St Violation/Reminder Notice (JUN-02-2006), St Formal NOV issued (JUN-05-2006), St Public Notif received (JUL-05-2006), St BCA signed (JUL-11-2006), St Compliance achieved (JUL-19-2006)
Treatment Technique (SWTR and GWR) - In FEB-2006. Follow-up actions: St Public Notif requested (JUN-02-2006), St Violation/Reminder Notice (JUN-02-2006), St Formal NOV issued (JUN-05-2006), St Public Notif received (JUL-05-2006), St BCA signed (JUL-11-2006), St Compliance achieved (JUL-19-2006)
Treatment Technique (SWTR and GWR) - In JAN-2006. Follow-up actions: St Public Notif requested (JUN-02-2006), St Violation/Reminder Notice (JUN-02-2006), St Formal NOV issued (JUN-05-2006), St Public Notif received (JUL-05-2006), St BCA signed (JUL-11-2006), St Compliance achieved (JUL-19-2006)
Population served: 206, Groundwater):
Past monitoring violations:
Water Quality Parameter M/R - Between JAN-2008 and JUN-2008, Contaminant: Lead and Copper Rule. Follow-up actions: St Compliance achieved (JUL-16-2008), St Violation/Reminder Notice (JUL-16-2008)
Population served: 75, Groundwater):
Past health violations:
MCL, Monthly (TCR) - Between JAN-2007 and DEC-2007, Contaminant: Coliform. Follow-up actions: St Public Notif received (AUG-24-2007), St Public Notif requested (AUG-24-2007), St Formal NOV issued (AUG-27-2007), St Compliance achieved (MAR-12-2008)
Population served: 50, Groundwater):
Past health violations:
MCL, Monthly (TCR) - In JUL-2011, Contaminant: Coliform. Follow-up actions: St Public Notif requested (JUL-12-2011), St Boil Water Order (JUL-12-2011), St Public Notif received (JUL-12-2011), St Compliance achieved (JUL-29-2011)
MCL, Monthly (TCR) - Between JUL-2009 and SEP-2009, Contaminant: Coliform. Follow-up actions: St Public Notif received (SEP-11-2009), St Public Notif requested (SEP-11-2009), St Formal NOV issued (SEP-23-2009), St Compliance achieved (OCT-21-2009)
MCL, Monthly (TCR) - Between JUL-2007 and SEP-2007, Contaminant: Coliform. Follow-up actions: St Public Notif received (AUG-17-2007), St Public Notif requested (AUG-17-2007), St Compliance achieved (OCT-11-2007)
MCL, Monthly (TCR) - Between APR-2005 and JUN-2005, Contaminant: Coliform. Follow-up actions: St Formal NOV issued (JUL-14-2005), St BCA signed (AUG-25-2005), St Formal NOV issued (AUG-29-2005), St Compliance achieved (DEC-21-2005)
Drinking water stations with addresses in East Moline that have no violations reported:
WILDWOOD BAPTIST CHURCH (Population served: 440, Primary Water Source Type: Groundwater)
GOLFMOHR GOLF COURSE (Population served: 200, Primary Water Source Type: Groundwater)
EVERGREEN VILLAGE SUBDIVISION (Population served: 130, Primary Water Source Type: Groundwater)
ZION LUTHERAN CHURCH (49155) (Population served: 96, Primary Water Source Type: Groundwater)
RI COUNTY COUNCIL ON ADDICTION (Population served: 30, Primary Water Source Type: Groundwater)
Average household size: This city:
2.3 peopleIllinois:
2.6 people
Percentage of family households: This city:
60.9%Whole state:
65.8%
Percentage of households with unmarried partners: This city:
7.2%Whole state:
6.3%
Likely homosexual households (counted as self-reported same-sex unmarried-partner households)
Lesbian couples: 0.2% of all households Gay men: 0.2% of all households
People in group quarters in East Moline in 2010:
1,121 people in state prisons
382 people in nursing facilities/skilled-nursing facilities
3 people in group homes intended for adults
People in group quarters in East Moline in 2000:
290 people in nursing homes
11 people in other noninstitutional group quarters
4 people in religious group quarters
Banks with branches in East Moline (2011 data):
THE National Bank: 1451 20th Avenue Branch, East Moline Branch, 1523 Eighth Street Branch. Info updated 2009/01/28: Bank assets: $1,088.2 mil, Deposits: $914.5 mil, headquarters in Moline, IL, positive income , Commercial Lending Specialization, 29 total offices , Holding Company: National Bancshares, Inc.
Blackhawk Bank & Trust: East Moline Branch at 1315 Avenue Of The Cities, branch established on 2006/07/18. Info updated 2011/10/17: Bank assets: $1,009.6 mil, Deposits: $808.0 mil, headquarters in Milan, IL, positive income , Commercial Lending Specialization, 16 total offices , Holding Company: Blackhawk Bancorporation, Inc.
Union Federal Savings and Loan Association: 357 42nd Avenue Branch at 357 42nd Avenue, branch established on 1890/01/01. Info updated 2011/07/21: Bank assets: $122.1 mil, Deposits: $102.2 mil, headquarters in Kewanee, IL, positive income , Mortgage Lending Specialization, 7 total offices
First Midwest Bank: East Moline Kennedy Drive at 4150 Kennedy Drive, branch established on 1985/06/30. Info updated 2011/12/22: Bank assets: $7,848.0 mil, Deposits: $6,529.2 mil, headquarters in Itasca, IL, positive income , Commercial Lending Specialization, 100 total offices , Holding Company: First Midwest Bancorp, Inc.
For population 15 years and over in East Moline:
Never married: 32.5%Now married: 46.5%Separated: 2.5%Widowed: 8.0%Divorced: 10.5% For population 25 years and over in East Moline:
High school or higher: 85.5%Bachelor's degree or higher: 20.0%Graduate or professional degree: 6.5%Unemployed: 6.0%Mean travel time to work (commute): 17.6 minutes
Education Gini index (Inequality in education) Here:
14.7Illinois average:
12.5
Religion statistics for East Moline, IL (based on Rock Island County data)
Religion Adherents Congregations Evangelical Protestant 18,447 90 Catholic 18,258 14 Mainline Protestant 16,294 52 Other 6,037 12 Black Protestant 3,577 9 Orthodox 475 2 None 84,458 -
Source: Clifford Grammich, Kirk Hadaway, Richard Houseal, Dale E.Jones, Alexei Krindatch, Richie Stanley and Richard H.Taylor. 2012. 2010 U.S.Religion Census: Religious Congregations & Membership Study. Association of Statisticians of American Religious Bodies. Jones, Dale E., et al. 2002. Congregations and Membership in the United States 2000. Nashville, TN: Glenmary Research Center. Graphs represent county-level data
Food Environment Statistics: Number of grocery stores : 23Rock Island County :
1.56 / 10,000 pop.Illinois :
2.24 / 10,000 pop.
Number of supercenters and club stores : 1Rock Island County :
0.07 / 10,000 pop.State :
0.08 / 10,000 pop.
Number of convenience stores (no gas) : 13This county :
0.88 / 10,000 pop.Illinois :
0.75 / 10,000 pop.
Number of convenience stores (with gas) : 59Here :
4.01 / 10,000 pop.Illinois :
2.61 / 10,000 pop.
Number of full-service restaurants : 111Rock Island County :
7.54 / 10,000 pop.Illinois :
6.86 / 10,000 pop.
Adult diabetes rate : Rock Island County :
9.3%Illinois :
8.3%
Adult obesity rate : Rock Island County :
26.9%State :
25.2%
Low-income preschool obesity rate : Rock Island County :
7.5%Illinois :
14.5%
Health and Nutrition: Healthy diet rate : This city:
49.8%Illinois:
49.5%
Average overall health of teeth and gums : This city:
47.0%State:
47.2%
Average BMI : East Moline:
28.7Illinois:
28.6
People feeling badly about themselves : This city:
20.9%State:
20.5%
People not drinking alcohol at all : This city:
11.2%State:
10.8%
Average hours sleeping at night : General health condition : This city:
55.6%Illinois:
56.4%
Average condition of hearing : East Moline:
78.4%Illinois:
79.9%
More about Health and Nutrition of East Moline, IL Residents
Local government employment and payroll (March 2022)
Function
Full-time employees
Monthly full-time payroll
Average yearly full-time wage
Part-time employees
Monthly part-time payroll
Police Protection - Officers
35 $243,662 $83,541 0 $0 Firefighters
32 $238,301 $89,363 0 $0 Sewerage
18 $108,947 $72,631 0 $0 Water Supply
15 $91,536 $73,229 0 $0 Streets and Highways
7 $56,606 $97,039 0 $0 Financial Administration
5 $31,979 $76,750 0 $0 Local Libraries
4 $18,558 $55,674 11 $20,998 Police - Other
3 $16,080 $64,320 0 $0 Parks and Recreation
3 $17,852 $71,408 0 $0 Other and Unallocable
2 $11,337 $68,022 0 $0 Other Government Administration
2 $9,219 $55,314 12 $7,044 Fire - Other
1 $5,055 $60,660 0 $0 Health
0 $0 1 $1,683
Totals for Government
127 $849,133 $80,233 24 $29,725
East Moline government finances - Expenditure in 2018 (per resident):
Construction - General - Other: $1,690,000 ($80.96)
Regular Highways: $1,359,000 ($65.10)Water Utilities: $1,088,000 ($52.12)Sewerage: $837,000 ($40.10)Central Staff Services: $418,000 ($20.02)Local Fire Protection: $59,000 ($2.83)Parks and Recreation: $4,000 ($0.19)Current Operations - Police Protection: $5,826,000 ($279.10)
Local Fire Protection: $4,855,000 ($232.59)Sewerage: $4,712,000 ($225.74)Water Utilities: $4,117,000 ($197.23)General - Other: $2,019,000 ($96.72)Regular Highways: $1,194,000 ($57.20)Solid Waste Management: $941,000 ($45.08)Libraries: $787,000 ($37.70)Parks and Recreation: $780,000 ($37.37)Financial Administration: $335,000 ($16.05)Central Staff Services: $306,000 ($14.66)Health - Other: $206,000 ($9.87)Protective Inspection and Regulation - Other: $99,000 ($4.74)General Public Buildings: $95,000 ($4.55)General - Interest on Debt: $764,000 ($36.60)
Other Capital Outlay - Local Fire Protection: $484,000 ($23.19)
Regular Highways: $376,000 ($18.01)Water Utilities: $100,000 ($4.79)Central Staff Services: $21,000 ($1.01)Total Salaries and Wages: $10,802,000 ($517.49)
East Moline government finances - Revenue in 2018 (per resident):
Charges - Sewerage: $6,413,000 ($307.22)
Other: $996,000 ($47.71)Solid Waste Management: $921,000 ($44.12)Parks and Recreation: $573,000 ($27.45)Parking Facilities: $4,000 ($0.19)Federal Intergovernmental - Other: $25,000 ($1.20)
Local Intergovernmental - Other: $43,000 ($2.06)
Miscellaneous - General Revenue - Other: $727,000 ($34.83)
Fines and Forfeits: $148,000 ($7.09)Interest Earnings: $115,000 ($5.51)Revenue - Water Utilities: $5,245,000 ($251.27)
State Intergovernmental - General Local Government Support: $6,535,000 ($313.07)
Highways: $543,000 ($26.01)Other: $411,000 ($19.69)Tax - Property: $7,063,000 ($338.36)
Public Utilities Sales: $1,285,000 ($61.56)Other License: $265,000 ($12.70)Other Selective Sales: $3,000 ($0.14)
East Moline government finances - Debt in 2018 (per resident):
Long Term Debt - Outstanding Unspecified Public Purpose: $75,685,000 ($3625.80)
Beginning Outstanding - Unspecified Public Purpose: $70,381,000 ($3371.71)Issue, Unspecified Public Purpose: $8,926,000 ($427.61)Retired Unspecified Public Purpose: $3,622,000 ($173.52)Beginning Outstanding - Public Debt for Private Purpose: $1,120,000 ($53.66)Outstanding Nonguaranteed - Industrial Revenue: $1,120,000 ($53.66)
East Moline government finances - Cash and Securities in 2018 (per resident):
Other Funds - Cash and Securities: $17,524,000 ($839.51)
Sinking Funds - Cash and Securities: $1,120,000 ($53.66)
Businesses in East Moline, IL
Name Count Name Count
7-Eleven 2 KFC 1 Burger King 1 McDonald's 1 Chevrolet 1 Quiznos 1 Circle K 1 Subway 2 Comfort Inn 1 Super 8 1 Domino's Pizza 1 The Room Place 1 FedEx 2 U-Haul 1 Ford 1 U.S. Cellular 1 H&R Block 1 UPS 2 Hardee's 1 Walgreens 1 Jewel-Osco 1
Strongest AM radio stations in East Moline:
WKBF (1270 AM; 5 kW; ROCK ISLAND, IL; Owner: MERCURY BROADCASTING COMPANY, INC.)
WOC (1420 AM; 5 kW; DAVENPORT, IA; Owner: CITICASTERS LICENSES, L.P.)
WFXN (1230 AM; 1 kW; MOLINE, IL; Owner: CITICASTERS LICENSES, L.P.)
WDLM (960 AM; 1 kW; EAST MOLINE, IL; Owner: THE MOODY BIBLE INSTITUTE OF CHICAGO)
KJOC (1170 AM; 1 kW; DAVENPORT, IA; Owner: CUMULUS LICENSING CORP.)
WSCR (670 AM; 50 kW; CHICAGO, IL; Owner: INFINITY BROADCASTING OPERATIONS, INC.)
WGN (720 AM; 50 kW; CHICAGO, IL; Owner: WGN CONTINENTAL BROADCASTING CO.)
WBBM (780 AM; 50 kW; CHICAGO, IL; Owner: INFINITY BROADCASTING OPERATIONS, INC.)
WTMJ (620 AM; 50 kW; MILWAUKEE, WI; Owner: JOURNAL BROADCAST CORPORATION)
WLS (890 AM; 50 kW; CHICAGO, IL; Owner: WLS, INC.)
WMVP (1000 AM; 50 kW; CHICAGO, IL; Owner: ABC, INC.)
KXEL (1540 AM; 50 kW; WATERLOO, IA; Owner: KXEL BROADCASTING COMPANY, INC.)
WYLL (1160 AM; 50 kW; CHICAGO, IL; Owner: SCA LICENSE CORPORATION)
Strongest FM radio stations in East Moline:
WLLR-FM (103.7 FM; DAVENPORT, IA; Owner: CITICASTERS LICENSES, L.P.)
WVIK (90.3 FM; ROCK ISLAND, IL; Owner: AUGUSTANA COLLEGE)
WDLM-FM (89.3 FM; EAST MOLINE, IL; Owner: THE MOODY BIBLE INSTITUTE OF CHICAGO)
KCQQ (106.5 FM; DAVENPORT, IA; Owner: CITICASTERS LICENSES, L.P.)
KMXG (96.1 FM; CLINTON, IA; Owner: CITICASTERS LICENSES, L.P.)
KUUL (101.3 FM; EAST MOLINE, IL; Owner: CITICASTERS LICENSES, L.P.)
WHTS (98.9 FM; ROCK ISLAND, IL; Owner: MERCURY BROADCASTING COMPANY, INC.)
KORB (93.5 FM; BETTENDORF, IA; Owner: CUMULUS LICENSING CORP.)
WAXR (88.1 FM; GENESEO, IL; Owner: AMERICAN FAMILY ASSOCIATION)
WXLP (96.9 FM; MOLINE, IL; Owner: CUMULUS LICENSING CORP.)
KBOB-FM (104.9 FM; GENESEO, IL; Owner: CUMULUS LICENSING CORP.)
KBEA-FM (99.7 FM; MUSCATINE, IA; Owner: CUMULUS LICENSING CORP.)
KSUI (91.7 FM; IOWA CITY, IA; Owner: THE UNIVERSITY OF IOWA)
KALA (88.5 FM; DAVENPORT, IA; Owner: ST. AMBROSE COLLEGE)
K276DE (103.1 FM; DAVENPORT, IA; Owner: POWER DU PREE BROADCASTING COMPANY)
K288CY (105.5 FM; BETTENDORF, IA; Owner: ST. AMBROSE COLLEGE)
K233AA (94.5 FM; DAVENPORT, IA; Owner: UNIVERSITY OF NORTHERN IOWA)
TV broadcast stations around East Moline:
WBQD-LP (Channel 26; DAVENPORT, IA; Owner: FOUR SEASONS PEORIA, LLC)
WHBF-TV (Channel 4; ROCK ISLAND, IL; Owner: CORONET COMMUNICATIONS COMPANY)
K61HD (Channel 61; DAVENPORT, IA; Owner: TRINITY BROADCASTING NETWORK)
KWQC-TV (Channel 6; DAVENPORT, IA; Owner: YOUNG BROADCASTING OF DAVENPORT, INC.)
KLJB-TV (Channel 18; DAVENPORT, IA; Owner: QUAD CITIES TELEVISION ACQUISITION CORP.)
WQAD-TV (Channel 8; MOLINE, IL; Owner: NEW YORK TIMES MANAGEMENT SERVICES)
WQPT-TV (Channel 24; MOLINE, IL; Owner: BLACK HAWK COLLEGE)
KQIN (Channel 36; DAVENPORT, IA; Owner: IOWA PUBLIC BROADCASTING BOARD)
K16EL (Channel 66; DAVENPORT, IA; Owner: THREE ANGELS BROADCASTING NETWORK)
KIIN (Channel 12; IOWA CITY, IA; Owner: IOWA PUBLIC BROADCASTING BOARD)
KWKB (Channel 20; IOWA CITY, IA; Owner: KM TELEVISION OF IOWA, L.L.C.)
National Bridge Inventory (NBI) Statistics 48 Number of bridges663ft / 202m Total length $2,214,000 Total costs310,610 Total average daily traffic79,979 Total average daily truck traffic
New bridges - historical statistics
1 1920-1929 3 1930-1939 1 1940-1949 7 1960-1969 17 1970-1979 6 1980-1989 4 1990-1999 3 2000-2009 6 2010-2019
See full National Bridge Inventory statistics for East Moline, IL
Home Mortgage Disclosure Act Aggregated Statistics For Year 2009(Based on 2 full and 4 partial tracts) A) FHA, FSA/RHS & VA B) Conventional C) Refinancings D) Home Improvement Loans E) Loans on Dwellings For 5+ Families F) Non-occupant Loans on Number Average Value Number Average Value Number Average Value Number Average Value Number Average Value Number Average Value
LOANS ORIGINATED 87 $104,280 88 $93,150 369 $91,728 76 $24,495 5 $619,398 32 $78,982 APPLICATIONS APPROVED, NOT ACCEPTED 2 $89,520 2 $68,610 23 $91,305 3 $10,200 0 $0 0 $0 APPLICATIONS DENIED 10 $109,457 14 $74,565 67 $86,937 15 $17,895 0 $0 4 $65,115 APPLICATIONS WITHDRAWN 6 $100,893 3 $101,307 43 $103,496 6 $54,437 0 $0 0 $0 FILES CLOSED FOR INCOMPLETENESS 1 $72,320 2 $53,000 10 $97,333 3 $38,787 0 $0 1 $21,850
Aggregated Statistics For Year 2008(Based on 2 full and 4 partial tracts) A) FHA, FSA/RHS & VA B) Conventional C) Refinancings D) Home Improvement Loans E) Loans on Dwellings For 5+ Families F) Non-occupant Loans on G) Loans On Manufactured Number Average Value Number Average Value Number Average Value Number Average Value Number Average Value Number Average Value Number Average Value
LOANS ORIGINATED 62 $92,815 130 $86,142 215 $85,407 64 $29,089 3 $247,443 35 $65,275 0 $0 APPLICATIONS APPROVED, NOT ACCEPTED 2 $79,525 6 $99,325 35 $84,188 6 $21,312 0 $0 4 $59,050 0 $0 APPLICATIONS DENIED 6 $98,895 17 $96,975 104 $96,156 38 $31,303 0 $0 5 $65,422 1 $35,900 APPLICATIONS WITHDRAWN 3 $101,943 12 $76,998 52 $104,814 9 $56,772 0 $0 1 $43,700 0 $0 FILES CLOSED FOR INCOMPLETENESS 2 $142,690 0 $0 7 $97,777 2 $28,010 0 $0 0 $0 0 $0
Aggregated Statistics For Year 2007(Based on 2 full and 4 partial tracts) A) FHA, FSA/RHS & VA B) Conventional C) Refinancings D) Home Improvement Loans E) Loans on Dwellings For 5+ Families F) Non-occupant Loans on G) Loans On Manufactured Number Average Value Number Average Value Number Average Value Number Average Value Number Average Value Number Average Value Number Average Value
LOANS ORIGINATED 32 $92,411 226 $96,841 239 $77,589 104 $26,865 1 $1,705,690 58 $96,089 1 $12,760 APPLICATIONS APPROVED, NOT ACCEPTED 0 $0 23 $67,069 45 $94,571 9 $37,463 0 $0 5 $72,096 0 $0 APPLICATIONS DENIED 5 $77,986 27 $77,807 127 $90,581 52 $29,207 0 $0 10 $62,444 4 $11,150 APPLICATIONS WITHDRAWN 5 $101,030 18 $92,654 57 $86,624 9 $59,972 1 $43,700 1 $97,010 0 $0 FILES CLOSED FOR INCOMPLETENESS 0 $0 2 $92,300 12 $92,175 1 $66,280 0 $0 0 $0 0 $0
Aggregated Statistics For Year 2006(Based on 2 full and 4 partial tracts) A) FHA, FSA/RHS & VA B) Conventional C) Refinancings D) Home Improvement Loans E) Loans on Dwellings For 5+ Families F) Non-occupant Loans on G) Loans On Manufactured Number Average Value Number Average Value Number Average Value Number Average Value Number Average Value Number Average Value Number Average Value
LOANS ORIGINATED 33 $91,926 224 $81,548 257 $75,559 87 $22,002 1 $19,020 40 $56,816 4 $45,382 APPLICATIONS APPROVED, NOT ACCEPTED 3 $73,500 24 $71,362 44 $74,677 3 $20,477 0 $0 5 $50,314 0 $0 APPLICATIONS DENIED 6 $114,267 41 $90,835 164 $86,813 48 $40,933 1 $920 7 $197,170 0 $0 APPLICATIONS WITHDRAWN 4 $107,682 34 $86,176 102 $94,523 5 $25,426 0 $0 2 $57,710 0 $0 FILES CLOSED FOR INCOMPLETENESS 0 $0 6 $101,270 24 $99,215 2 $99,660 0 $0 2 $102,310 0 $0
Aggregated Statistics For Year 2005(Based on 2 full and 4 partial tracts) A) FHA, FSA/RHS & VA B) Conventional C) Refinancings D) Home Improvement Loans F) Non-occupant Loans on G) Loans On Manufactured Number Average Value Number Average Value Number Average Value Number Average Value Number Average Value Number Average Value
LOANS ORIGINATED 26 $96,665 213 $83,039 294 $74,934 109 $17,928 43 $64,738 0 $0 APPLICATIONS APPROVED, NOT ACCEPTED 0 $0 23 $86,787 43 $74,931 10 $28,756 4 $66,380 2 $14,840 APPLICATIONS DENIED 3 $86,887 39 $73,563 167 $84,764 55 $29,412 11 $71,666 4 $13,720 APPLICATIONS WITHDRAWN 1 $81,000 34 $74,210 108 $98,630 26 $92,140 8 $73,381 0 $0 FILES CLOSED FOR INCOMPLETENESS 0 $0 4 $68,742 12 $82,357 1 $19,380 0 $0 0 $0
Aggregated Statistics For Year 2004(Based on 2 full and 4 partial tracts) A) FHA, FSA/RHS & VA B) Conventional C) Refinancings D) Home Improvement Loans E) Loans on Dwellings For 5+ Families F) Non-occupant Loans on G) Loans On Manufactured Number Average Value Number Average Value Number Average Value Number Average Value Number Average Value Number Average Value Number Average Value
LOANS ORIGINATED 47 $83,461 237 $81,203 353 $77,448 119 $17,238 1 $218,500 53 $55,386 3 $40,303 APPLICATIONS APPROVED, NOT ACCEPTED 3 $82,507 16 $94,378 60 $66,380 9 $23,316 0 $0 0 $0 1 $13,810 APPLICATIONS DENIED 4 $73,615 36 $80,648 184 $77,560 46 $21,976 0 $0 9 $65,429 0 $0 APPLICATIONS WITHDRAWN 3 $75,267 27 $77,904 111 $76,433 12 $33,553 0 $0 8 $60,594 0 $0 FILES CLOSED FOR INCOMPLETENESS 0 $0 3 $84,467 9 $81,616 5 $36,316 0 $0 1 $118,980 0 $0
Aggregated Statistics For Year 2003(Based on 2 full and 4 partial tracts) A) FHA, FSA/RHS & VA B) Conventional C) Refinancings D) Home Improvement Loans E) Loans on Dwellings For 5+ Families F) Non-occupant Loans on Number Average Value Number Average Value Number Average Value Number Average Value Number Average Value Number Average Value
LOANS ORIGINATED 51 $81,514 190 $83,093 821 $80,355 125 $17,814 2 $223,000 57 $71,405 APPLICATIONS APPROVED, NOT ACCEPTED 2 $65,250 8 $97,000 59 $73,340 11 $22,219 0 $0 8 $33,928 APPLICATIONS DENIED 1 $98,310 38 $68,221 168 $71,075 26 $13,669 0 $0 9 $81,993 APPLICATIONS WITHDRAWN 4 $61,902 40 $68,104 171 $81,257 7 $32,020 0 $0 8 $73,709 FILES CLOSED FOR INCOMPLETENESS 1 $52,320 4 $70,405 27 $87,117 2 $15,775 0 $0 0 $0
Aggregated Statistics For Year 2002(Based on 2 full and 4 partial tracts) A) FHA, FSA/RHS & VA B) Conventional C) Refinancings D) Home Improvement Loans F) Non-occupant Loans on Number Average Value Number Average Value Number Average Value Number Average Value Number Average Value
LOANS ORIGINATED 41 $77,956 196 $78,589 511 $77,380 135 $14,972 42 $54,457 APPLICATIONS APPROVED, NOT ACCEPTED 3 $79,393 11 $65,487 49 $65,239 15 $16,702 3 $33,803 APPLICATIONS DENIED 6 $67,218 25 $55,932 151 $66,719 58 $11,619 10 $39,078 APPLICATIONS WITHDRAWN 2 $108,700 23 $69,867 89 $70,246 13 $13,790 3 $32,350 FILES CLOSED FOR INCOMPLETENESS 3 $83,430 2 $68,370 15 $87,571 1 $48,940 0 $0
Aggregated Statistics For Year 2001(Based on 2 full and 4 partial tracts) A) FHA, FSA/RHS & VA B) Conventional C) Refinancings D) Home Improvement Loans E) Loans on Dwellings For 5+ Families F) Non-occupant Loans on Number Average Value Number Average Value Number Average Value Number Average Value Number Average Value Number Average Value
LOANS ORIGINATED 38 $75,013 151 $77,182 452 $67,237 141 $12,050 2 $124,470 24 $46,179 APPLICATIONS APPROVED, NOT ACCEPTED 1 $74,960 7 $77,446 47 $51,313 20 $12,564 0 $0 3 $46,920 APPLICATIONS DENIED 1 $69,740 29 $46,257 155 $59,886 63 $11,106 0 $0 3 $31,727 APPLICATIONS WITHDRAWN 3 $74,447 20 $67,291 107 $58,428 11 $14,059 0 $0 1 $114,770 FILES CLOSED FOR INCOMPLETENESS 0 $0 1 $64,680 12 $73,805 0 $0 0 $0 0 $0
Aggregated Statistics For Year 2000(Based on 2 full and 4 partial tracts) A) FHA, FSA/RHS & VA B) Conventional C) Refinancings D) Home Improvement Loans E) Loans on Dwellings For 5+ Families F) Non-occupant Loans on Number Average Value Number Average Value Number Average Value Number Average Value Number Average Value Number Average Value
LOANS ORIGINATED 52 $67,901 177 $69,323 169 $50,114 143 $14,278 2 $775,820 27 $40,043 APPLICATIONS APPROVED, NOT ACCEPTED 1 $139,090 14 $59,826 30 $46,968 19 $13,068 0 $0 1 $29,980 APPLICATIONS DENIED 6 $60,043 37 $54,774 134 $47,565 49 $16,026 0 $0 6 $36,460 APPLICATIONS WITHDRAWN 0 $0 21 $60,512 125 $48,807 19 $19,611 0 $0 2 $50,040 FILES CLOSED FOR INCOMPLETENESS 0 $0 1 $54,980 15 $66,753 0 $0 0 $0 1 $34,960
Aggregated Statistics For Year 1999(Based on 1 full and 5 partial tracts) A) FHA, FSA/RHS & VA B) Conventional C) Refinancings D) Home Improvement Loans E) Loans on Dwellings For 5+ Families F) Non-occupant Loans on Number Average Value Number Average Value Number Average Value Number Average Value Number Average Value Number Average Value
LOANS ORIGINATED 78 $66,971 175 $65,611 253 $59,367 176 $13,124 0 $0 20 $37,500 APPLICATIONS APPROVED, NOT ACCEPTED 3 $71,297 13 $50,466 54 $49,590 19 $10,574 0 $0 1 $13,780 APPLICATIONS DENIED 5 $89,036 39 $46,406 105 $52,267 56 $8,906 0 $0 6 $27,383 APPLICATIONS WITHDRAWN 2 $34,650 25 $70,353 97 $57,036 19 $26,672 1 $2,278,870 1 $65,300 FILES CLOSED FOR INCOMPLETENESS 1 $63,160 1 $31,490 28 $56,776 0 $0 0 $0 1 $52,630
Detailed HMDA statistics for the following Tracts:
0204.00
, 0206.00 , 0207.00 , 0208.00 , 0209.00 , 0210.00
Private Mortgage Insurance Companies Aggregated Statistics For Year 2009(Based on 2 full and 4 partial tracts) A) Conventional B) Refinancings Number Average Value Number Average Value
LOANS ORIGINATED 20 $103,948 22 $118,962 APPLICATIONS APPROVED, NOT ACCEPTED 1 $85,580 3 $109,180 APPLICATIONS DENIED 0 $0 0 $0 APPLICATIONS WITHDRAWN 1 $145,960 1 $178,830 FILES CLOSED FOR INCOMPLETENESS 0 $0 0 $0
Aggregated Statistics For Year 2008(Based on 2 full and 4 partial tracts) A) Conventional B) Refinancings C) Non-occupant Loans on Number Average Value Number Average Value Number Average Value
LOANS ORIGINATED 46 $91,910 15 $106,705 4 $71,685 APPLICATIONS APPROVED, NOT ACCEPTED 13 $88,700 6 $162,398 3 $64,497 APPLICATIONS DENIED 2 $72,260 2 $92,685 2 $72,260 APPLICATIONS WITHDRAWN 2 $58,500 0 $0 0 $0 FILES CLOSED FOR INCOMPLETENESS 0 $0 0 $0 0 $0
Aggregated Statistics For Year 2007(Based on 2 full and 4 partial tracts) A) Conventional B) Refinancings C) Non-occupant Loans on D) Loans On Manufactured Number Average Value Number Average Value Number Average Value Number Average Value
LOANS ORIGINATED 107 $90,087 22 $101,860 6 $66,488 1 $78,660 APPLICATIONS APPROVED, NOT ACCEPTED 10 $86,348 3 $98,520 1 $41,000 0 $0 APPLICATIONS DENIED 1 $90,250 0 $0 0 $0 0 $0 APPLICATIONS WITHDRAWN 2 $150,145 1 $163,250 0 $0 0 $0 FILES CLOSED FOR INCOMPLETENESS 0 $0 0 $0 0 $0 0 $0
Aggregated Statistics For Year 2006(Based on 2 full and 4 partial tracts) A) Conventional B) Refinancings C) Non-occupant Loans on Number Average Value Number Average Value Number Average Value
LOANS ORIGINATED 70 $87,246 19 $94,148 5 $65,344 APPLICATIONS APPROVED, NOT ACCEPTED 1 $104,870 5 $83,604 0 $0 APPLICATIONS DENIED 3 $47,240 0 $0 0 $0 APPLICATIONS WITHDRAWN 3 $38,197 0 $0 0 $0 FILES CLOSED FOR INCOMPLETENESS 1 $39,000 0 $0 0 $0
Aggregated Statistics For Year 2005(Based on 2 full and 4 partial tracts) A) Conventional B) Refinancings C) Non-occupant Loans on Number Average Value Number Average Value Number Average Value
LOANS ORIGINATED 62 $88,183 30 $87,677 5 $60,048 APPLICATIONS APPROVED, NOT ACCEPTED 1 $245,040 3 $56,217 0 $0 APPLICATIONS DENIED 1 $105,530 1 $110,300 0 $0 APPLICATIONS WITHDRAWN 4 $104,535 2 $89,210 0 $0 FILES CLOSED FOR INCOMPLETENESS 1 $23,810 0 $0 1 $23,810
Aggregated Statistics For Year 2004(Based on 2 full and 4 partial tracts) A) Conventional B) Refinancings C) Non-occupant Loans on Number Average Value Number Average Value Number Average Value
LOANS ORIGINATED 83 $81,743 28 $91,266 5 $43,310 APPLICATIONS APPROVED, NOT ACCEPTED 8 $92,558 9 $101,023 1 $48,090 APPLICATIONS DENIED 0 $0 0 $0 0 $0 APPLICATIONS WITHDRAWN 3 $51,943 0 $0 0 $0 FILES CLOSED FOR INCOMPLETENESS 0 $0 0 $0 0 $0
Aggregated Statistics For Year 2003(Based on 2 full and 4 partial tracts) A) Conventional B) Refinancings C) Non-occupant Loans on Number Average Value Number Average Value Number Average Value
LOANS ORIGINATED 84 $81,983 87 $91,857 4 $38,620 APPLICATIONS APPROVED, NOT ACCEPTED 16 $67,433 14 $84,651 1 $30,590 APPLICATIONS DENIED 0 $0 0 $0 0 $0 APPLICATIONS WITHDRAWN 4 $54,940 4 $97,182 2 $87,450 FILES CLOSED FOR INCOMPLETENESS 0 $0 0 $0 0 $0
Aggregated Statistics For Year 2002(Based on 2 full and 4 partial tracts) A) Conventional B) Refinancings C) Non-occupant Loans on Number Average Value Number Average Value Number Average Value
LOANS ORIGINATED 78 $71,046 59 $85,255 4 $36,495 APPLICATIONS APPROVED, NOT ACCEPTED 6 $86,750 8 $80,224 1 $62,810 APPLICATIONS DENIED 2 $54,140 0 $0 0 $0 APPLICATIONS WITHDRAWN 1 $94,280 3 $63,393 1 $55,170 FILES CLOSED FOR INCOMPLETENESS 0 $0 0 $0 0 $0
Aggregated Statistics For Year 2001(Based on 2 full and 4 partial tracts) A) Conventional B) Refinancings C) Non-occupant Loans on Number Average Value Number Average Value Number Average Value
LOANS ORIGINATED 58 $77,596 48 $86,986 5 $55,390 APPLICATIONS APPROVED, NOT ACCEPTED 6 $63,537 5 $88,832 1 $70,790 APPLICATIONS DENIED 3 $52,347 0 $0 1 $55,060 APPLICATIONS WITHDRAWN 2 $84,060 2 $109,960 1 $41,000 FILES CLOSED FOR INCOMPLETENESS 0 $0 1 $86,560 0 $0
Aggregated Statistics For Year 2000(Based on 2 full and 4 partial tracts) A) Conventional B) Refinancings C) Non-occupant Loans on Number Average Value Number Average Value Number Average Value
LOANS ORIGINATED 59 $71,305 8 $53,629 1 $20,980 APPLICATIONS APPROVED, NOT ACCEPTED 1 $63,320 1 $107,570 0 $0 APPLICATIONS DENIED 0 $0 0 $0 0 $0 APPLICATIONS WITHDRAWN 2 $96,820 0 $0 0 $0 FILES CLOSED FOR INCOMPLETENESS 0 $0 0 $0 0 $0
Aggregated Statistics For Year 1999(Based on 1 full and 5 partial tracts) A) Conventional B) Refinancings C) Non-occupant Loans on Number Average Value Number Average Value Number Average Value
LOANS ORIGINATED 69 $69,872 18 $87,451 2 $40,450 APPLICATIONS APPROVED, NOT ACCEPTED 9 $61,789 7 $78,919 1 $27,110 APPLICATIONS DENIED 3 $32,010 1 $46,330 1 $23,000 APPLICATIONS WITHDRAWN 4 $80,350 0 $0 0 $0 FILES CLOSED FOR INCOMPLETENESS 0 $0 0 $0 0 $0
Detailed PMIC statistics for the following Tracts:
0204.00
, 0206.00 , 0207.00 , 0208.00 , 0209.00 , 0210.00 Fire-safe hotels and motels in East Moline, Illinois:
Super 8, 2201 John Deere Expy, East Moline, Illinois 61244 Phone: (309) 796-1999, Fax: (309) 792-2670
Comfort Inn & Suites, 2209 John Deere Expy, East Moline, Illinois 61244 Phone: (309) 792-4660
Hyatt House /Hyatt Place East Moline Quad Cities, 111 Bend Blvd, East moline, Illinois 61244 Phone: (888) 591-1234
All 3 fire-safe hotels and motels in East Moline, Illinois
Most common first names in East Moline, IL among deceased individuals Name Count Lived (average)
Mary 185 78.1 years John 169 76.6 years William 157 75.1 years Robert 150 69.8 years James 118 71.5 years Charles 99 74.1 years George 97 72.8 years Helen 87 78.4 years Frank 83 76.1 years Dorothy 80 79.4 years
Most common last names in East Moline, IL among deceased individuals Last name Count Lived (average)
Johnson 87 75.0 years Smith 67 76.4 years Miller 60 77.2 years Anderson 55 78.3 years Williams 52 72.2 years Nelson 31 75.6 years Jones 29 73.2 years Davis 28 71.5 years Peterson 28 80.9 years Wilson 27 73.8 years
East Moline compared to Illinois state average:
Median house value below state average. Unemployed percentage below state average. Length of stay since moving in above state average. Institutionalized population percentage significantly above state average. Number of college students below state average. East Moline on our top lists :
#22 on the list of "Top 101 cities with the most residents born in Other Western Africa (population 500+)"
#84 (61265) on the list of "Top 101 zip codes with the most alcohol drinking places in 2005"
#52 on the list of "Top 101 counties with the largest increase in the number of births per 1000 residents 2000-2006 to 2007-2013 (pop 50,000+)"
#79 on the list of "Top 101 counties with the largest number of people moving out compared to moving in (pop. 50,000+)"
Top Patent Applicants
Corwin M. Puryk (8)
Chad A. Dow (6)
Kyle A. Meeske (5)
William Douglas Graham (5)
Corwin Marcus Raymond Puryk (4)
Terry L. Snipes (3)
James A. Quandt (3)
Richard Arnold Valenzuela (3)
Brent A. Augustine (3)
Philip C. Kester (3)
Total of 87 patent applications in 2008-2024.

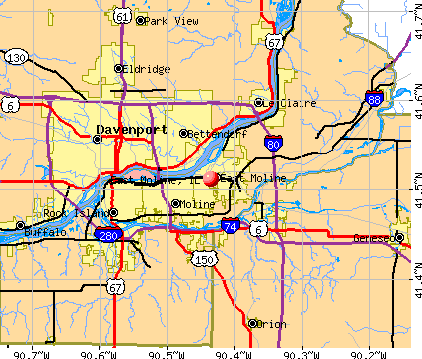


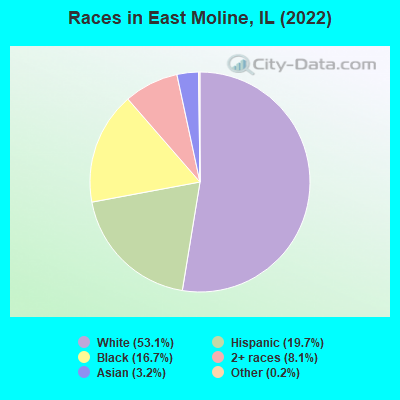
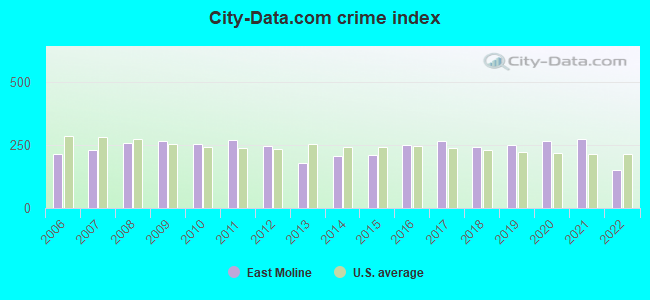
 Recent articles from our blog. Our writers, many of them Ph.D. graduates or candidates, create easy-to-read articles on a wide variety of topics.

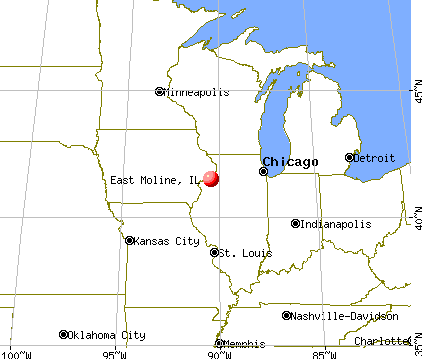
 (8.3 miles
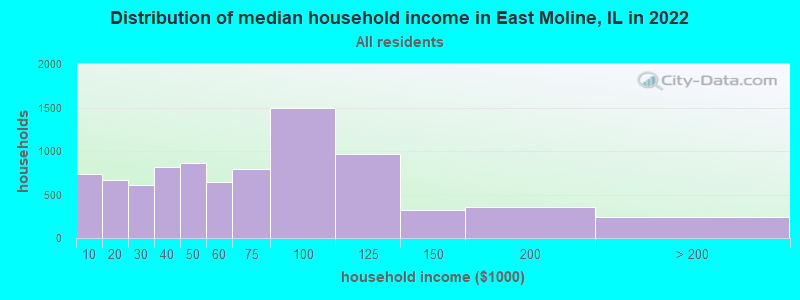
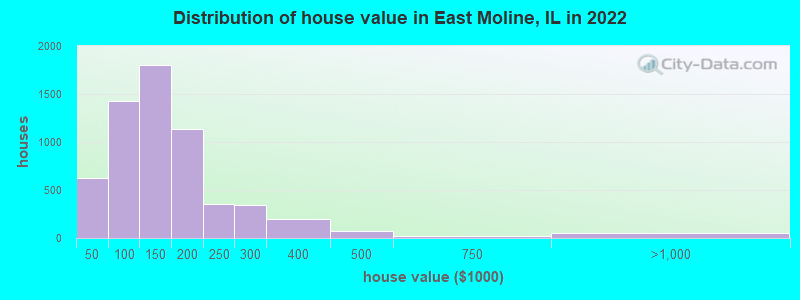
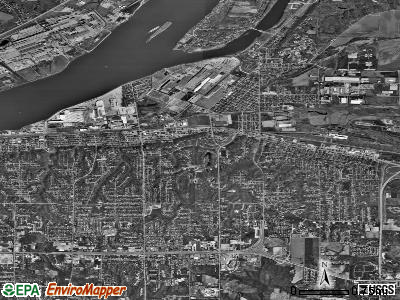
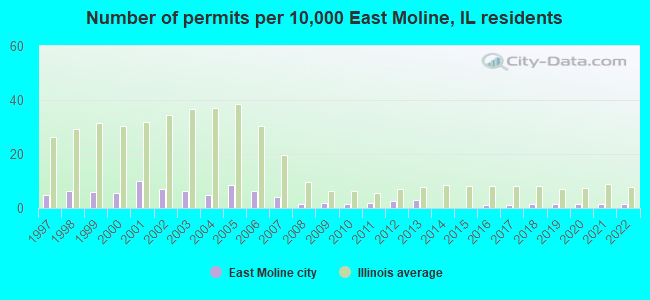
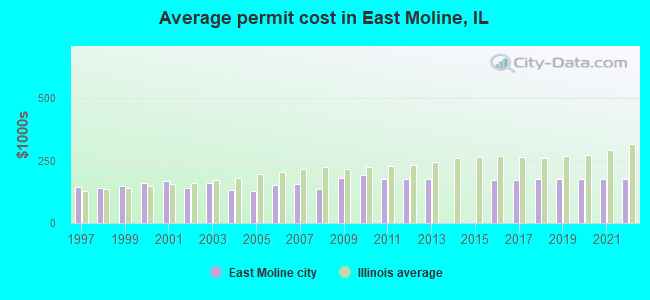
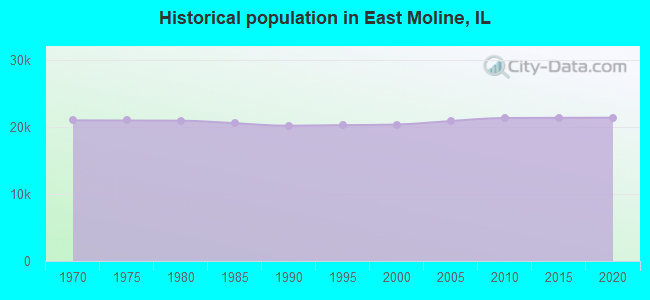
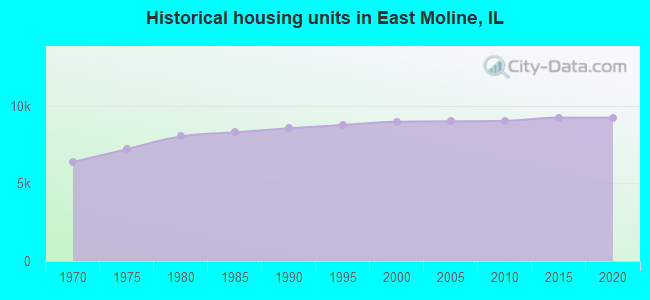
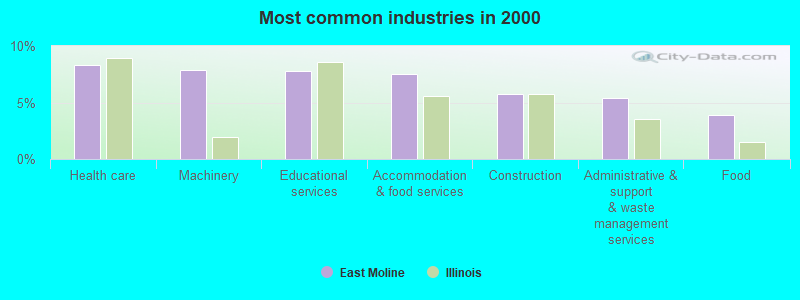
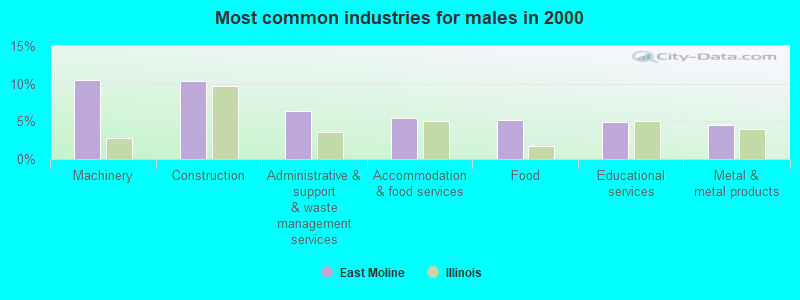
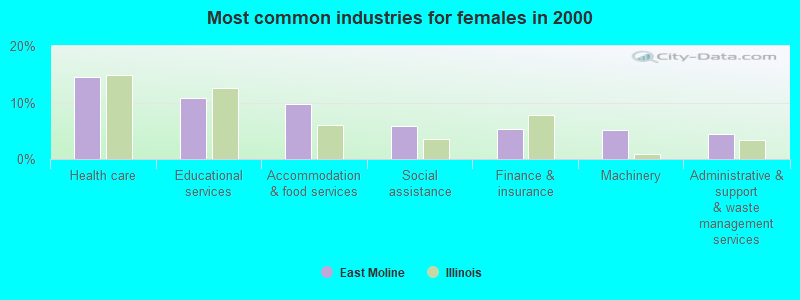
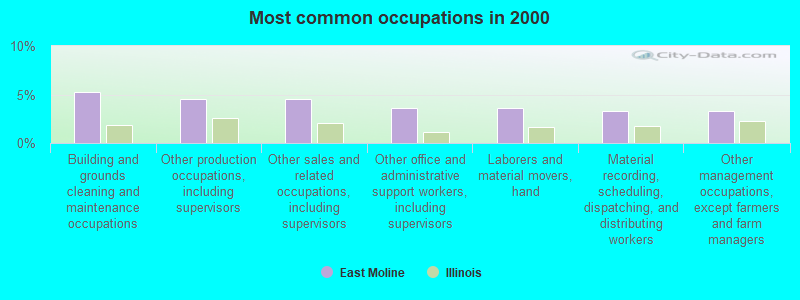
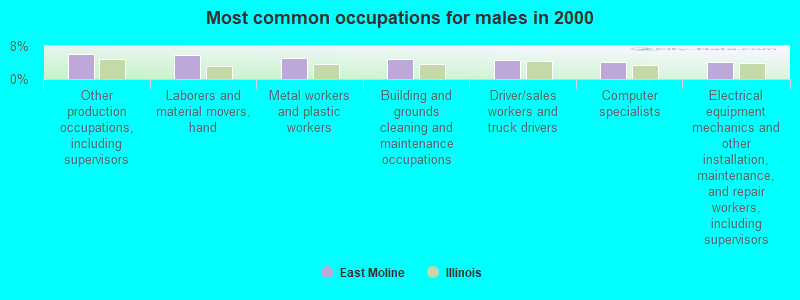
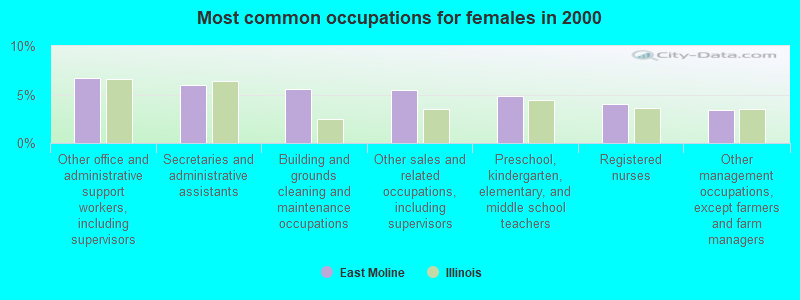
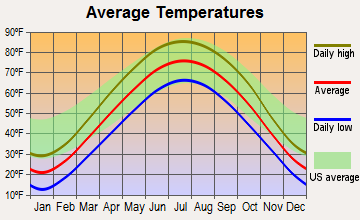
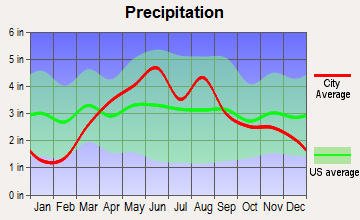
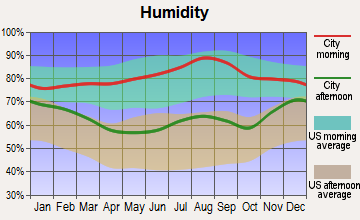
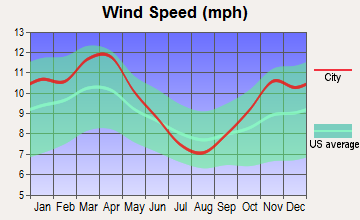
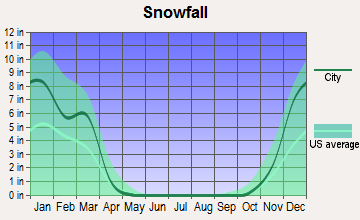
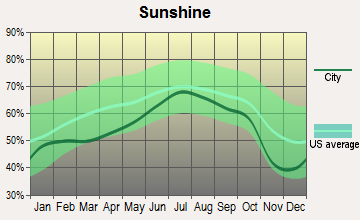
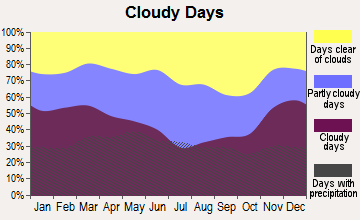
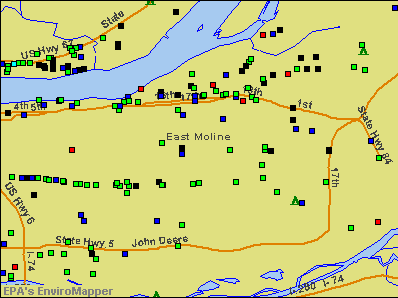

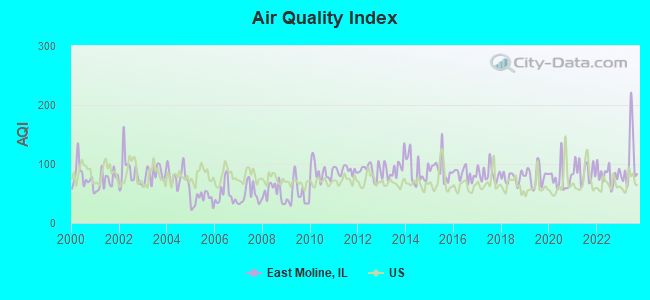
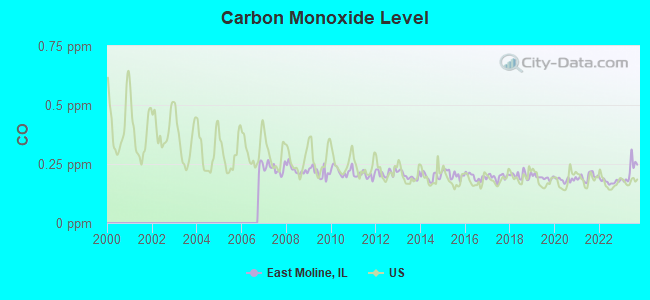
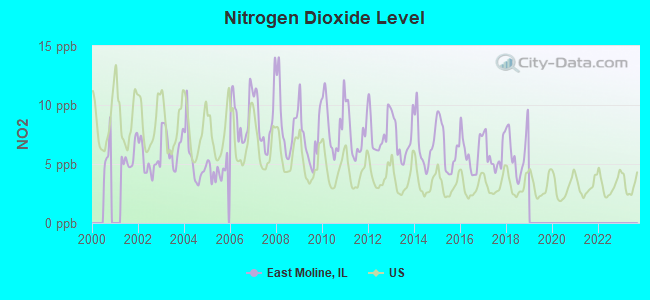
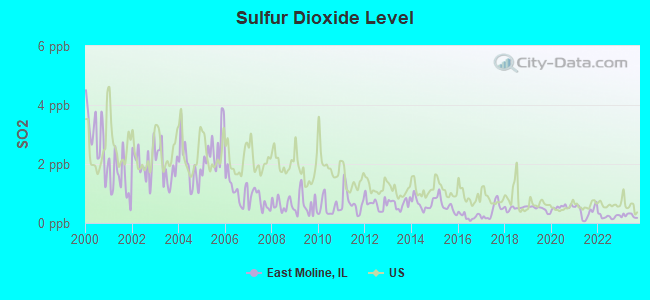
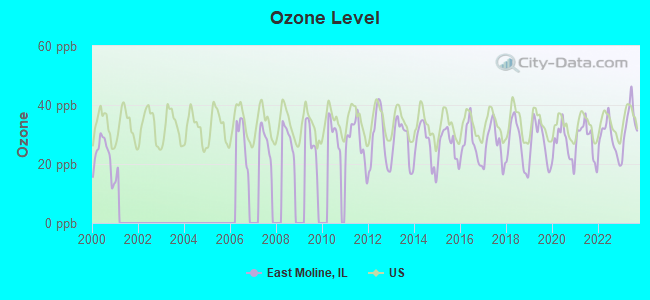
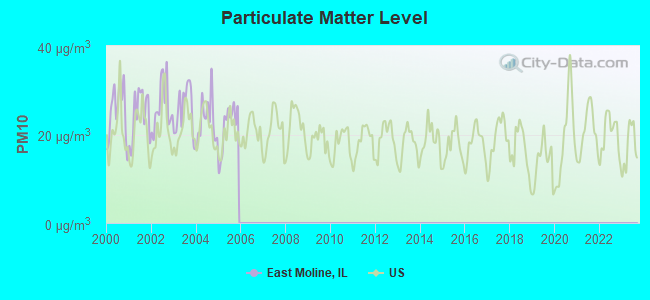
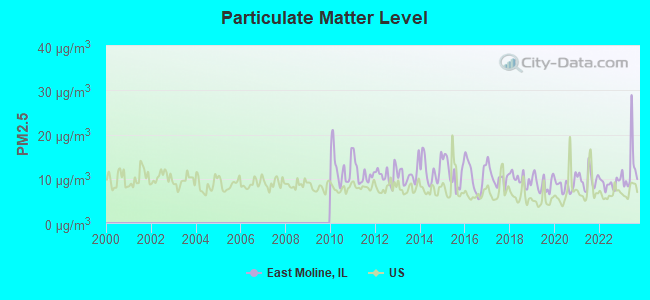

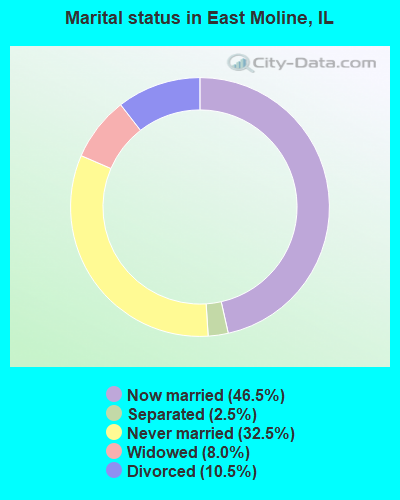
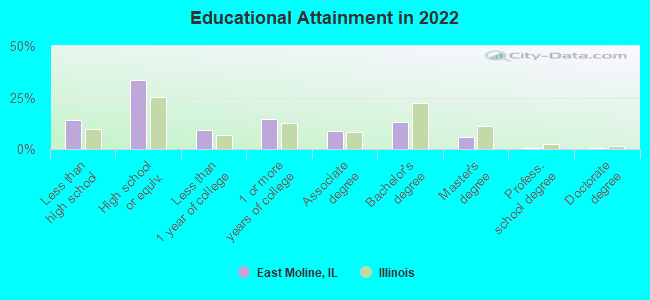
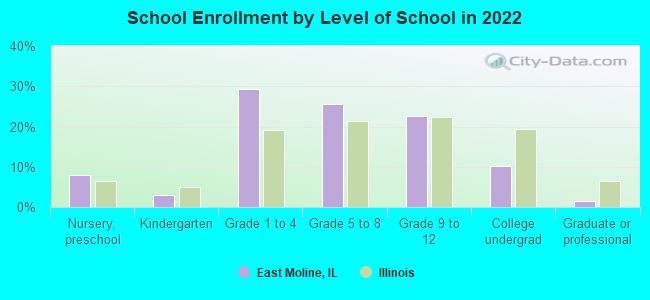
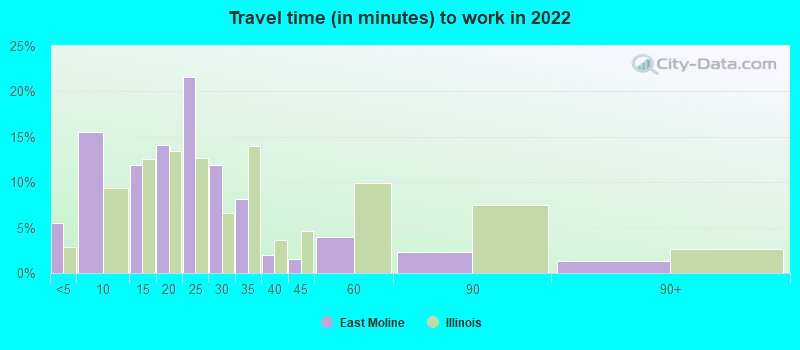
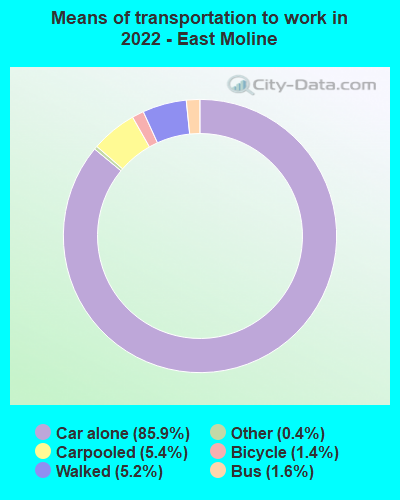
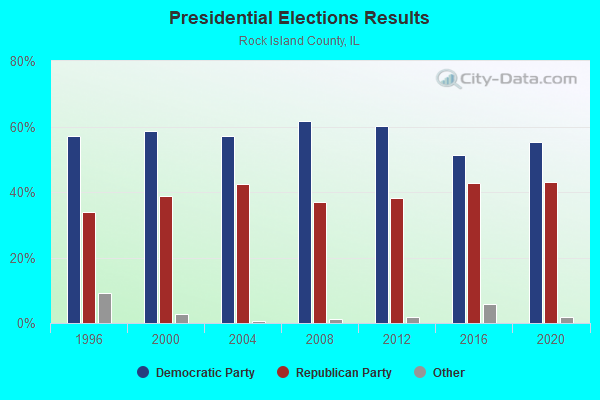
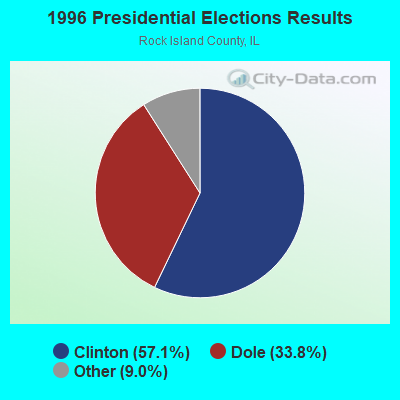
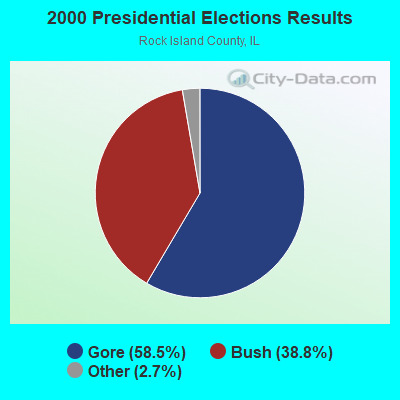
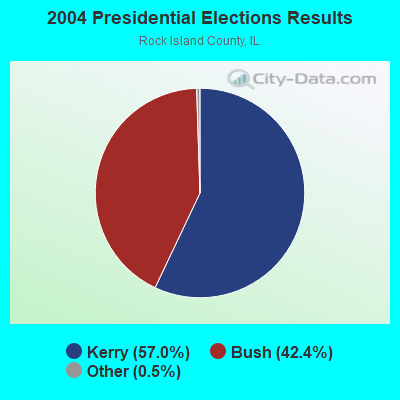
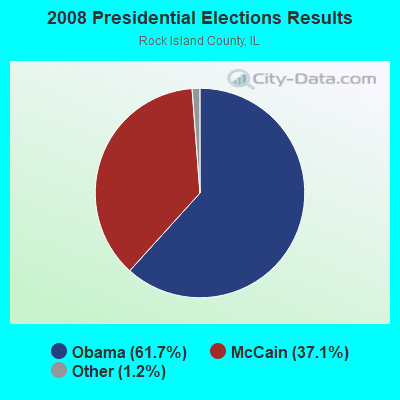
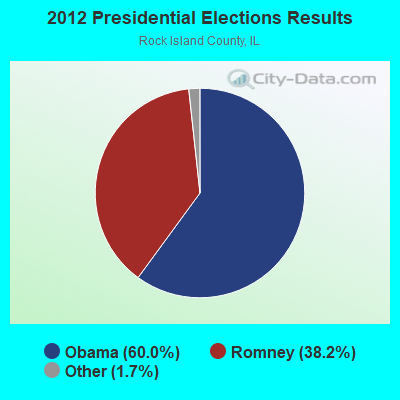
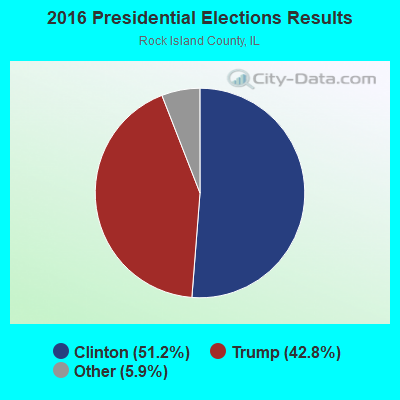

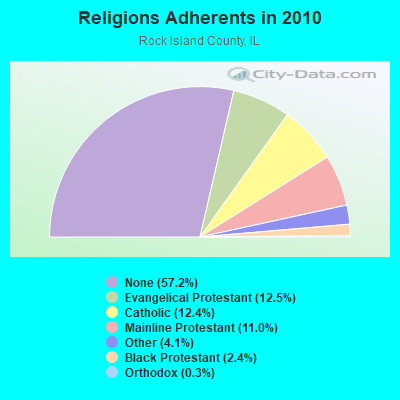
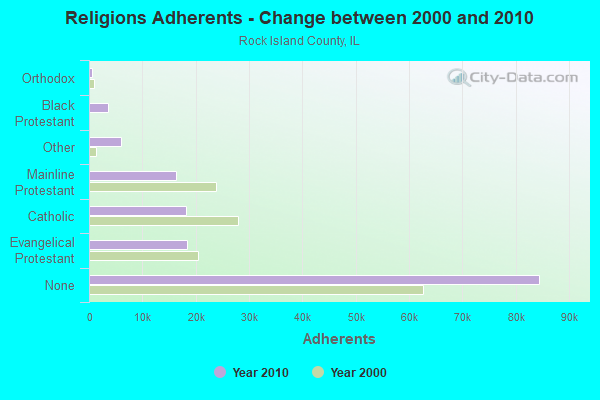
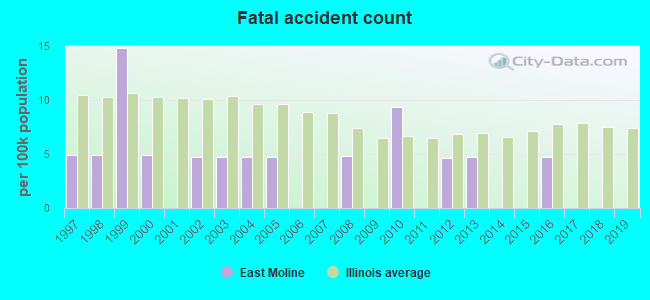
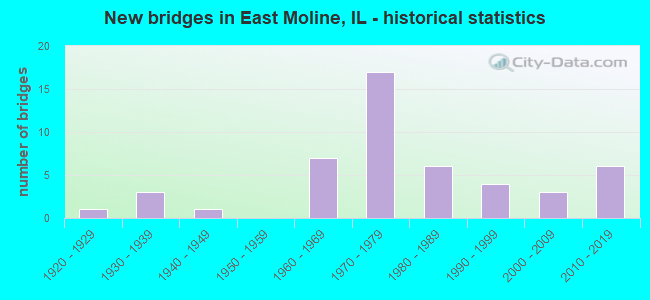
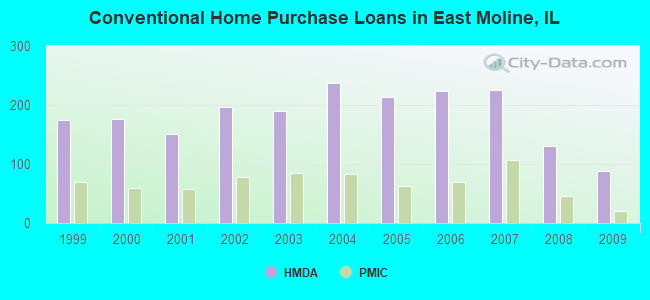
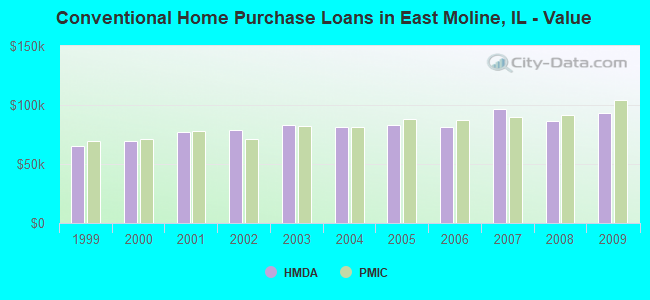
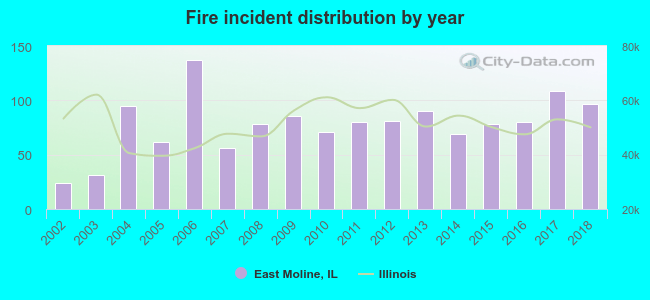 According to the data from the years 2002 - 2018 the average number of fires per year is 78. The highest number of fires - 137 took place in 2006, and the least - 24 in 2002. The data has a rising trend.
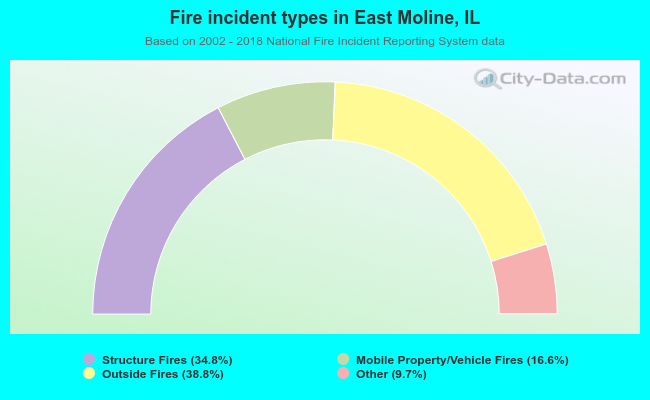 When looking into fire subcategories, the most incidents belonged to: Outside Fires (38.8%), and Structure Fires (34.8%).