Estimated zip code population in 2022: 10,804 Zip code population in 2010: 9,973 Zip code population in 2000: 9,367
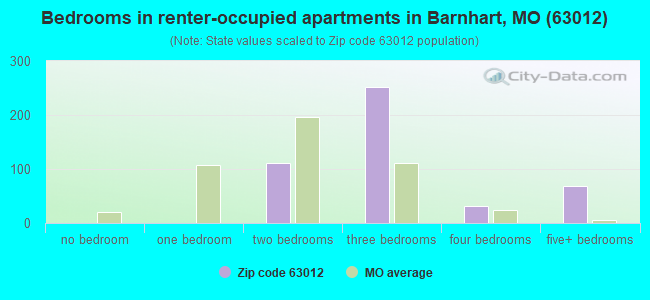
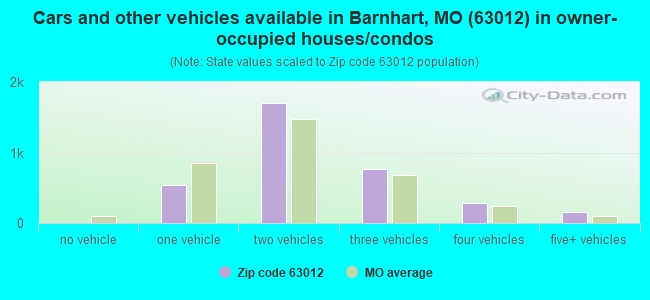
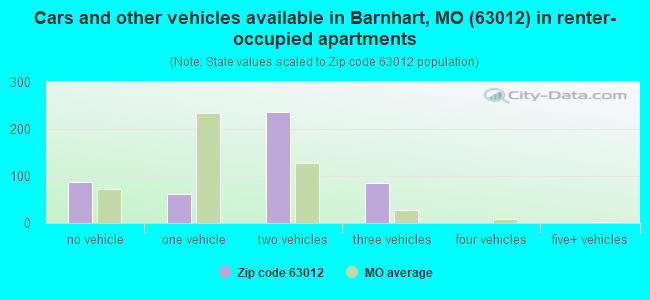
Houses and condos: 4,092 Renter-occupied apartments: 473
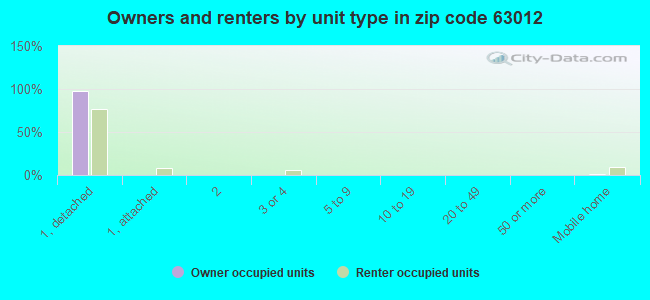
% of renters here:
12%
State:
32%
March 2022 cost of living index in zip code 63012: 95.9 (near average, U.S. average is 100)
Land area: 28.5 sq. mi. Water area: 0.5 sq. mi.
Population density: 379 people per square mile
(very low).
OSM Map
General Map
Google Map
MSN Map
OSM Map
General Map
Google Map
MSN Map
OSM Map
General Map
Google Map
MSN Map
OSM Map
General Map
Google Map
MSN Map
Please wait while loading the map...
Real estate property taxes paid for housing units in 2022:
This zip code:
0.9% ($2,055)
Missouri:
0.8% ($1,810)
Median real estate property taxes paid for housing units with mortgages in 2022: $2,144 (0.9%) Median real estate property taxes paid for housing units with no mortgage in 2022: $1,815 (0.8%)
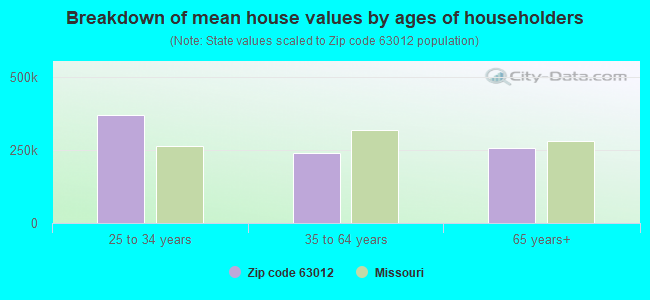
Estimated median house/condo value in 2022: $240,835
63012:
$240,835
Missouri:
$221,200
According to our research of Missouri and other state lists, there were 27 registered sex offenders living in 63012 zip code as of April 27, 2024. The ratio of all residents to sex offenders in zip code 63012 is 399 to 1. The ratio of registered sex offenders to all residents in this zip code is near the state average.
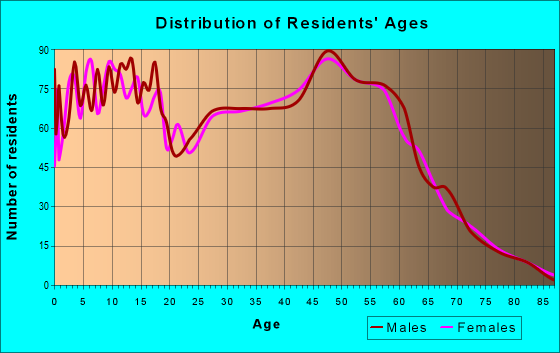
Median resident age:
This zip code:
36.0 years
Missouri median age:
39.1 years
Average household size:
This zip code:
2.7 people
Missouri:
2.4 people
Averages for the 2020 tax year for zip code 63012, filed in 2021:
Average Adjusted Gross Income (AGI) in 2020: $66,386 (Individual Income Tax Returns)
Here:
$66,386
State:
$68,151
Salary/wage: $59,821 (reported on 84.9% of returns)
Here:
$59,821
State:
$56,131
(% of AGI for various income ranges: 1205.7% for AGIs below $25k, 3507.7% for AGIs $25k-50k, 6428.3% for AGIs $50k-75k, 9689.6% for AGIs $75k-100k, 17042.1% for AGIs $100k-200k, 61328.0% for AGIs over 200k)
Taxable interest for individuals: $787 (reported on 30.1% of returns)
This zip code:
$787
Missouri:
$1,586
(% of AGI for various income ranges: 12.4% for AGIs below $25k, 16.7% for AGIs $25k-50k, 26.3% for AGIs $50k-75k, 50.2% for AGIs $75k-100k, 50.5% for AGIs $100k-200k, 496.0% for AGIs over 200k)
Ordinary dividends: $3,028 (reported on 17.6% of returns)
Here:
$3,028
State:
$10,947
(% of AGI for various income ranges: 22.6% for AGIs below $25k, 32.2% for AGIs $25k-50k, 59.4% for AGIs $50k-75k, 77.3% for AGIs $75k-100k, 141.7% for AGIs $100k-200k, 1298.0% for AGIs over 200k)
Net capital gain/loss in AGI: +$6,164 (reported on 14.4% of returns)
Here:
+$6,164
State:
+$18,453
(% of AGI for various income ranges: 9.1% for AGIs below $25k, 23.4% for AGIs $25k-50k, 38.3% for AGIs $50k-75k, 118.9% for AGIs $75k-100k, 263.8% for AGIs $100k-200k, 3852.0% for AGIs over 200k)
Profit/loss from business: +$10,405 (reported on 12.1% of returns)
Here:
+$10,405
State:
+$12,260
(% of AGI for various income ranges: 61.3% for AGIs below $25k, 150.0% for AGIs $25k-50k, 186.5% for AGIs $50k-75k, 137.1% for AGIs $75k-100k, 293.8% for AGIs $100k-200k, 1846.0% for AGIs over 200k)
Taxable individual retirement arrangement distribution: $21,896 (reported on 8.5% of returns)
63012:
$21,896
Missouri:
$19,719
(% of AGI for various income ranges: 53.4% for AGIs below $25k, 81.8% for AGIs $25k-50k, 190.6% for AGIs $50k-75k, 324.0% for AGIs $75k-100k, 926.2% for AGIs $100k-200k)
Total itemized deductions: $29,176 (reported on 5.5% of returns)
Here:
$29,176
State:
$36,651
(% of AGI for various income ranges: 107.3% for AGIs $25k-50k, 142.2% for AGIs $50k-75k, 271.8% for AGIs $75k-100k, 477.9% for AGIs $100k-200k, 4624.0% for AGIs over 200k)
Charity contributions: $8,841 (reported on 4.2% of returns)
Here:
$8,841
State:
$15,671
(% of AGI for various income ranges: 5.2% for AGIs below $25k, 20.8% for AGIs $50k-75k, 36.9% for AGIs $75k-100k, 126.8% for AGIs $100k-200k, 1584.0% for AGIs over 200k)
Taxes paid: $7,297 (reported on 5.5% of returns)
63012:
$7,297
State:
$7,608
(% of AGI for various income ranges: 12.9% for AGIs $25k-50k, 35.6% for AGIs $50k-75k, 82.4% for AGIs $75k-100k, 143.8% for AGIs $100k-200k, 984.0% for AGIs over 200k)
Earned income credit: $2,172 (reported on 11.3% of returns)
Here:
$2,172
State:
$2,315
(% of AGI for various income ranges: 62.7% for AGIs below $25k, 65.3% for AGIs $25k-50k)
Percentage of individuals using paid preparers for their 2020 taxes: 93.4%
Here:
93%
State:
93%
(% for various income ranges: 93.2% for AGIs below $25k, 92.4% for AGIs $25k-50k, 91.8% for AGIs $50k-75k, 95.3% for AGIs $75k-100k, 94.9% for AGIs $100k-200k, 93.8% for AGIs over 200k)
Averages for the 2012 tax year for zip code 63012, filed in 2013:
Average Adjusted Gross Income (AGI) in 2012: $54,631 (Individual Income Tax Returns)
Here:
$54,631
State:
$55,896
Salary/wage: $48,847 (reported on 88.4% of returns)
Here:
$48,847
State:
$46,205
(% of AGI for various income ranges: 78.1% for AGIs below $25k, 79.3% for AGIs $25k-50k, 82.1% for AGIs $50k-75k, 83.2% for AGIs $75k-100k, 80.6% for AGIs $100k-200k, 57.2% for AGIs over 200k)
Taxable interest for individuals: $851 (reported on 32.5% of returns)
This zip code:
$851
Missouri:
$1,559
(% of AGI for various income ranges: 0.8% for AGIs below $25k, 0.6% for AGIs $25k-50k, 0.6% for AGIs $50k-75k, 0.2% for AGIs $75k-100k, 0.5% for AGIs $100k-200k, 0.9% for AGIs over 200k)
Ordinary dividends: $2,123 (reported on 18.6% of returns)
Here:
$2,123
State:
$7,410
(% of AGI for various income ranges: 0.9% for AGIs below $25k, 0.7% for AGIs $25k-50k, 0.5% for AGIs $50k-75k, 0.3% for AGIs $75k-100k, 0.6% for AGIs $100k-200k, 2.6% for AGIs over 200k)
Net capital gain/loss in AGI: +$3,167 (reported on 12.4% of returns)
Here:
+$3,167
State:
+$11,579
(% of AGI for various income ranges: 0.3% for AGIs $25k-50k, 0.8% for AGIs $100k-200k, 4.9% for AGIs over 200k)
Profit/loss from business: +$9,679 (reported on 12.0% of returns)
Here:
+$9,679
State:
+$11,688
(% of AGI for various income ranges: 5.5% for AGIs below $25k, 2.7% for AGIs $25k-50k, 1.0% for AGIs $50k-75k, 1.2% for AGIs $75k-100k, 2.9% for AGIs $100k-200k)
Taxable individual retirement arrangement distribution: $15,093 (reported on 8.7% of returns)
63012:
$15,093
Missouri:
$14,773
(% of AGI for various income ranges: 3.0% for AGIs below $25k, 1.8% for AGIs $25k-50k, 2.1% for AGIs $50k-75k, 2.4% for AGIs $75k-100k, 3.4% for AGIs $100k-200k)
Total itemized deductions: $18,241 (21% of AGI, reported on 37.7% of returns)
Here:
$18,241
State:
$22,730
Here:
20.5% of AGI
State:
19.2% of AGI
(% of AGI for various income ranges: 8.3% for AGIs below $25k, 10.1% for AGIs $25k-50k, 13.7% for AGIs $50k-75k, 12.8% for AGIs $75k-100k, 14.3% for AGIs $100k-200k, 11.5% for AGIs over 200k)
Charity contributions: $2,533 (reported on 28.6% of returns)
Here:
$2,533
State:
$4,745
(% of AGI for various income ranges: 0.6% for AGIs below $25k, 0.9% for AGIs $25k-50k, 1.4% for AGIs $50k-75k, 1.3% for AGIs $75k-100k, 1.5% for AGIs $100k-200k, 2.0% for AGIs over 200k)
Taxes paid: $6,136 (reported on 37.7% of returns)
63012:
$6,136
State:
$8,399
(% of AGI for various income ranges: 1.4% for AGIs below $25k, 2.4% for AGIs $25k-50k, 3.8% for AGIs $50k-75k, 4.4% for AGIs $75k-100k, 5.6% for AGIs $100k-200k, 5.4% for AGIs over 200k)
Earned income credit: $2,160 (reported on 13.5% of returns)
Here:
$2,160
State:
$2,288
(% of AGI for various income ranges: 5.0% for AGIs below $25k, 1.0% for AGIs $25k-50k)
Percentage of individuals using paid preparers for their 2012 taxes: 48.4%
Here:
48%
State:
55%
(% for various income ranges: 43.6% for AGIs below $25k, 47.7% for AGIs $25k-50k, 51.2% for AGIs $50k-75k, 54.2% for AGIs $75k-100k, 50.8% for AGIs $100k-200k, 71.4% for AGIs over 200k)
Averages for the 2004 tax year for zip code 63012, filed in 2005:
Average Adjusted Gross Income (AGI) in 2004: $47,437 (Individual Income Tax Returns)
Here:
$47,437
State:
$44,591
Salary/wage: $44,324 (reported on 91.5% of returns)
Here:
$44,324
State:
$38,941
(% of AGI for various income ranges: 126.0% for AGIs below $10k, 81.1% for AGIs $10k-25k, 85.5% for AGIs $25k-50k, 89.1% for AGIs $50k-75k, 91.5% for AGIs $75k-100k, 74.9% for AGIs over 100k)
Taxable interest for individuals: $1,050 (reported on 42.8% of returns)
This zip code:
$1,050
Missouri:
$1,801
(% of AGI for various income ranges: 2.6% for AGIs below $10k, 1.0% for AGIs $10k-25k, 0.7% for AGIs $25k-50k, 0.9% for AGIs $50k-75k, 0.6% for AGIs $75k-100k, 1.4% for AGIs over 100k)
Taxable dividends: $1,050 (reported on 20.2% of returns)
Here:
$1,050
State:
$3,677
(% of AGI for various income ranges: 1.6% for AGIs below $10k, 0.7% for AGIs $10k-25k, 0.5% for AGIs $25k-50k, 0.3% for AGIs $50k-75k, 0.3% for AGIs $75k-100k, 0.6% for AGIs over 100k)
Net capital gain/loss: +$5,552 (reported on 14.5% of returns)
Here:
+$5,552
State:
+$8,915
(% of AGI for various income ranges: -0.4% for AGIs below $10k, -0.2% for AGIs $10k-25k, 0.3% for AGIs $25k-50k, 0.3% for AGIs $50k-75k, 0.1% for AGIs $75k-100k, 6.4% for AGIs over 100k)
Profit/loss from business: +$7,853 (reported on 13.0% of returns)
Here:
+$7,853
State:
+$9,793
(% of AGI for various income ranges: 5.4% for AGIs below $10k, 4.5% for AGIs $10k-25k, 2.3% for AGIs $25k-50k, 2.5% for AGIs $50k-75k, 1.1% for AGIs $75k-100k, 1.9% for AGIs over 100k)
IRA payment deduction: $2,929 (reported on 2.1% of returns)
63012:
$2,929
Missouri:
$2,972
(% of AGI for various income ranges: 0.9% for AGIs below $10k, 0.2% for AGIs $25k-50k, 0.1% for AGIs $50k-75k, 0.1% for AGIs $75k-100k, 0.1% for AGIs over 100k)
Self-employed pension: $7,583 (reported on 0.3% of returns)
Here:
$7,583
Missouri:
$14,365
Total itemized deductions: $15,520 (21% of AGI, reported on 43.2% of returns)
Here:
$15,520
State:
$18,261
Here:
21.0% of AGI
State:
20.5% of AGI
(% of AGI for various income ranges: 5.5% for AGIs below $10k, 8.0% for AGIs $10k-25k, 13.3% for AGIs $25k-50k, 15.3% for AGIs $50k-75k, 15.6% for AGIs $75k-100k, 14.2% for AGIs over 100k)
Charity contributions deductions: $2,062 (3% of AGI, reported on 36.3% of returns)
Here:
$2,062
State:
$3,665
Here:
2.7% of AGI
State:
3.9% of AGI
(% of AGI for various income ranges: 0.6% for AGIs below $10k, 0.9% for AGIs $10k-25k, 1.2% for AGIs $25k-50k, 1.6% for AGIs $50k-75k, 1.7% for AGIs $75k-100k, 1.9% for AGIs over 100k)
Total tax: $5,636 (reported on 81.3% of returns)
63012:
$5,636
State:
$6,999
(% of AGI for various income ranges: 3.7% for AGIs below $10k, 4.7% for AGIs $10k-25k, 6.5% for AGIs $25k-50k, 8.0% for AGIs $50k-75k, 9.9% for AGIs $75k-100k, 15.3% for AGIs over 100k)
Earned income credit: $1,633 (reported on 9.7% of returns)
Here:
$1,633
State:
$1,728
Percentage of individuals using paid preparers for their 2004 taxes: 53.8%
Here:
54%
State:
62%
(% for various income ranges: 42.4% for AGIs below $10k, 52.5% for AGIs $10k-25k, 55.5% for AGIs $25k-50k, 59.7% for AGIs $50k-75k, 53.6% for AGIs $75k-100k, 61.1% for AGIs over 100k)
Household received Food Stamps/SNAP in the past 12 months: 221 Household did not receive Food Stamps/SNAP in the past 12 months: 3,717
Women who had a birth in the past 12 months: 103 (88 now married, 12 unmarried) Women who did not have a birth in the past 12 months: 2,578 (1,174 now married, 1,402 unmarried)
Housing units in zip code 63012 with a mortgage: 2,571 (347 second mortgage, 325 both second mortgage and home equity loan) Houses without a mortgage: 53
Median monthly owner costs for units with a mortgage: $1,470 Median monthly owner costs for units without a mortgage: $545
Residents with income below the poverty level in 2022:
This zip code:
5.6%
Whole state:
13.2%
Residents with income below 50% of the poverty level in 2022:
This zip code:
1.7%
Whole state:
6.8%
Median number of rooms in houses and condos:
Here:
6.3
State:
6.4
Median number of rooms in apartments:
Here:
5.7
State:
4.4
Notable locations in this zip code not listed on our city pages
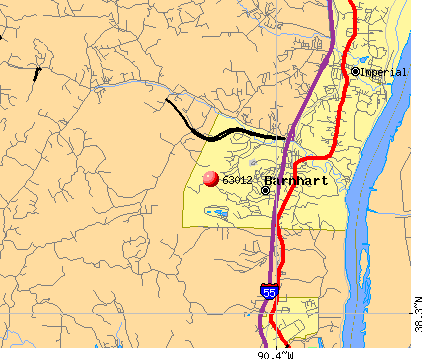
Notable locations in zip code 63012: Camp Cedar Ledge (A), Antonia Fire Protection District Station 3 (B), Antonia Fire Protection District Station 2 (C). Display/hide their locations on the map
In group quarters: 69 (-1 institutionalized population)
Size of family households: 1,398 2-persons, 768 3-persons, 654 4-persons, 198 5-persons, 115 6-persons, 30 7-or-more-persons
Size of nonfamily households: 572 1-person, 163 2-persons, 12 3-persons
1,233 married couples with children.
1,045 single-parent households (385 men, 660 women).
97.2% of residents of 63012 zip code speak English at home.
0.4% of residents speak Spanish at home (100% very well).
2.0% of residents speak other Indo-European language at home (100% very well).
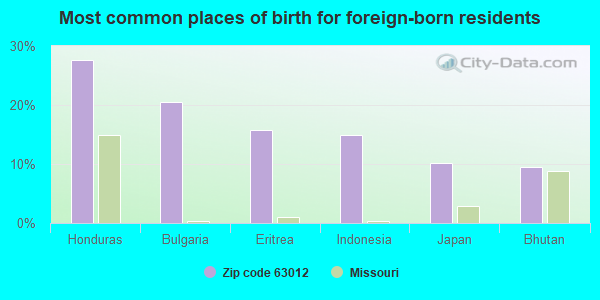
Foreign born population: 127 (1.2%) (100.0% of them are naturalized citizens)
This zip code:
1.2%
Whole state:
4.1%
28%Honduras
20%Bulgaria
16%Eritrea
15%Indonesia
10%Japan
9%Bhutan
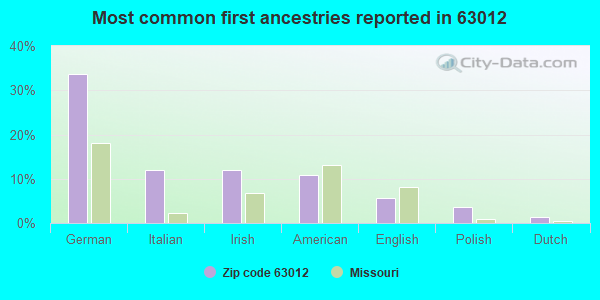
34%German
12%Italian
12%Irish
11%American
6%English
4%Polish
1%Dutch
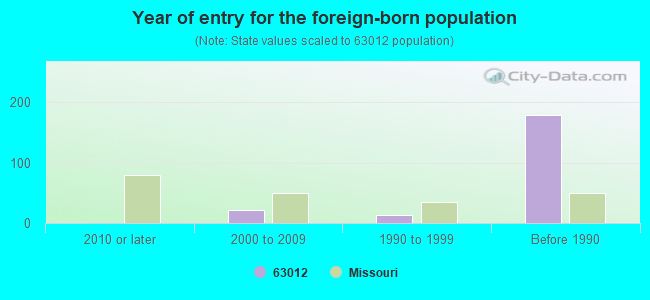
Year of entry for the foreign-born population
02010 or later
212000 to 2009
141990 to 1999
179Before 1990
Major facilities with environmental interests located in this zip code:
HOME SERVICE OIL COMPANY (6910 FRONT STREET in BARNHART, MO)
AIR SYNTHETIC MINOR (AIRS/AFS) AIR MINOR (AIRS/AFS) STATE MASTER (Missouri monitoring and compilance) - AIRS/AFS-MO0061737, AIR SYNTHETIC MINOR, AIRS/AFS-MO0806589, AIR MINOR, RCRAINFO-MOR000042135, NOT IN A UNIVERSE, PCS-MOR109269, NPDES NON-MAJOR (Resource Conservation and Recovery Act (tracking hazardous waste)) Business SIC classification: HEAVY CONSTRUCTION; PETROLEUM BULK STATIONS AND TERMINALS
AMERICAN HERITAGE LND DEV (I-55 & MORGAN RD in BARNHART, MO)
STATE MASTER (Missouri monitoring and compilance) - PCS-MOR106098, NPDES NON-MAJOR National Pollutant Discharge Elimination System NON-MAJOR (Tracking pollutant discharge elimination systems) - permit Business SIC classification: HEAVY CONSTRUCTION Alternative names: AMERICAN HERITAGE LAND DE, HUNTERS GLEN
BARNHART WEIGH STA (I55 S 184 MI MARKER in BARNHART, MO)
STATE MASTER (Missouri monitoring and compilance) - RCRAINFO-MOP000024190, NOT IN A UNIVERSE (Resource Conservation and Recovery Act (tracking hazardous waste)) Organizations: MO STATE HIGHWAY PATROL (CONTACT/OWNER)
BRAY CO (6921 FRONT ST in BARNHART, MO)
STATE MASTER (Missouri monitoring and compilance) - RCRAINFO-MOR000001925, CESQG, RCRAINFO-MOR000003525, Conditionally Exempt Small Quantity Generators, less than 100 kg/month of hazardous waste (Resource Conservation and Recovery Act (tracking hazardous waste)) Conditionally Exempt Small Quantity Generators, less than 100 kg/month of hazardous waste (Resource Conservation and Recovery Act (tracking hazardous waste)) - notification Organizations: NA (CONTACT/OWNER)
, JOHN D BRAY (CONTACT/OWNER)
Alternative names: GENERAL VINYLS DBA BRAY CO
EXPRESS MART BARNHART (7037 HWY 61-67 in BARNHART, MO)
STATE MASTER (Missouri monitoring and compilance) - RCRAINFO-MOP000034793, NOT IN A UNIVERSE (Resource Conservation and Recovery Act (tracking hazardous waste)) Organizations: HOME SERVICE OIL CO (CONTACT/OWNER)
ATLAS CASTING COMPANY (ROUTE 2, BOX 33 VALLEY DRIVE in BARNHART, MO)
AIR MINOR (AIRS/AFS) STATE MASTER (Missouri monitoring and compilance) - AIRS/AFS-MO0806426, AIR MINOR
C C ENTERPRISES INC (HWY M & I55 in BARNHART, MO)
STATE MASTER (Missouri monitoring and compilance) - RCRAINFO-MOD000677203, NOT IN A UNIVERSE (Resource Conservation and Recovery Act (tracking hazardous waste))
7 ELEVEN STORE 29212 (1700 HWY M in BARNHART, MO)
STATE MASTER (Missouri monitoring and compilance) - RCRAINFO-MOR000022228, SQG Small Quantity Generators, between 100 kg and 1000 kg of hazardous waste/month (Resource Conservation and Recovery Act (tracking hazardous waste)) - notification Business SIC classification: GASOLINE SERVICE STATIONS Organizations: 7 ELEVEN INC (CONTACT/OWNER)
GLAIZE CRK SEW DIST (#1 SULPHUR SPRINGS ROAD in BARNHART, MO)
STATE MASTER (Missouri monitoring and compilance) - PCS-MO0056162, NPDES MAJOR National Pollutant Discharge Elimination System MAJOR (Tracking pollutant discharge elimination systems) - permit Business SIC classification: SEWERAGE SYSTEMS Organizations: GLAIZE CREEK SEWER DISTRI (CONTACT/OWNER)
Alternative names: GLAIZE CREEK SEWER DISTRI
JAMES E. FREER ELEM. (1800 HANOVER in BARNHART, MO)
(National Center for Education Statistics) - STATE ID-4040050010 Organizations: WINDSOR C-1 (SCHOOL DISTRICT)
ALTMANN HOMES (N OF OLD HWY 21 & SCHENK in BARNHART, MO)
National Pollutant Discharge Elimination System NON-MAJOR (Tracking pollutant discharge elimination systems) - permit Business SIC classification: HEAVY CONSTRUCTION Alternative names: WILLOW BEND ESTATES
PARKTON ASSEMBLY OF GOD (HWY M in BARNHART, MO)
National Pollutant Discharge Elimination System NON-MAJOR (Tracking pollutant discharge elimination systems) - permit Business SIC classification: HEAVY CONSTRUCTION
HOME SERVICE OIL (SOUTER RD & MARIOTT PKWY in BARNHART, MO)
National Pollutant Discharge Elimination System NON-MAJOR (Tracking pollutant discharge elimination systems) - permit Business SIC classification: HEAVY CONSTRUCTION Alternative names: MCKENNA PROPERTY
Housing units lacking complete plumbing facilities: 1.9% Housing units lacking complete kitchen facilities: 1.9%
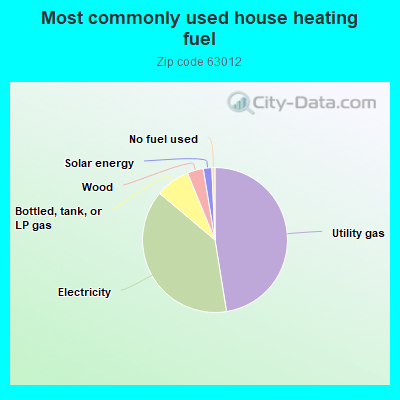
47.6%Utility gas
38.8%Electricity
7.7%Bottled, tank, or LP gas
3.6%Wood
1.9%Solar energy
0.7%No fuel used
Population in 1990: 7,689. Population change in the 1990s: +1,678 (+21.8%).
Place of birth for U.S.-born residents:
This state: 9,182
Northeast: 114
Midwest: 793
South: 292
West: 158
57% of the 63012 zip code residents lived in the same house 5 years ago. Out of people who lived in different houses, 49% lived in this county. Out of people who lived in different counties, 50% lived in Missouri.
89% of the 63012 zip code residents lived in the same house 1 year ago. Out of people who lived in different houses, 60% moved from this county. Out of people who lived in different houses, 28% moved from different county within same state. Out of people who lived in different houses, 8% moved from different state. Out of people who lived in different houses, 2% moved from abroad.
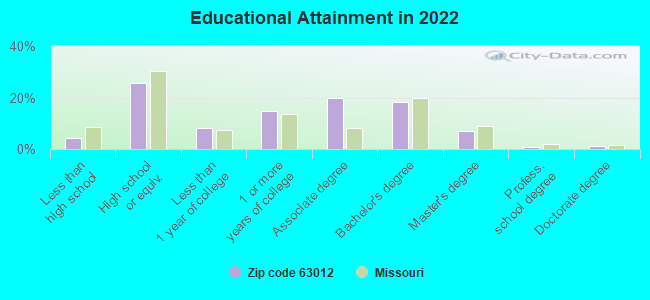
Private vs. public school enrollment:
Students in private schools in grades 1 to 8 (elementary and middle school): 153
Here:
15.7%
Missouri:
15.4%
Students in private schools in grades 9 to 12 (high school): 21
Here:
4.2%
Missouri:
13.9%
Students in private undergraduate colleges: 39
Here:
9.6%
Missouri:
22.6%
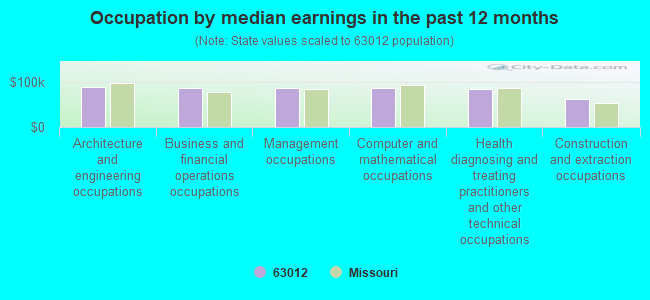
Occupation by median earnings in the past 12 months ($)
88,376Architecture and engineering occupations
87,120Business and financial operations occupations
86,969Management occupations
86,286Computer and mathematical occupations
85,448Health diagnosing and treating practitioners and other technical occupations
63,114Construction and extraction occupations
Companies with federal contracts located in this zip code:
FHE SERVICE (3180 ROCKIN V LANE in BARNHART, MO; small business) : $44,947 in 2 contractsfrom 2004 to 2005
$23,993 with Defense Finance and Accounting Service for Office Supplies. Taking place in IN. Signed on 2005-10-01. Completion date: 2005-11-01.
$20,954 with Defense Finance and Accounting Service for ADP Supplies. Taking place in IN. Signed on 2004-11-19. Completion date: 2004-12-15.
Top industries in this zip code by the number of employees in 2005:
Other Services (except Public Administration): Commercial and Industrial Machinery and Equipment (except Automotive and Electronic) Repair and Maintenance (20-49: 1)
Health Care and Social Assistance: Home Health Care Services (20-49: 1)
Accommodation and Food Services: Limited-Service Restaurants (20-49: 1)
People in group quarters in 2000:
34 people in nursing homes
34 people in religious group quarters
23 people in other noninstitutional group quarters
Fatal accident statistics in 2012:
Fatal accident count: 1
Vehicles involved in fatal accidents: 1
Fatal accidents caused by drunken drivers: 0
Fatalities: 1
Persons involved in fatal accidents: 1
Pedestrians involved in fatal accidents: 0
Fatal accident statistics in 2010:
Fatal accident count: 3
Vehicles involved in fatal accidents: 4
Fatal accidents caused by drunken drivers: 2
Fatalities: 3
Persons involved in fatal accidents: 4
Pedestrians involved in fatal accidents: 0
Home Mortgage Disclosure Act Aggregated Statistics For Year 2009 (Based on 2 full and 4 partial tracts)
A) FHA, FSA/RHS & VA Home Purchase Loans
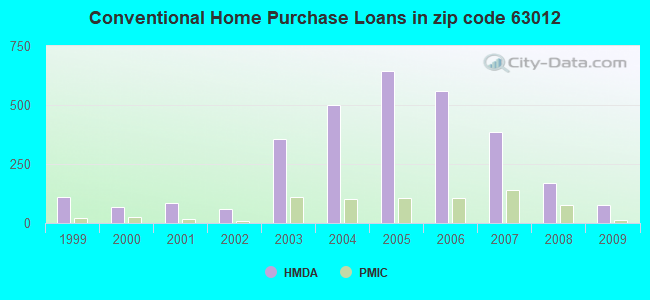
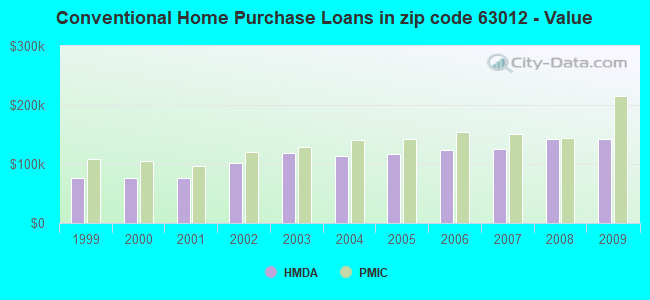
B) Conventional Home Purchase Loans
C) Refinancings
D) Home Improvement Loans
F) Non-occupant Loans on < 5 Family Dwellings (A B C & D)
G) Loans On Manufactured Home Dwelling (A B C & D)
Number
Average Value
Number
Average Value
Number
Average Value
Number
Average Value
Number
Average Value
Number
Average Value
LOANS ORIGINATED
163
$143,047
78
$142,320
813
$147,801
32
$42,340
15
$100,074
7
$83,064
APPLICATIONS APPROVED, NOT ACCEPTED
1
$130,570
11
$84,095
74
$148,722
3
$64,673
2
$115,925
3
$29,840
APPLICATIONS DENIED
14
$158,497
13
$112,738
256
$146,230
27
$11,453
14
$68,225
14
$54,849
APPLICATIONS WITHDRAWN
19
$120,721
11
$115,924
172
$140,497
9
$77,694
3
$56,157
3
$105,393
FILES CLOSED FOR INCOMPLETENESS
1
$94,380
0
$0
46
$148,865
4
$52,490
0
$0
1
$113,830
Aggregated Statistics For Year 2008 (Based on 2 full and 4 partial tracts)
A) FHA, FSA/RHS & VA Home Purchase Loans
B) Conventional Home Purchase Loans
C) Refinancings
D) Home Improvement Loans
E) Loans on Dwellings For 5+ Families
F) Non-occupant Loans on < 5 Family Dwellings (A B C & D)
G) Loans On Manufactured Home Dwelling (A B C & D)
Number
Average Value
Number
Average Value
Number
Average Value
Number
Average Value
Number
Average Value
Number
Average Value
Number
Average Value
LOANS ORIGINATED
136
$145,088
171
$142,568
536
$149,933
73
$50,823
1
$426,870
36
$114,645
9
$81,433
APPLICATIONS APPROVED, NOT ACCEPTED
6
$146,893
15
$147,731
63
$142,457
11
$49,146
0
$0
4
$60,325
5
$56,744
APPLICATIONS DENIED
26
$125,388
27
$96,364
243
$156,286
64
$45,605
0
$0
3
$90,513
10
$57,597
APPLICATIONS WITHDRAWN
17
$140,994
20
$198,374
103
$161,182
9
$130,386
0
$0
4
$77,202
1
$7,200
FILES CLOSED FOR INCOMPLETENESS
8
$170,428
4
$162,228
31
$151,879
3
$20,733
0
$0
2
$107,235
0
$0
Aggregated Statistics For Year 2007 (Based on 2 full and 4 partial tracts)
A) FHA, FSA/RHS & VA Home Purchase Loans
B) Conventional Home Purchase Loans
C) Refinancings
D) Home Improvement Loans
E) Loans on Dwellings For 5+ Families
F) Non-occupant Loans on < 5 Family Dwellings (A B C & D)
G) Loans On Manufactured Home Dwelling (A B C & D)
Number
Average Value
Number
Average Value
Number
Average Value
Number
Average Value
Number
Average Value
Number
Average Value
Number
Average Value
LOANS ORIGINATED
46
$144,755
386
$124,734
620
$127,975
95
$39,195
1
$34,320
29
$96,678
19
$55,979
APPLICATIONS APPROVED, NOT ACCEPTED
2
$236,740
40
$107,148
120
$132,188
12
$39,606
0
$0
3
$64,047
9
$48,800
APPLICATIONS DENIED
13
$135,914
45
$87,774
409
$138,542
120
$51,326
0
$0
9
$83,949
17
$55,546
APPLICATIONS WITHDRAWN
9
$149,244
36
$113,690
192
$136,929
20
$98,684
0
$0
6
$90,182
3
$48,487
FILES CLOSED FOR INCOMPLETENESS
0
$0
10
$117,670
55
$137,862
4
$80,290
0
$0
0
$0
0
$0
Aggregated Statistics For Year 2006 (Based on 2 full and 4 partial tracts)
A) FHA, FSA/RHS & VA Home Purchase Loans
B) Conventional Home Purchase Loans
C) Refinancings
D) Home Improvement Loans
F) Non-occupant Loans on < 5 Family Dwellings (A B C & D)
G) Loans On Manufactured Home Dwelling (A B C & D)
Number
Average Value
Number
Average Value
Number
Average Value
Number
Average Value
Number
Average Value
Number
Average Value
LOANS ORIGINATED
57
$149,485
558
$124,336
716
$119,879
106
$42,162
84
$92,702
20
$63,550
APPLICATIONS APPROVED, NOT ACCEPTED
0
$0
110
$95,574
143
$133,150
17
$44,665
8
$86,375
16
$48,979
APPLICATIONS DENIED
10
$136,421
130
$100,685
424
$133,730
92
$46,329
20
$88,900
47
$58,399
APPLICATIONS WITHDRAWN
3
$155,403
54
$111,974
235
$126,602
36
$79,464
11
$68,683
4
$111,552
FILES CLOSED FOR INCOMPLETENESS
0
$0
9
$140,108
77
$142,488
4
$129,225
0
$0
0
$0
Aggregated Statistics For Year 2005 (Based on 2 full and 4 partial tracts)
A) FHA, FSA/RHS & VA Home Purchase Loans
B) Conventional Home Purchase Loans
C) Refinancings
D) Home Improvement Loans
E) Loans on Dwellings For 5+ Families
F) Non-occupant Loans on < 5 Family Dwellings (A B C & D)
G) Loans On Manufactured Home Dwelling (A B C & D)
Number
Average Value
Number
Average Value
Number
Average Value
Number
Average Value
Number
Average Value
Number
Average Value
Number
Average Value
LOANS ORIGINATED
91
$137,949
645
$117,278
907
$118,500
88
$66,720
1
$462,860
96
$96,323
25
$71,655
APPLICATIONS APPROVED, NOT ACCEPTED
2
$101,975
107
$96,685
169
$113,370
31
$34,145
0
$0
8
$75,012
20
$34,958
APPLICATIONS DENIED
8
$99,305
134
$90,363
423
$123,340
96
$55,899
0
$0
25
$72,723
40
$38,517
APPLICATIONS WITHDRAWN
6
$148,733
81
$115,106
366
$133,670
38
$109,665
0
$0
20
$93,591
4
$116,552
FILES CLOSED FOR INCOMPLETENESS
1
$87,180
12
$134,848
53
$135,868
2
$19,860
0
$0
1
$124,710
0
$0
Aggregated Statistics For Year 2004 (Based on 2 full and 4 partial tracts)
A) FHA, FSA/RHS & VA Home Purchase Loans
B) Conventional Home Purchase Loans
C) Refinancings
D) Home Improvement Loans
E) Loans on Dwellings For 5+ Families
F) Non-occupant Loans on < 5 Family Dwellings (A B C & D)
G) Loans On Manufactured Home Dwelling (A B C & D)
Number
Average Value
Number
Average Value
Number
Average Value
Number
Average Value
Number
Average Value
Number
Average Value
Number
Average Value
LOANS ORIGINATED
109
$128,609
499
$113,322
943
$119,789
55
$50,407
1
$204,750
44
$95,370
26
$62,040
APPLICATIONS APPROVED, NOT ACCEPTED
4
$91,640
61
$95,774
166
$104,231
15
$31,118
0
$0
11
$62,078
19
$55,541
APPLICATIONS DENIED
16
$108,746
98
$93,168
416
$120,465
69
$48,088
2
$248,225
17
$76,875
50
$41,515
APPLICATIONS WITHDRAWN
8
$132,875
43
$124,048
290
$115,218
13
$38,808
0
$0
12
$114,962
2
$59,315
FILES CLOSED FOR INCOMPLETENESS
2
$150,185
18
$154,883
48
$125,703
5
$35,120
0
$0
4
$69,782
2
$96,675
Aggregated Statistics For Year 2003 (Based on 2 full and 4 partial tracts)
A) FHA, FSA/RHS & VA Home Purchase Loans
B) Conventional Home Purchase Loans
C) Refinancings
D) Home Improvement Loans
E) Loans on Dwellings For 5+ Families
F) Non-occupant Loans on < 5 Family Dwellings (A B C & D)
Number
Average Value
Number
Average Value
Number
Average Value
Number
Average Value
Number
Average Value
Number
Average Value
LOANS ORIGINATED
92
$117,198
356
$117,954
1,816
$110,262
60
$21,049
2
$80,630
49
$85,409
APPLICATIONS APPROVED, NOT ACCEPTED
8
$113,984
39
$98,091
190
$112,658
18
$27,968
0
$0
7
$70,054
APPLICATIONS DENIED
16
$112,906
59
$74,744
414
$110,384
44
$24,143
0
$0
8
$120,440
APPLICATIONS WITHDRAWN
4
$142,960
42
$105,852
328
$112,239
12
$26,022
0
$0
4
$69,542
FILES CLOSED FOR INCOMPLETENESS
2
$122,125
9
$108,239
85
$111,167
4
$13,405
0
$0
5
$82,078
Aggregated Statistics For Year 2002 (Based on 2 partial tracts)
A) FHA, FSA/RHS & VA Home Purchase Loans
B) Conventional Home Purchase Loans
C) Refinancings
D) Home Improvement Loans
F) Non-occupant Loans on < 5 Family Dwellings (A B C & D)
Number
Average Value
Number
Average Value
Number
Average Value
Number
Average Value
Number
Average Value
LOANS ORIGINATED
14
$99,518
59
$101,927
147
$111,254
7
$14,739
7
$64,556
APPLICATIONS APPROVED, NOT ACCEPTED
0
$0
11
$103,683
28
$65,984
3
$88,777
2
$59,585
APPLICATIONS DENIED
0
$0
34
$46,482
49
$77,548
7
$10,969
1
$53,590
APPLICATIONS WITHDRAWN
1
$59,190
9
$98,464
33
$104,338
5
$19,676
0
$0
FILES CLOSED FOR INCOMPLETENESS
0
$0
2
$75,580
6
$90,910
0
$0
0
$0
Aggregated Statistics For Year 2001 (Based on 2 partial tracts)
A) FHA, FSA/RHS & VA Home Purchase Loans
B) Conventional Home Purchase Loans
C) Refinancings
D) Home Improvement Loans
F) Non-occupant Loans on < 5 Family Dwellings (A B C & D)
Number
Average Value
Number
Average Value
Number
Average Value
Number
Average Value
Number
Average Value
LOANS ORIGINATED
16
$77,331
83
$75,788
131
$104,200
6
$13,730
12
$49,854
APPLICATIONS APPROVED, NOT ACCEPTED
1
$56,790
14
$53,929
22
$83,761
2
$13,595
1
$51,990
APPLICATIONS DENIED
3
$71,183
40
$37,111
69
$73,813
13
$15,258
5
$36,150
APPLICATIONS WITHDRAWN
4
$107,372
4
$91,978
35
$87,498
1
$8,000
0
$0
FILES CLOSED FOR INCOMPLETENESS
0
$0
1
$43,190
3
$77,047
0
$0
0
$0
Aggregated Statistics For Year 2000 (Based on 2 partial tracts)
A) FHA, FSA/RHS & VA Home Purchase Loans
B) Conventional Home Purchase Loans
C) Refinancings
D) Home Improvement Loans
E) Loans on Dwellings For 5+ Families
F) Non-occupant Loans on < 5 Family Dwellings (A B C & D)
Number
Average Value
Number
Average Value
Number
Average Value
Number
Average Value
Number
Average Value
Number
Average Value
LOANS ORIGINATED
35
$76,781
69
$75,796
59
$80,116
12
$15,862
1
$79,980
8
$48,388
APPLICATIONS APPROVED, NOT ACCEPTED
10
$38,870
20
$65,944
15
$85,685
6
$17,195
0
$0
2
$47,590
APPLICATIONS DENIED
15
$37,111
43
$39,079
38
$66,510
8
$10,798
0
$0
3
$47,987
APPLICATIONS WITHDRAWN
2
$56,385
2
$87,580
22
$55,695
2
$25,195
0
$0
1
$97,580
FILES CLOSED FOR INCOMPLETENESS
0
$0
2
$65,585
3
$68,783
0
$0
0
$0
0
$0
Aggregated Statistics For Year 1999 (Based on 2 partial tracts)
A) FHA, FSA/RHS & VA Home Purchase Loans
B) Conventional Home Purchase Loans
C) Refinancings
D) Home Improvement Loans
F) Non-occupant Loans on < 5 Family Dwellings (A B C & D)
2002 - 2018 National Fire Incident Reporting System (NFIRS) incidents
According to the data from the years 2002 - 2018 the average number of fire incidents per year is 47. The highest number of fire incidents - 69 took place in 2007, and the least - 20 in 2002. The data has a growing trend.
When looking into fire subcategories, the most reports belonged to: Structure Fires (39.2%), and Outside Fires (38.5%).
Fire incident types reported to NFIRS in Zip Code 63012


 Nearest zip codes: 63057, 63052, 63070, 63053, 63048, 63010.
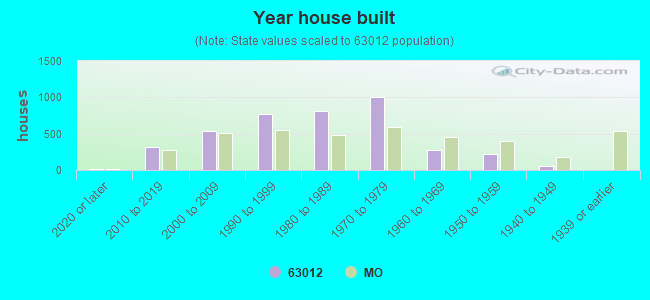


 According to the data from the years 2002 - 2018 the average number of fire incidents per year is 47. The highest number of fire incidents - 69 took place in 2007, and the least - 20 in 2002. The data has a growing trend.
 When looking into fire subcategories, the most reports belonged to: Structure Fires (39.2%), and Outside Fires (38.5%).