Estimated zip code population in 2022: 2,665 Zip code population in 2010: 3,002 Zip code population in 2000: 2,753
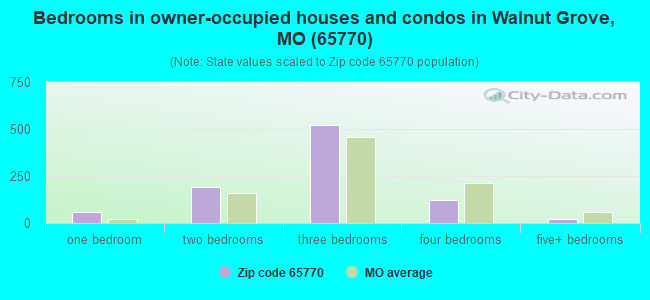
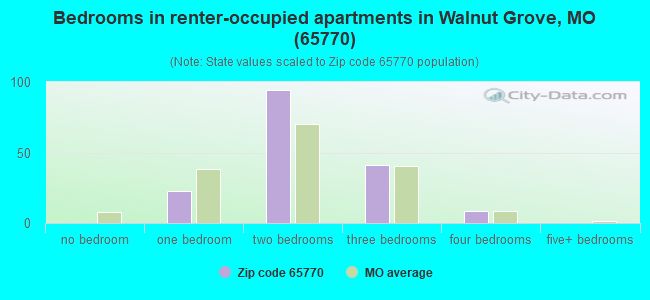
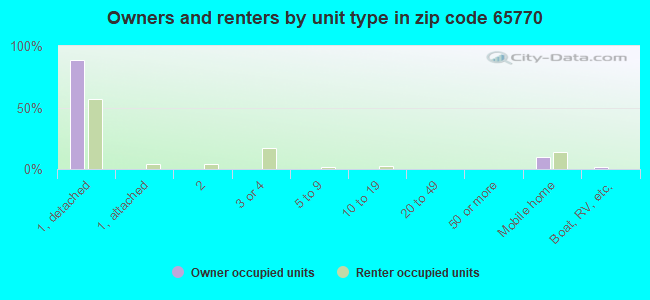
Houses and condos: 1,158 Renter-occupied apartments: 166
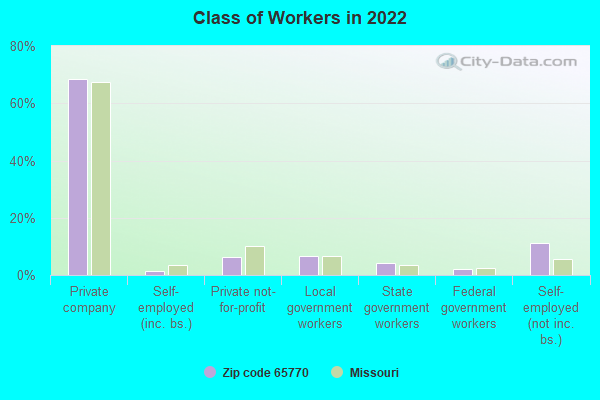
% of renters here:
15%
State:
32%
March 2022 cost of living index in zip code 65770: 76.8 (low, U.S. average is 100)
Land area: 99.9 sq. mi. Water area: 0.2 sq. mi.
Population density: 27 people per square mile
(very low).
OSM Map
General Map
Google Map
MSN Map
OSM Map
General Map
Google Map
MSN Map
OSM Map
General Map
Google Map
MSN Map
OSM Map
General Map
Google Map
MSN Map
Please wait while loading the map...
Real estate property taxes paid for housing units in 2022:
This zip code:
0.6% ($1,107)
Missouri:
0.8% ($1,810)
Median real estate property taxes paid for housing units with mortgages in 2022: $1,281 (0.6%) Median real estate property taxes paid for housing units with no mortgage in 2022: $965 (0.7%)
Business Search- 14 Million verified businesses
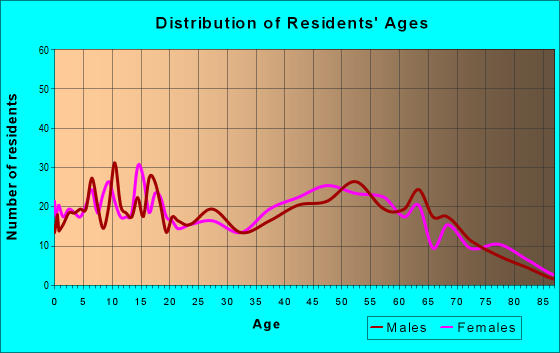
Males: 1,365
(51.2%)
Females: 1,299
(48.8%)
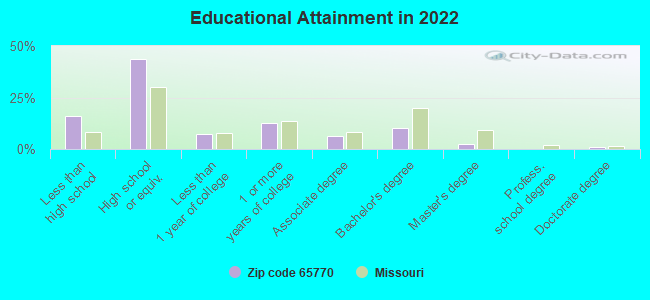
For population 25 years and over in 65770:
High school or higher: 82.8%
Bachelor's degree or higher: 13.7%
Graduate or professional degree: 3.7%
Unemployed: 2.6%
Mean travel time to work (commute): 33.0 minutes
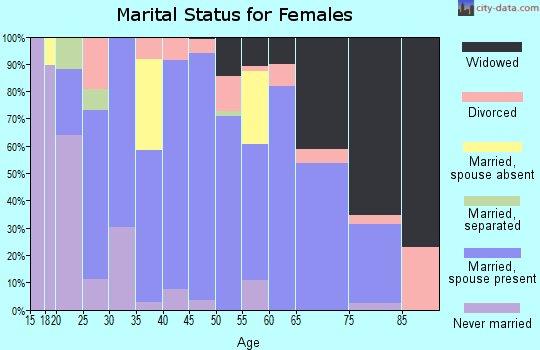
For population 15 years and over in 65770:
Never married: 19.7%
Now married: 66.0%
Separated: 1.5%
Widowed: 5.2%
Divorced: 7.6%
Zip code 65770 compared to state average:
Black race population percentage significantly below state average.
Hispanic race population percentage significantly below state average.
Median age above state average.
Foreign-born population percentage significantly below state average.
Renting percentage below state average.
Length of stay since moving in significantly above state average.
Percentage of population with a bachelor's degree or higher below state average.
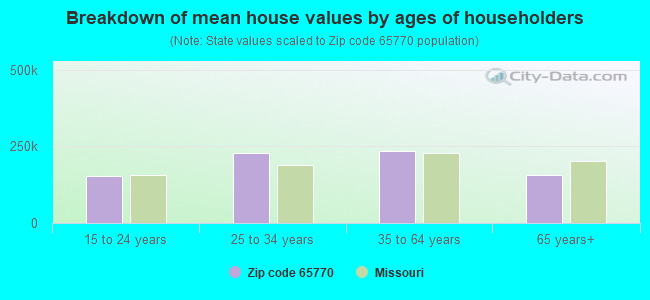
Estimated median house/condo value in 2022: $174,941
65770:
$174,941
Missouri:
$221,200
According to our research of Missouri and other state lists, there were 9 registered sex offenders living in 65770 zip code as of April 28, 2024. The ratio of all residents to sex offenders in zip code 65770 is 320 to 1. The ratio of registered sex offenders to all residents in this zip code is near the state average.
Median resident age:
This zip code:
43.9 years
Missouri median age:
39.1 years
Average household size:
This zip code:
2.4 people
Missouri:
2.4 people
Averages for the 2020 tax year for zip code 65770, filed in 2021:
Average Adjusted Gross Income (AGI) in 2020: $52,319 (Individual Income Tax Returns)
Here:
$52,319
State:
$68,151
Salary/wage: $48,770 (reported on 77.7% of returns)
Here:
$48,770
State:
$56,131
(% of AGI for various income ranges: 1276.3% for AGIs below $25k, 3739.2% for AGIs $25k-50k, 7070.6% for AGIs $50k-75k, 9720.9% for AGIs $75k-100k, 17445.6% for AGIs $100k-200k)
Taxable interest for individuals: $826 (reported on 30.9% of returns)
This zip code:
$826
Missouri:
$1,586
(% of AGI for various income ranges: 26.7% for AGIs below $25k, 25.0% for AGIs $25k-50k, 55.6% for AGIs $50k-75k, 42.7% for AGIs $75k-100k, 70.0% for AGIs $100k-200k)
Ordinary dividends: $2,732 (reported on 13.7% of returns)
Here:
$2,732
State:
$10,947
(% of AGI for various income ranges: 22.7% for AGIs below $25k, 32.7% for AGIs $25k-50k, 69.4% for AGIs $50k-75k, 101.8% for AGIs $75k-100k, 143.3% for AGIs $100k-200k)
Net capital gain/loss in AGI: +$9,295 (reported on 15.1% of returns)
Here:
+$9,295
State:
+$18,453
(% of AGI for various income ranges: 33.7% for AGIs below $25k, 57.7% for AGIs $25k-50k, 117.2% for AGIs $50k-75k, 279.1% for AGIs $75k-100k, 1314.4% for AGIs $100k-200k)
Profit/loss from business: +$10,021 (reported on 17.3% of returns)
Here:
+$10,021
State:
+$12,260
(% of AGI for various income ranges: 186.7% for AGIs below $25k, 198.1% for AGIs $25k-50k, 188.3% for AGIs $50k-75k, 236.4% for AGIs $75k-100k, 812.2% for AGIs $100k-200k)
Taxable individual retirement arrangement distribution: $22,209 (reported on 7.9% of returns)
65770:
$22,209
Missouri:
$19,719
(% of AGI for various income ranges: 127.3% for AGIs below $25k, 118.3% for AGIs $50k-75k, 423.6% for AGIs $75k-100k, 1535.6% for AGIs $100k-200k)
Total itemized deductions: $26,160 (reported on 3.6% of returns)
Here:
$26,160
State:
$36,651
(% of AGI for various income ranges: 382.8% for AGIs $50k-75k, 687.8% for AGIs $100k-200k)
Charity contributions: $9,425 (reported on 2.9% of returns)
Here:
$9,425
State:
$15,671
(% of AGI for various income ranges: 342.7% for AGIs $75k-100k)
Taxes paid: $5,760 (reported on 3.6% of returns)
65770:
$5,760
State:
$7,608
(% of AGI for various income ranges: 56.1% for AGIs $50k-75k, 207.8% for AGIs $100k-200k)
Earned income credit: $2,150 (reported on 17.3% of returns)
Here:
$2,150
State:
$2,315
(% of AGI for various income ranges: 105.0% for AGIs below $25k, 77.3% for AGIs $25k-50k)
Percentage of individuals using paid preparers for their 2020 taxes: 94.2%
Here:
94%
State:
93%
(% for various income ranges: 93.6% for AGIs below $25k, 94.1% for AGIs $25k-50k, 96.0% for AGIs $50k-75k, 94.1% for AGIs $75k-100k, 107.1% for AGIs $100k-200k, 0.0% for AGIs over 200k)
Averages for the 2012 tax year for zip code 65770, filed in 2013:
Average Adjusted Gross Income (AGI) in 2012: $41,671 (Individual Income Tax Returns)
Here:
$41,671
State:
$55,896
Salary/wage: $38,312 (reported on 80.2% of returns)
Here:
$38,312
State:
$46,205
(% of AGI for various income ranges: 67.9% for AGIs below $25k, 78.2% for AGIs $25k-50k, 79.7% for AGIs $50k-75k, 74.9% for AGIs $75k-100k, 62.6% for AGIs $100k-200k)
Taxable interest for individuals: $700 (reported on 37.3% of returns)
This zip code:
$700
Missouri:
$1,559
(% of AGI for various income ranges: 1.7% for AGIs below $25k, 0.5% for AGIs $25k-50k, 0.8% for AGIs $50k-75k, 0.2% for AGIs $75k-100k, 0.4% for AGIs $100k-200k)
Ordinary dividends: $1,720 (reported on 15.9% of returns)
Here:
$1,720
State:
$7,410
(% of AGI for various income ranges: 1.5% for AGIs below $25k, 0.6% for AGIs $25k-50k, 0.7% for AGIs $50k-75k, 0.2% for AGIs $75k-100k, 0.5% for AGIs $100k-200k)
Net capital gain/loss in AGI: +$4,995 (reported on 15.9% of returns)
Here:
+$4,995
State:
+$11,579
(% of AGI for various income ranges: 1.6% for AGIs below $25k, 1.6% for AGIs $25k-50k, 2.6% for AGIs $50k-75k, 3.2% for AGIs $100k-200k)
Profit/loss from business: +$8,196 (reported on 18.3% of returns)
Here:
+$8,196
State:
+$11,688
(% of AGI for various income ranges: 9.0% for AGIs below $25k, 4.4% for AGIs $25k-50k, 3.1% for AGIs $50k-75k, 3.8% for AGIs $75k-100k)
Taxable individual retirement arrangement distribution: $9,500 (reported on 10.3% of returns)
65770:
$9,500
Missouri:
$14,773
(% of AGI for various income ranges: 3.4% for AGIs below $25k, 1.6% for AGIs $25k-50k, 2.3% for AGIs $50k-75k, 5.6% for AGIs $75k-100k)
Total itemized deductions: $17,693 (25% of AGI, reported on 22.2% of returns)
Here:
$17,693
State:
$22,730
Here:
24.8% of AGI
State:
19.2% of AGI
(% of AGI for various income ranges: 5.5% for AGIs below $25k, 7.2% for AGIs $25k-50k, 8.7% for AGIs $50k-75k, 12.4% for AGIs $75k-100k, 12.7% for AGIs $100k-200k)
Charity contributions: $3,852 (reported on 16.7% of returns)
Here:
$3,852
State:
$4,745
(% of AGI for various income ranges: 1.3% for AGIs $25k-50k, 1.5% for AGIs $50k-75k, 2.4% for AGIs $75k-100k, 1.9% for AGIs $100k-200k)
Taxes paid: $4,157 (reported on 22.2% of returns)
65770:
$4,157
State:
$8,399
(% of AGI for various income ranges: 0.8% for AGIs below $25k, 1.1% for AGIs $25k-50k, 2.0% for AGIs $50k-75k, 2.8% for AGIs $75k-100k, 4.2% for AGIs $100k-200k)
Earned income credit: $2,164 (reported on 19.8% of returns)
Here:
$2,164
State:
$2,288
(% of AGI for various income ranges: 6.3% for AGIs below $25k, 1.3% for AGIs $25k-50k)
Percentage of individuals using paid preparers for their 2012 taxes: 67.5%
Here:
67%
State:
55%
(% for various income ranges: 61.2% for AGIs below $25k, 68.6% for AGIs $25k-50k, 73.9% for AGIs $50k-75k, 72.7% for AGIs $75k-100k, 75.0% for AGIs $100k-200k)
Averages for the 2004 tax year for zip code 65770, filed in 2005:
Average Adjusted Gross Income (AGI) in 2004: $32,484 (Individual Income Tax Returns)
Here:
$32,484
State:
$44,591
Salary/wage: $31,343 (reported on 82.8% of returns)
Here:
$31,343
State:
$38,941
(% of AGI for various income ranges: 83.1% for AGIs below $10k, 74.5% for AGIs $10k-25k, 86.8% for AGIs $25k-50k, 85.1% for AGIs $50k-75k, 76.2% for AGIs $75k-100k, 59.4% for AGIs over 100k)
Taxable interest for individuals: $1,117 (reported on 46.3% of returns)
This zip code:
$1,117
Missouri:
$1,801
(% of AGI for various income ranges: 8.3% for AGIs below $10k, 3.3% for AGIs $10k-25k, 1.6% for AGIs $25k-50k, 0.7% for AGIs $50k-75k, 0.9% for AGIs $75k-100k, 0.4% for AGIs over 100k)
Taxable dividends: $1,298 (reported on 16.6% of returns)
Here:
$1,298
State:
$3,677
(% of AGI for various income ranges: 2.4% for AGIs below $10k, 1.0% for AGIs $10k-25k, 0.7% for AGIs $25k-50k, 0.6% for AGIs $50k-75k, 0.3% for AGIs $75k-100k, 0.2% for AGIs over 100k)
Net capital gain/loss: +$3,922 (reported on 18.7% of returns)
Here:
+$3,922
State:
+$8,915
(% of AGI for various income ranges: 2.9% for AGIs below $10k, 1.8% for AGIs $10k-25k, 1.3% for AGIs $25k-50k, 2.1% for AGIs $50k-75k, 4.8% for AGIs $75k-100k, 3.4% for AGIs over 100k)
Profit/loss from business: +$8,948 (reported on 21.9% of returns)
Here:
+$8,948
State:
+$9,793
(% of AGI for various income ranges: 19.7% for AGIs below $10k, 8.1% for AGIs $10k-25k, 3.6% for AGIs $25k-50k, 2.6% for AGIs $50k-75k, 1.5% for AGIs $75k-100k, 17.6% for AGIs over 100k)
IRA payment deduction: $2,375 (reported on 1.9% of returns)
65770:
$2,375
Missouri:
$2,972
Total itemized deductions: $14,614 (25% of AGI, reported on 21.6% of returns)
Here:
$14,614
State:
$18,261
Here:
25.3% of AGI
State:
20.5% of AGI
(% of AGI for various income ranges: 13.4% for AGIs below $10k, 8.1% for AGIs $10k-25k, 8.1% for AGIs $25k-50k, 10.4% for AGIs $50k-75k, 12.1% for AGIs $75k-100k, 11.6% for AGIs over 100k)
Charity contributions deductions: $3,318 (5% of AGI, reported on 18.0% of returns)
Here:
$3,318
State:
$3,665
Here:
5.4% of AGI
State:
3.9% of AGI
(% of AGI for various income ranges: 1.3% for AGIs $10k-25k, 1.1% for AGIs $25k-50k, 2.2% for AGIs $50k-75k, 2.7% for AGIs $75k-100k, 3.4% for AGIs over 100k)
Total tax: $3,513 (reported on 72.4% of returns)
65770:
$3,513
State:
$6,999
(% of AGI for various income ranges: 4.3% for AGIs below $10k, 4.3% for AGIs $10k-25k, 5.8% for AGIs $25k-50k, 7.9% for AGIs $50k-75k, 9.9% for AGIs $75k-100k, 16.0% for AGIs over 100k)
Earned income credit: $1,785 (reported on 18.4% of returns)
Here:
$1,785
State:
$1,728
Percentage of individuals using paid preparers for their 2004 taxes: 69.1%
Here:
69%
State:
62%
(% for various income ranges: 58.7% for AGIs below $10k, 68.4% for AGIs $10k-25k, 76.1% for AGIs $25k-50k, 65.7% for AGIs $50k-75k, 77.6% for AGIs $75k-100k, 86.1% for AGIs over 100k)
Household received Food Stamps/SNAP in the past 12 months: 106 Household did not receive Food Stamps/SNAP in the past 12 months: 977
Women who had a birth in the past 12 months: 45 (37 now married, 7 unmarried) Women who did not have a birth in the past 12 months: 451 (276 now married, 172 unmarried)
Housing units in zip code 65770 with a mortgage: 472 (43 second mortgage, 38 both second mortgage and home equity loan) Houses without a mortgage: 5
Median monthly owner costs for units with a mortgage: $1,155 Median monthly owner costs for units without a mortgage: $404
Residents with income below the poverty level in 2022:
This zip code:
12.1%
Whole state:
13.2%
Residents with income below 50% of the poverty level in 2022:
This zip code:
9.2%
Whole state:
6.8%
Median number of rooms in houses and condos:
Here:
5.7
State:
6.4
Median number of rooms in apartments:
Here:
5.2
State:
4.4
Notable locations in this zip code not listed on our city pages
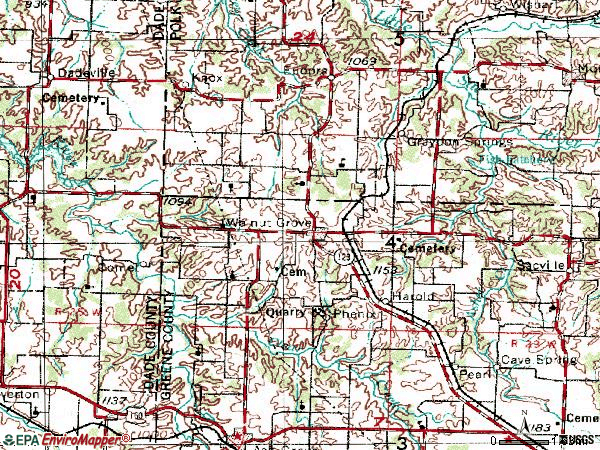
Notable locations in zip code 65770: Walnut Grove Fire Protection District Station 4 (A), Walnut Grove Fire Protection District Station 1 (B). Display/hide their locations on the map
Churches in zip code 65770 include: Concord Church (A), Harold Church (B), Rose Hill Church (C), Luck Church (D), Turkey Creek Missionary Baptist Church (E), Cave Spring Memorial Church (F). Display/hide their locations on the map
Cemeteries: Green Lawn Cemetery (1), Cave Spring Memorial Church Cemetery (2), King Cemetery (3), Rice Cemetery (4), Wheeler Cemetery (5), Leeper Cemetery (6), Williamson Cemetery (7). Display/hide their locations on the map
Streams, rivers, and creeks: Burney Branch (A), Bunker Branch (B), Asher Creek (C), Venable Spring Branch (D), Staley Branch (E), Hargrave Branch (F). Display/hide their locations on the map
In group quarters: 8 (-1 institutionalized population)
Size of family households: 473 2-persons, 128 3-persons, 116 4-persons, 34 5-persons, 9 6-persons, 36 7-or-more-persons
Size of nonfamily households: 261 1-person, 12 2-persons, 7 3-persons
458 married couples with children.
27 single-parent households (4 men, 23 women).
97.2% of residents of 65770 zip code speak English at home.
0.5% of residents speak Spanish at home (100% very well).
1.1% of residents speak other Indo-European language at home (26% very well, 67% well, 7% not well).
1.3% of residents speak Asian or Pacific Island language at home (85% very well, 15% not well).
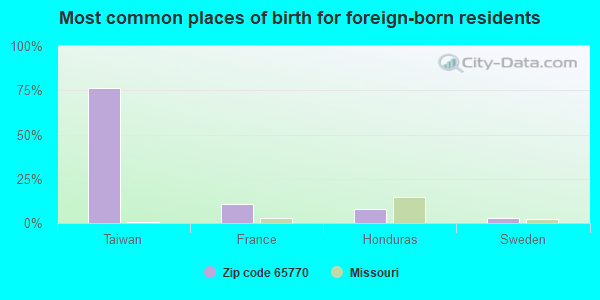
Foreign born population: 37 (1.4%) (10.4% of them are naturalized citizens)
This zip code:
1.4%
Whole state:
4.1%
76%Taiwan
11%France
8%Honduras
3%Sweden
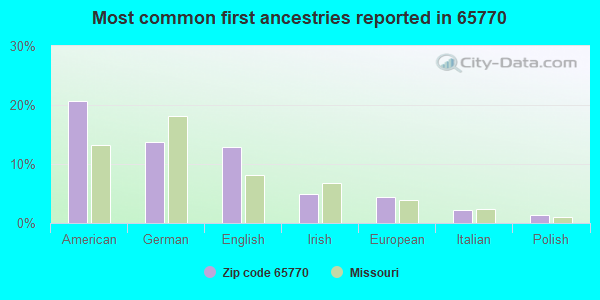
21%American
14%German
13%English
5%Irish
4%European
2%Italian
1%Polish
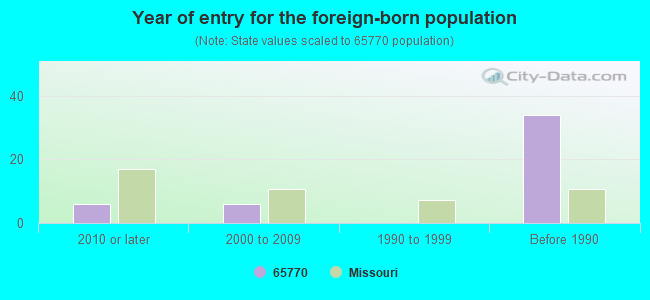
Year of entry for the foreign-born population
62010 or later
62000 to 2009
01990 to 1999
34Before 1990
Facilities with environmental interests located in this zip code:
NORTHERN GREENE COUNTY DRUM (INTERSTATE FARM RD 28 & FARM in WALNUT GROVE, MO) . Federal Facility. ENVIRONMENTAL PROTECTION AGENCY
STATE MASTER (Missouri monitoring and compilance) - CERCLIS-MON000704040, SUPERFUND STATE MASTER (Missouri monitoring and compilance) - RCRAINFO-MOP000044800, NOT IN A UNIVERSE (Resource Conservation and Recovery Act (tracking hazardous waste)) Organizations: US EPA REGION 7 (CONTACT/OPERATOR)
, US EPA REGION VII (CONTACT/OWNER)
Alternative names: NORTHERN GREENE COUNTY DRUM SITE
J W WILLOUGHBY (10137 NORTH FARM ROAD 93 in WALNUT GROVE, MO)
STATE MASTER (Missouri monitoring and compilance) - PCS-MOG821049, NPDES NON-MAJOR National Pollutant Discharge Elimination System NON-MAJOR (Tracking pollutant discharge elimination systems) - permit (Resource Conservation and Recovery Act (tracking hazardous waste)) Business SIC classification: REFUSE SYSTEMS; SANITARY SERVICES Organizations: RUTH CHRISTINE WILLOUBY (CONTACT/OWNER)
Alternative names: J W WILLOUGHBY SEPTIC TANK, WILLOUGHBY J W, WILLOUGHBY SEPTIC TANK CL
PHENIX ROCK (PHENIX in WALNUT GROVE, MO)
AIR MINOR (AIRS/AFS) STATE MASTER (Missouri monitoring and compilance) - AIRS/AFS-MO0907840, AIR MINOR Business SIC classification: CRUSHED AND BROKEN LIMESTONE
Housing units lacking complete plumbing facilities: 3.2% Housing units lacking complete kitchen facilities: 3.3%
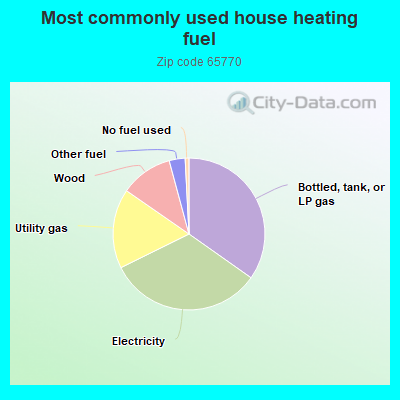
34.9%Bottled, tank, or LP gas
33.0%Electricity
17.0%Utility gas
11.2%Wood
3.4%Other fuel
0.8%No fuel used
Population in 1990: 2,374. Population change in the 1990s: +379 (+16.0%).
Place of birth for U.S.-born residents:
This state: 1,970
Northeast: 47
Midwest: 192
South: 268
West: 135
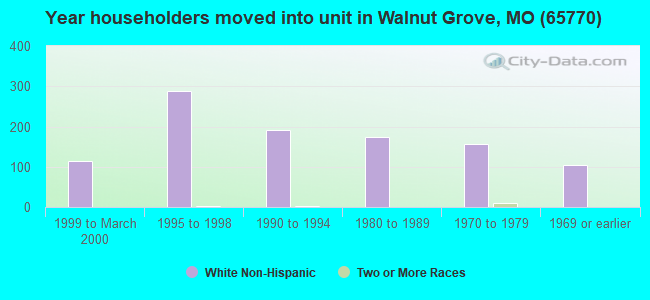
64% of the 65770 zip code residents lived in the same house 5 years ago. Out of people who lived in different houses, 56% lived in this county. Out of people who lived in different counties, 50% lived in Missouri.
93% of the 65770 zip code residents lived in the same house 1 year ago. Out of people who lived in different houses, 46% moved from this county. Out of people who lived in different houses, 48% moved from different county within same state. Out of people who lived in different houses, 7% moved from different state.
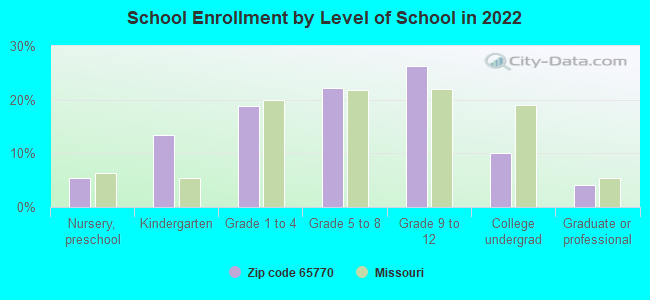
Private vs. public school enrollment:
Students in private schools in grades 1 to 8 (elementary and middle school): 15
Here:
6.5%
Missouri:
15.4%
Students in private schools in grades 9 to 12 (high school): 13
Here:
9.4%
Missouri:
13.9%
Students in private undergraduate colleges: 4
Here:
7.9%
Missouri:
22.6%
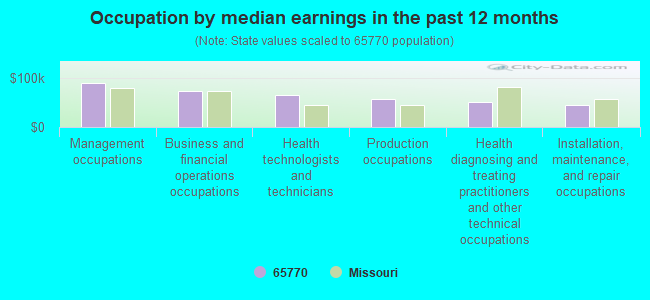
Occupation by median earnings in the past 12 months ($)
90,583Management occupations
75,127Business and financial operations occupations
64,969Health technologists and technicians
58,593Production occupations
50,731Health diagnosing and treating practitioners and other technical occupations
46,046Installation, maintenance, and repair occupations
Top industries in this zip code by the number of employees in 2005:
Other Services (except Public Administration): Religious Organizations (1-4 employees: 4 establishments)
Other Services (except Public Administration): Drycleaning and Laundry Services (except Coin-Operated) (5-9: 1)
Accommodation and Food Services: Full-Service Restaurants (5-9: 1)
Construction: Framing Contractors (5-9: 1)
Wholesale Trade: Petroleum Bulk Stations and Terminals (1-4: 2)
Administrative and Support and Waste Management and Remediation Services: Landscaping Services (1-4: 2)
Construction: Plumbing, Heating, and Air-Conditioning Contractors (1-4: 2)
Construction: Site Preparation Contractors (1-4: 2)
Construction: Roofing Contractors (1-4: 2)
Fatal accident statistics in 2013:
Fatal accident count: 2
Vehicles involved in fatal accidents: 3
Fatal accidents caused by drunken drivers: 1
Fatalities: 2
Persons involved in fatal accidents: 7
Pedestrians involved in fatal accidents: 0
Fatal accident statistics in 2012:
Fatal accident count: 1
Vehicles involved in fatal accidents: 1
Fatal accidents caused by drunken drivers: 1
Fatalities: 1
Persons involved in fatal accidents: 1
Pedestrians involved in fatal accidents: 0
Home Mortgage Disclosure Act Aggregated Statistics For Year 2009 (Based on 4 partial tracts)
A) FHA, FSA/RHS & VA Home Purchase Loans
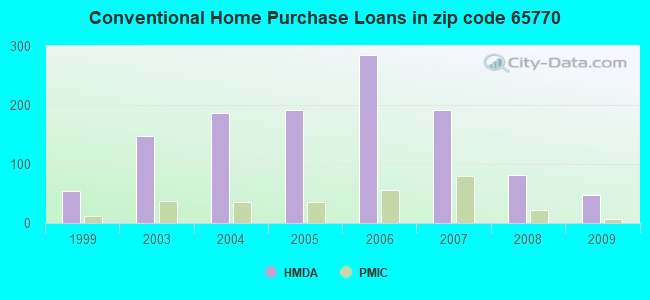
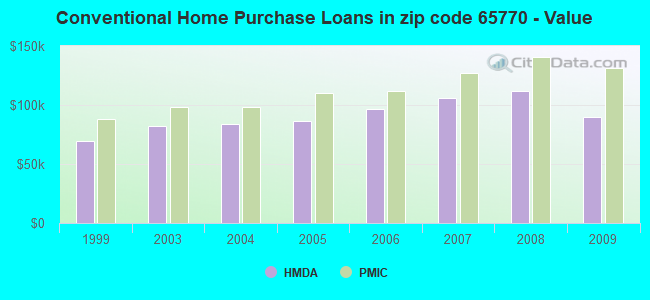
B) Conventional Home Purchase Loans
C) Refinancings
D) Home Improvement Loans
F) Non-occupant Loans on < 5 Family Dwellings (A B C & D)
G) Loans On Manufactured Home Dwelling (A B C & D)
Number
Average Value
Number
Average Value
Number
Average Value
Number
Average Value
Number
Average Value
Number
Average Value
LOANS ORIGINATED
87
$115,015
47
$90,186
239
$123,584
14
$36,689
19
$100,731
5
$70,282
APPLICATIONS APPROVED, NOT ACCEPTED
1
$48,010
3
$127,487
22
$139,993
3
$32,927
1
$13,290
1
$29,540
APPLICATIONS DENIED
11
$113,795
12
$118,165
81
$118,431
9
$10,981
2
$133,470
2
$72,385
APPLICATIONS WITHDRAWN
5
$103,662
4
$84,345
76
$124,932
0
$0
3
$146,773
0
$0
FILES CLOSED FOR INCOMPLETENESS
1
$66,470
0
$0
11
$137,265
1
$22,160
0
$0
0
$0
Aggregated Statistics For Year 2008 (Based on 4 partial tracts)
A) FHA, FSA/RHS & VA Home Purchase Loans
B) Conventional Home Purchase Loans
C) Refinancings
D) Home Improvement Loans
E) Loans on Dwellings For 5+ Families
F) Non-occupant Loans on < 5 Family Dwellings (A B C & D)
G) Loans On Manufactured Home Dwelling (A B C & D)
Number
Average Value
Number
Average Value
Number
Average Value
Number
Average Value
Number
Average Value
Number
Average Value
Number
Average Value
LOANS ORIGINATED
61
$117,084
82
$112,003
184
$109,519
20
$37,508
2
$1,319,935
44
$97,180
10
$60,518
APPLICATIONS APPROVED, NOT ACCEPTED
1
$112,400
9
$179,933
16
$130,096
2
$4,125
0
$0
5
$162,918
1
$52,440
APPLICATIONS DENIED
12
$116,659
12
$137,118
117
$123,065
20
$41,696
0
$0
4
$103,592
5
$108,620
APPLICATIONS WITHDRAWN
3
$76,997
10
$90,539
56
$129,640
1
$63,520
0
$0
2
$64,630
0
$0
FILES CLOSED FOR INCOMPLETENESS
0
$0
1
$42,100
11
$116,155
0
$0
0
$0
0
$0
0
$0
Aggregated Statistics For Year 2007 (Based on 4 partial tracts)
A) FHA, FSA/RHS & VA Home Purchase Loans
B) Conventional Home Purchase Loans
C) Refinancings
D) Home Improvement Loans
E) Loans on Dwellings For 5+ Families
F) Non-occupant Loans on < 5 Family Dwellings (A B C & D)
G) Loans On Manufactured Home Dwelling (A B C & D)
Number
Average Value
Number
Average Value
Number
Average Value
Number
Average Value
Number
Average Value
Number
Average Value
Number
Average Value
LOANS ORIGINATED
27
$95,986
192
$105,784
186
$113,654
30
$46,143
1
$1,299,310
68
$115,419
5
$102,334
APPLICATIONS APPROVED, NOT ACCEPTED
4
$148,492
7
$91,666
28
$100,410
8
$44,860
0
$0
1
$103,120
3
$29,553
APPLICATIONS DENIED
4
$75,532
45
$130,970
123
$126,714
27
$61,719
0
$0
14
$125,187
5
$64,714
APPLICATIONS WITHDRAWN
3
$62,610
16
$99,668
61
$118,690
3
$61,580
0
$0
1
$69,430
1
$39,190
FILES CLOSED FOR INCOMPLETENESS
0
$0
6
$137,950
11
$118,235
1
$14,770
0
$0
3
$135,773
0
$0
Aggregated Statistics For Year 2006 (Based on 4 partial tracts)
A) FHA, FSA/RHS & VA Home Purchase Loans
B) Conventional Home Purchase Loans
C) Refinancings
D) Home Improvement Loans
F) Non-occupant Loans on < 5 Family Dwellings (A B C & D)
G) Loans On Manufactured Home Dwelling (A B C & D)
Number
Average Value
Number
Average Value
Number
Average Value
Number
Average Value
Number
Average Value
Number
Average Value
LOANS ORIGINATED
42
$115,773
285
$96,485
243
$103,773
29
$58,077
95
$100,955
9
$61,958
APPLICATIONS APPROVED, NOT ACCEPTED
2
$111,370
28
$85,975
30
$90,747
10
$30,975
2
$22,160
3
$65,227
APPLICATIONS DENIED
11
$82,403
73
$107,602
152
$97,166
29
$54,561
36
$114,004
13
$81,967
APPLICATIONS WITHDRAWN
2
$96,090
41
$113,348
90
$107,730
7
$74,974
17
$113,305
0
$0
FILES CLOSED FOR INCOMPLETENESS
0
$0
5
$79,678
23
$119,355
2
$11,425
4
$85,392
0
$0
Aggregated Statistics For Year 2005 (Based on 4 partial tracts)
A) FHA, FSA/RHS & VA Home Purchase Loans
B) Conventional Home Purchase Loans
C) Refinancings
D) Home Improvement Loans
E) Loans on Dwellings For 5+ Families
F) Non-occupant Loans on < 5 Family Dwellings (A B C & D)
G) Loans On Manufactured Home Dwelling (A B C & D)
Number
Average Value
Number
Average Value
Number
Average Value
Number
Average Value
Number
Average Value
Number
Average Value
Number
Average Value
LOANS ORIGINATED
48
$103,326
192
$86,107
204
$97,014
14
$28,429
1
$253,340
38
$81,485
5
$53,572
APPLICATIONS APPROVED, NOT ACCEPTED
1
$107,840
20
$74,580
32
$95,026
2
$14,950
0
$0
5
$81,690
1
$20,620
APPLICATIONS DENIED
4
$116,332
54
$90,013
169
$100,038
21
$25,689
0
$0
11
$65,533
18
$73,541
APPLICATIONS WITHDRAWN
3
$108,510
22
$96,294
110
$119,848
5
$190,516
0
$0
4
$105,390
3
$95,343
FILES CLOSED FOR INCOMPLETENESS
0
$0
5
$64,724
22
$106,630
1
$20,620
0
$0
0
$0
1
$44,320
Aggregated Statistics For Year 2004 (Based on 4 partial tracts)
A) FHA, FSA/RHS & VA Home Purchase Loans
B) Conventional Home Purchase Loans
C) Refinancings
D) Home Improvement Loans
E) Loans on Dwellings For 5+ Families
F) Non-occupant Loans on < 5 Family Dwellings (A B C & D)
G) Loans On Manufactured Home Dwelling (A B C & D)
Number
Average Value
Number
Average Value
Number
Average Value
Number
Average Value
Number
Average Value
Number
Average Value
Number
Average Value
LOANS ORIGINATED
56
$98,030
186
$84,003
253
$97,988
22
$34,258
1
$13,290
51
$93,748
9
$65,037
APPLICATIONS APPROVED, NOT ACCEPTED
1
$148,490
15
$102,168
34
$84,689
3
$20,217
0
$0
0
$0
6
$72,870
APPLICATIONS DENIED
10
$96,682
51
$72,538
160
$88,214
18
$43,810
0
$0
4
$59,335
20
$53,904
APPLICATIONS WITHDRAWN
6
$109,823
11
$58,786
90
$97,825
4
$63,630
0
$0
3
$105,553
1
$62,780
FILES CLOSED FOR INCOMPLETENESS
1
$110,340
2
$80,520
20
$111,577
0
$0
0
$0
0
$0
0
$0
Aggregated Statistics For Year 2003 (Based on 4 partial tracts)
A) FHA, FSA/RHS & VA Home Purchase Loans
B) Conventional Home Purchase Loans
C) Refinancings
D) Home Improvement Loans
F) Non-occupant Loans on < 5 Family Dwellings (A B C & D)
Number
Average Value
Number
Average Value
Number
Average Value
Number
Average Value
Number
Average Value
LOANS ORIGINATED
57
$94,382
148
$82,048
563
$88,136
21
$31,681
41
$72,284
APPLICATIONS APPROVED, NOT ACCEPTED
1
$123,740
20
$64,570
50
$87,985
1
$11,080
3
$51,400
APPLICATIONS DENIED
7
$108,570
50
$76,952
154
$103,730
17
$26,178
6
$100,713
APPLICATIONS WITHDRAWN
3
$114,807
18
$79,073
105
$83,172
3
$54,310
5
$70,558
FILES CLOSED FOR INCOMPLETENESS
1
$81,460
6
$82,843
25
$90,783
1
$28,810
1
$87,650
Aggregated Statistics For Year 1999 (Based on 1 partial tract)
A) FHA, FSA/RHS & VA Home Purchase Loans
B) Conventional Home Purchase Loans
C) Refinancings
D) Home Improvement Loans
F) Non-occupant Loans on < 5 Family Dwellings (A B C & D)
Detailed PMIC statistics for the following Tracts:0050.01
, 0050.02
2003 - 2018 National Fire Incident Reporting System (NFIRS) incidents
Based on the data from the years 2003 - 2018 the average number of fires per year is 40. The highest number of reported fire incidents - 66 took place in 2006, and the least - 3 in 2003. The data has a rising trend.
When looking into fire subcategories, the most reports belonged to: Outside Fires (62.4%), and Structure Fires (29.8%).
Fire incident types reported to NFIRS in Zip Code 65770
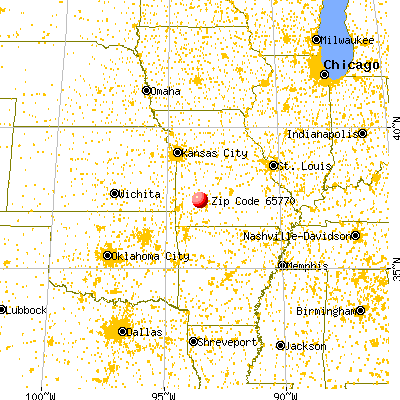


 Nearest zip codes: 65601, 65710, 65781, 65604, 65646, 65635.


 . Federal Facility. ENVIRONMENTAL PROTECTION AGENCY
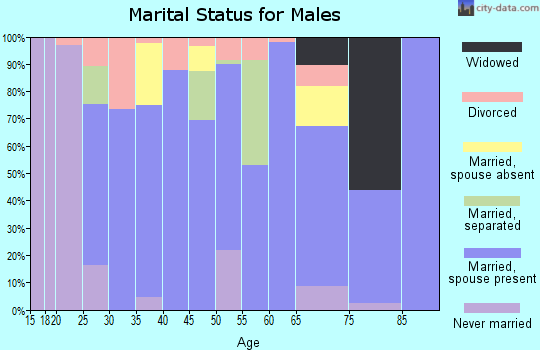
 Based on the data from the years 2003 - 2018 the average number of fires per year is 40. The highest number of reported fire incidents - 66 took place in 2006, and the least - 3 in 2003. The data has a rising trend.
 When looking into fire subcategories, the most reports belonged to: Outside Fires (62.4%), and Structure Fires (29.8%).