Estimated zip code population in 2022: 5,479 Zip code population in 2010: 6,803 Zip code population in 2000: 6,763
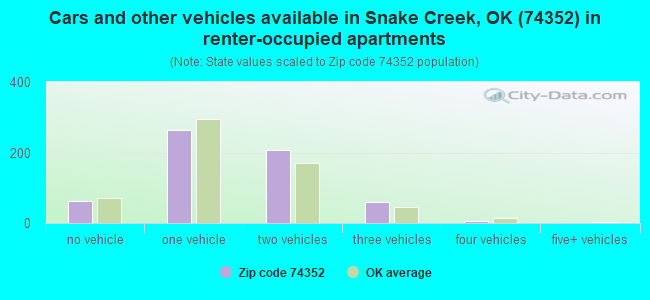
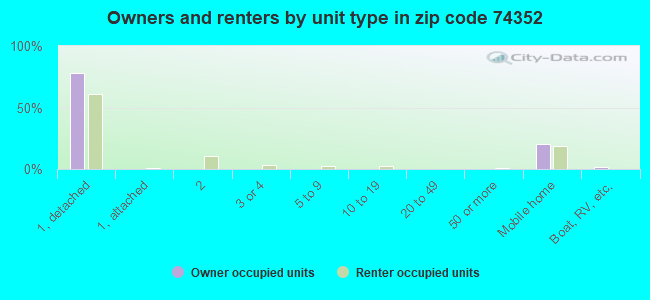
Houses and condos: 2,722 Renter-occupied apartments: 601
% of renters here:
27%
State:
35%
March 2022 cost of living index in zip code 74352: 79.1 (low, U.S. average is 100)
Land area: 130.8 sq. mi. Water area: 5.4 sq. mi.
Population density: 42 people per square mile
(very low).
OSM Map
General Map
Google Map
MSN Map
OSM Map
General Map
Google Map
MSN Map
OSM Map
General Map
Google Map
MSN Map
OSM Map
General Map
Google Map
MSN Map
Please wait while loading the map...
Real estate property taxes paid for housing units in 2022:
This zip code:
0.7% ($906)
Oklahoma:
0.8% ($1,501)
Median real estate property taxes paid for housing units with mortgages in 2022: $1,304 (0.7%) Median real estate property taxes paid for housing units with no mortgage in 2022: $683 (0.6%)
Averages for the 2020 tax year for zip code 74352, filed in 2021:
Average Adjusted Gross Income (AGI) in 2020: $48,278 (Individual Income Tax Returns)
Here:
$48,278
State:
$63,060
Salary/wage: $45,071 (reported on 83.1% of returns)
Here:
$45,071
State:
$52,427
(% of AGI for various income ranges: 1176.2% for AGIs below $25k, 3684.4% for AGIs $25k-50k, 6422.4% for AGIs $50k-75k, 10075.3% for AGIs $75k-100k, 16107.5% for AGIs $100k-200k)
Taxable interest for individuals: $793 (reported on 21.3% of returns)
This zip code:
$793
Oklahoma:
$1,603
(% of AGI for various income ranges: 12.4% for AGIs below $25k, 23.2% for AGIs $25k-50k, 24.5% for AGIs $50k-75k, 27.1% for AGIs $75k-100k, 45.0% for AGIs $100k-200k)
Ordinary dividends: $1,873 (reported on 5.9% of returns)
Here:
$1,873
State:
$7,001
(% of AGI for various income ranges: 7.1% for AGIs below $25k, 6.0% for AGIs $25k-50k, 42.1% for AGIs $50k-75k, 46.2% for AGIs $100k-200k)
Net capital gain/loss in AGI: +$10,550 (reported on 5.5% of returns)
Here:
+$10,550
State:
+$19,855
(% of AGI for various income ranges: 28.2% for AGIs $25k-50k, 93.1% for AGIs $50k-75k, 654.4% for AGIs $100k-200k)
Profit/loss from business: +$4,952 (reported on 15.7% of returns)
Here:
+$4,952
State:
+$9,904
(% of AGI for various income ranges: 108.5% for AGIs below $25k, 66.1% for AGIs $25k-50k, 97.2% for AGIs $50k-75k, 152.9% for AGIs $75k-100k, 175.6% for AGIs $100k-200k)
Taxable individual retirement arrangement distribution: $15,607 (reported on 5.9% of returns)
74352:
$15,607
Oklahoma:
$20,476
(% of AGI for various income ranges: 40.0% for AGIs below $25k, 57.7% for AGIs $25k-50k, 133.8% for AGIs $50k-75k, 260.6% for AGIs $75k-100k, 558.1% for AGIs $100k-200k)
Total itemized deductions: $40,200 (reported on 2.8% of returns)
Here:
$40,200
State:
$39,736
(% of AGI for various income ranges: 317.2% for AGIs $50k-75k, 1183.8% for AGIs $100k-200k)
Charity contributions: $11,400 (reported on 2.4% of returns)
Here:
$11,400
State:
$17,288
(% of AGI for various income ranges: 60.0% for AGIs $50k-75k, 318.8% for AGIs $100k-200k)
Taxes paid: $5,450 (reported on 3.1% of returns)
74352:
$5,450
State:
$7,046
(% of AGI for various income ranges: 49.0% for AGIs $50k-75k, 183.8% for AGIs $100k-200k)
Earned income credit: $2,607 (reported on 23.2% of returns)
Here:
$2,607
State:
$2,435
(% of AGI for various income ranges: 131.5% for AGIs below $25k, 103.7% for AGIs $25k-50k)
Percentage of individuals using paid preparers for their 2020 taxes: 93.3%
Here:
93%
State:
94%
(% for various income ranges: 94.6% for AGIs below $25k, 91.4% for AGIs $25k-50k, 92.3% for AGIs $50k-75k, 95.8% for AGIs $75k-100k, 92.0% for AGIs $100k-200k, 100.0% for AGIs over 200k)
Averages for the 2012 tax year for zip code 74352, filed in 2013:
Average Adjusted Gross Income (AGI) in 2012: $47,561 (Individual Income Tax Returns)
Here:
$47,561
State:
$58,581
Salary/wage: $39,149 (reported on 83.4% of returns)
Here:
$39,149
State:
$45,973
(% of AGI for various income ranges: 74.2% for AGIs below $25k, 84.4% for AGIs $25k-50k, 84.0% for AGIs $50k-75k, 83.0% for AGIs $75k-100k, 101.3% for AGIs $100k-200k)
Taxable interest for individuals: $880 (reported on 23.8% of returns)
This zip code:
$880
Oklahoma:
$1,625
(% of AGI for various income ranges: 0.9% for AGIs below $25k, 0.5% for AGIs $25k-50k, 0.3% for AGIs $50k-75k, 0.2% for AGIs $75k-100k, 1.0% for AGIs $100k-200k)
Ordinary dividends: $2,000 (reported on 6.4% of returns)
Here:
$2,000
State:
$6,374
(% of AGI for various income ranges: 0.6% for AGIs below $25k, 0.4% for AGIs $25k-50k, 0.1% for AGIs $50k-75k, 0.2% for AGIs $75k-100k, 0.4% for AGIs $100k-200k)
Net capital gain/loss in AGI: +$5,240 (reported on 6.4% of returns)
Here:
+$5,240
State:
+$24,023
(% of AGI for various income ranges: 0.4% for AGIs below $25k, 0.5% for AGIs $25k-50k, 0.3% for AGIs $50k-75k, 0.5% for AGIs $75k-100k, 3.0% for AGIs $100k-200k)
Profit/loss from business: +$7,420 (reported on 18.7% of returns)
Here:
+$7,420
State:
+$11,913
(% of AGI for various income ranges: 11.5% for AGIs below $25k, 3.5% for AGIs $25k-50k, 1.4% for AGIs $50k-75k, 1.4% for AGIs $75k-100k, 2.9% for AGIs $100k-200k)
Taxable individual retirement arrangement distribution: $12,027 (reported on 6.4% of returns)
74352:
$12,027
Oklahoma:
$15,242
(% of AGI for various income ranges: 2.0% for AGIs below $25k, 1.1% for AGIs $25k-50k, 2.3% for AGIs $50k-75k, 4.7% for AGIs $75k-100k)
Total itemized deductions: $24,876 (20% of AGI, reported on 16.2% of returns)
Here:
$24,876
State:
$24,882
Here:
19.9% of AGI
State:
18.8% of AGI
(% of AGI for various income ranges: 4.2% for AGIs below $25k, 5.1% for AGIs $25k-50k, 8.0% for AGIs $50k-75k, 8.4% for AGIs $75k-100k, 11.5% for AGIs $100k-200k, 12.6% for AGIs over 200k)
Charity contributions: $5,572 (reported on 12.3% of returns)
Here:
$5,572
State:
$6,591
(% of AGI for various income ranges: 1.3% for AGIs $25k-50k, 1.4% for AGIs $50k-75k, 1.6% for AGIs $75k-100k, 4.6% for AGIs $100k-200k)
Taxes paid: $5,387 (reported on 16.2% of returns)
74352:
$5,387
State:
$7,196
(% of AGI for various income ranges: 0.4% for AGIs below $25k, 0.8% for AGIs $25k-50k, 1.7% for AGIs $50k-75k, 2.1% for AGIs $75k-100k, 3.2% for AGIs $100k-200k, 2.7% for AGIs over 200k)
Earned income credit: $2,452 (reported on 30.2% of returns)
Here:
$2,452
State:
$2,354
(% of AGI for various income ranges: 10.0% for AGIs below $25k, 2.0% for AGIs $25k-50k)
Percentage of individuals using paid preparers for their 2012 taxes: 63.0%
Here:
63%
State:
56%
(% for various income ranges: 58.7% for AGIs below $25k, 61.7% for AGIs $25k-50k, 67.6% for AGIs $50k-75k, 70.0% for AGIs $75k-100k, 75.0% for AGIs $100k-200k, 100.0% for AGIs over 200k)
Averages for the 2004 tax year for zip code 74352, filed in 2005:
Average Adjusted Gross Income (AGI) in 2004: $29,044 (Individual Income Tax Returns)
Here:
$29,044
State:
$41,245
Salary/wage: $29,994 (reported on 85.0% of returns)
Here:
$29,994
State:
$35,318
(% of AGI for various income ranges: 119.5% for AGIs below $10k, 82.5% for AGIs $10k-25k, 90.1% for AGIs $25k-50k, 87.7% for AGIs $50k-75k, 92.3% for AGIs $75k-100k, 67.2% for AGIs over 100k)
Taxable interest for individuals: $1,216 (reported on 30.4% of returns)
This zip code:
$1,216
Oklahoma:
$1,745
(% of AGI for various income ranges: 5.3% for AGIs below $10k, 1.4% for AGIs $10k-25k, 1.0% for AGIs $25k-50k, 1.3% for AGIs $50k-75k, 1.0% for AGIs $75k-100k, 0.7% for AGIs over 100k)
Taxable dividends: $926 (reported on 7.1% of returns)
Here:
$926
State:
$2,920
(% of AGI for various income ranges: 1.0% for AGIs below $10k, 0.3% for AGIs $10k-25k, 0.2% for AGIs $25k-50k, 0.1% for AGIs $50k-75k, 0.2% for AGIs $75k-100k, 0.3% for AGIs over 100k)
Net capital gain/loss: +$4,453 (reported on 7.7% of returns)
Here:
+$4,453
State:
+$10,653
(% of AGI for various income ranges: 1.5% for AGIs below $10k, 0.7% for AGIs $10k-25k, 0.7% for AGIs $25k-50k, 0.4% for AGIs $50k-75k, 2.9% for AGIs $75k-100k, 3.9% for AGIs over 100k)
Profit/loss from business: +$3,831 (reported on 19.3% of returns)
Here:
+$3,831
State:
+$8,532
(% of AGI for various income ranges: 11.3% for AGIs below $10k, 7.5% for AGIs $10k-25k, 2.2% for AGIs $25k-50k, 0.2% for AGIs $50k-75k, 0.6% for AGIs $75k-100k)
IRA payment deduction: $1,879 (reported on 1.3% of returns)
74352:
$1,879
Oklahoma:
$3,127
Total itemized deductions: $14,789 (26% of AGI, reported on 20.7% of returns)
Here:
$14,789
State:
$17,093
Here:
26.3% of AGI
State:
20.5% of AGI
(% of AGI for various income ranges: 3.8% for AGIs below $10k, 8.2% for AGIs $10k-25k, 7.9% for AGIs $25k-50k, 12.0% for AGIs $50k-75k, 15.7% for AGIs $75k-100k, 17.2% for AGIs over 100k)
Charity contributions deductions: $3,452 (6% of AGI, reported on 16.6% of returns)
Here:
$3,452
State:
$4,240
Here:
6.0% of AGI
State:
4.8% of AGI
(% of AGI for various income ranges: 0.8% for AGIs below $10k, 1.2% for AGIs $10k-25k, 1.8% for AGIs $25k-50k, 2.4% for AGIs $50k-75k, 3.0% for AGIs $75k-100k, 2.0% for AGIs over 100k)
Total tax: $3,173 (reported on 64.4% of returns)
74352:
$3,173
State:
$6,542
(% of AGI for various income ranges: 4.7% for AGIs below $10k, 3.3% for AGIs $10k-25k, 5.5% for AGIs $25k-50k, 8.4% for AGIs $50k-75k, 10.1% for AGIs $75k-100k, 14.5% for AGIs over 100k)
Earned income credit: $1,895 (reported on 29.6% of returns)
Here:
$1,895
State:
$1,830
Percentage of individuals using paid preparers for their 2004 taxes: 69.7%
Here:
70%
State:
63%
(% for various income ranges: 67.2% for AGIs below $10k, 73.3% for AGIs $10k-25k, 69.0% for AGIs $25k-50k, 66.9% for AGIs $50k-75k, 71.2% for AGIs $75k-100k, 69.7% for AGIs over 100k)
Likely homosexual households (counted as self-reported same-sex unmarried-partner households)
Lesbian couples: 0.1% of all households
Gay men: 0.0% of all households
Household received Food Stamps/SNAP in the past 12 months: 583 Household did not receive Food Stamps/SNAP in the past 12 months: 1,676
Women who had a birth in the past 12 months: 74 (65 now married, 9 unmarried) Women who did not have a birth in the past 12 months: 985 (547 now married, 438 unmarried)
Housing units in zip code 74352 with a mortgage: 582 (43 second mortgage, 27 both second mortgage and home equity loan) Median monthly owner costs for units with a mortgage: $1,208 Median monthly owner costs for units without a mortgage: $373
Residents with income below the poverty level in 2022:
This zip code:
19.0%
Whole state:
15.7%
Residents with income below 50% of the poverty level in 2022:
This zip code:
11.7%
Whole state:
8.3%
Median number of rooms in houses and condos:
Here:
5.9
State:
6.1
Median number of rooms in apartments:
Here:
4.8
State:
4.5
Notable locations in this zip code not listed on our city pages
Notable locations in zip code 74352: Camp Garland (A), Camp Scott (B), Chimney Rock Volunteer Fire Department Station 2 (C), Mayes Emergency Services Trust Authority Station 3 (D), Locust Grove Fire Department (E). Display/hide their locations on the map
Churches in zip code 74352 include: Ballou Church (A), Cedar Crest Church (B), Cedar Grove Church (C), Markham Ferry Church (D), Maner Church (E), Four Corners Church (F), Little Rock Church (G), Iron Post Church (H), Snake Creek Church (I). Display/hide their locations on the map
Cemeteries: Gray Cemetery (1), Haner Cemetery (2), Ballou Cemetery (3), Downing Cemetery (4), Hogan Cemetery (5), Calvalier Cemetery (6), Little Rock Cemetery (7). Display/hide their locations on the map
Streams, rivers, and creeks: Crutchfield Branch (A), Big Hollow Creek (B), Ballou Branch (C), Spring Creek (D), Snake Creek (E), Pipe Spring Branch (F), Jane Dennis Creek (G). Display/hide their locations on the map
Parks in zip code 74352 include: Earbob Ferry Recreation Area (1), Spring Creek Recreation Area (2), Big Hollow Public Use Area (3), Low Water Dam Public Use Area (4). Display/hide their locations on the map
Size of family households: 708 2-persons, 293 3-persons, 251 4-persons, 114 5-persons, 76 6-persons, 13 7-or-more-persons
Size of nonfamily households: 592 1-person, 162 2-persons, 9 3-persons
713 married couples with children.
205 single-parent households (51 men, 154 women).
95.9% of residents of 74352 zip code speak English at home.
1.8% of residents speak Spanish at home (76% very well, 10% well, 1% not well, 12% not at all).
0.4% of residents speak other Indo-European language at home (78% very well, 22% well).
0.3% of residents speak Asian or Pacific Island language at home (87% very well, 13% well).
1.4% of residents speak other language at home (93% very well, 7% well).
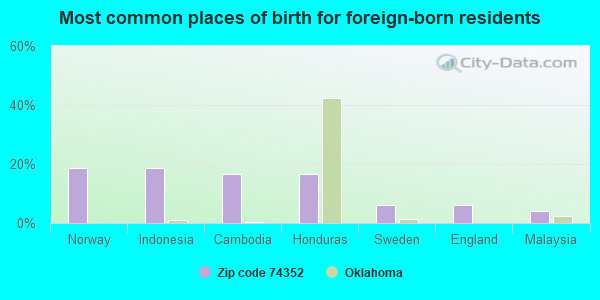
Foreign born population: 48 (0.9%) (55.3% of them are naturalized citizens)
This zip code:
0.9%
Whole state:
6.0%
19%Norway
19%Indonesia
17%Cambodia
17%Honduras
6%Sweden
6%England
4%Malaysia
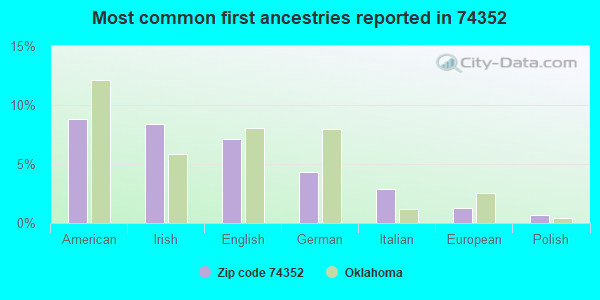
9%American
8%Irish
7%English
4%German
3%Italian
1%European
1%Polish
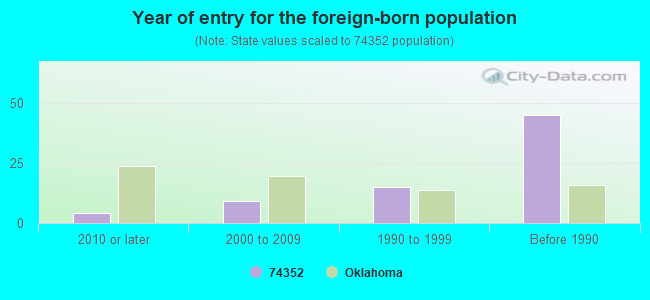
Year of entry for the foreign-born population
42010 or later
92000 to 2009
151990 to 1999
45Before 1990
Facilities with environmental interests located in this zip code:
LOCUST GROVE EARLY LRNING CTR (406 NORTH LOCUST in LOCUST GROVE, OK)
(National Center for Education Statistics) - STATE ID-46-I017-105
LOCUST GROVE HS (419 N. BROADWAY in LOCUST GROVE, OK)
(National Center for Education Statistics) - STATE ID-46-I017-705
LOCUST GROVE MS (700 N. HWY 82 in LOCUST GROVE, OK)
(National Center for Education Statistics) - STATE ID-46-I017-505
LOCUST GROVE UPPER ES (720 NORTH HIGHWAY 82 in LOCUST GROVE, OK)
(National Center for Education Statistics) - STATE ID-46-I017-110
EXPRESS METAL FABRICATORS INCORPORATED (3 MILES EAST ON 412 in LOCUST GROVE, OK)
AIR MINOR (AIRS/AFS) Small Quantity Generators, between 100 kg and 1000 kg of hazardous waste/month (Resource Conservation and Recovery Act (tracking hazardous waste)) - notification Business SIC classification: FABRICATED PLATE WORK (BOILER SHOPS); OIL AND GAS FIELD MACHINERY AND EQUIPMENT Alternative names: EXPRESS METAL FABRI/HEAT RECOVERY SYSTEM
GRAND RIVER DAM AUTHORITY/MARKHARM FERRY (1 MILE W 2 MILES N in LOCUST GROVE, OK)
Large Quantity Generators, more that 1000 kg of hazardous waste/month (Resource Conservation and Recovery Act (tracking hazardous waste)) Organizations: GRAND RIVER DAM AUTHORITTY (CONTACT/OWNER)
CLA VID INC (HWY 33 & 69A 2.3M S in LOCUST GROVE, OK)
(Resource Conservation and Recovery Act (tracking hazardous waste)) Organizations: CLARK & DAVE AYRES (CONTACT/OWNER)
LOCUST GROVE PUBLIC WORKS AUTH (P.O. BOX 246 in LOCUST GROVE, OK)
STATE MASTER (Oklahoma environmental compliance activities data) National Pollutant Discharge Elimination System NON-MAJOR (Tracking pollutant discharge elimination systems) - permit Business SIC classification: SEWERAGE SYSTEMS
GRDA-KERR DAM HYDROELETRIC PLT (1.5 M N & 0.5 M W LOCUST GROVE in LOCUST GROVE, OK)
National Pollutant Discharge Elimination System NON-MAJOR (Tracking pollutant discharge elimination systems) - permit Business SIC classification: ELECTRIC SERVICES Alternative names: GRAND RIVER DAM AUTHORITY, GRAND RIVER DAM AUTH-KERR DJB
LOCUST GROVE SCHOOL (419 N BROADWAY in LOCUST GROVE, OK)
COMPLIANCE ACTIVITY (Tracking inspections of insecticide, fungicide, and rodenticide, and toxic substances) Business SIC classification: ELEMENTARY AND SECONDARY SCHOOLS Alternative names: LOCUST GROVE SCHHOL
Housing units lacking complete plumbing facilities: 5.7% Housing units lacking complete kitchen facilities: 4.5%
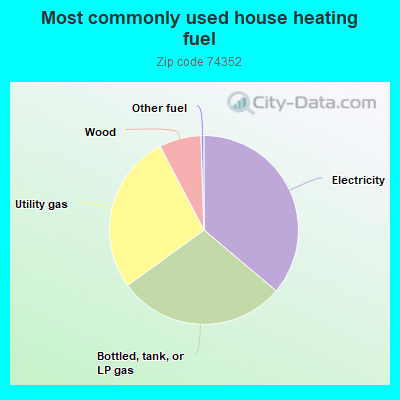
36.2%Electricity
28.9%Bottled, tank, or LP gas
27.3%Utility gas
7.2%Wood
0.5%Other fuel
Population in 1990: 5,856. Population change in the 1990s: +907 (+15.5%).
Place of birth for U.S.-born residents:
This state: 4,142
Northeast: 67
Midwest: 312
South: 421
West: 439
58% of the 74352 zip code residents lived in the same house 5 years ago. Out of people who lived in different houses, 50% lived in this county. Out of people who lived in different counties, 50% lived in Oklahoma.
97% of the 74352 zip code residents lived in the same house 1 year ago. Out of people who lived in different houses, 31% moved from this county. Out of people who lived in different houses, 61% moved from different county within same state. Out of people who lived in different houses, 31% moved from different state.
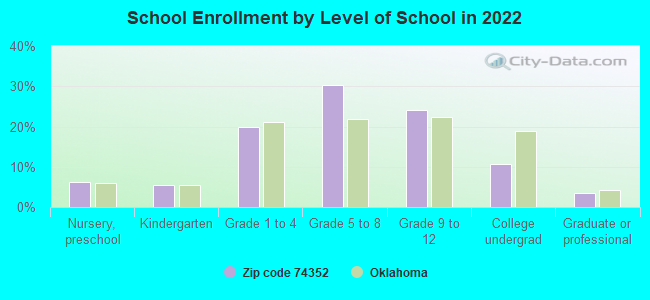
Private vs. public school enrollment:
Students in private schools in grades 1 to 8 (elementary and middle school): 46
Here:
7.8%
Oklahoma:
11.7%
Students in private schools in grades 9 to 12 (high school): 22
Here:
7.6%
Oklahoma:
11.7%
Students in private undergraduate colleges: 11
Here:
9.2%
Oklahoma:
19.3%
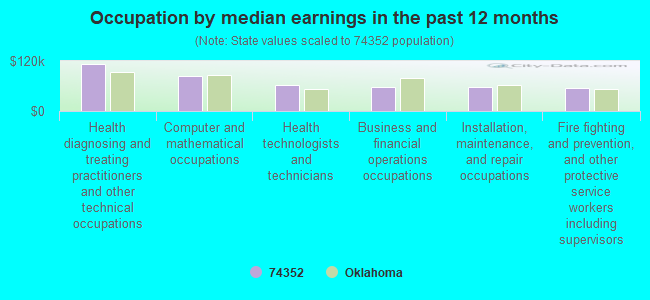
Occupation by median earnings in the past 12 months ($)
113,160Health diagnosing and treating practitioners and other technical occupations
83,459Computer and mathematical occupations
62,001Health technologists and technicians
57,805Business and financial operations occupations
57,748Installation, maintenance, and repair occupations
56,097Fire fighting and prevention, and other protective service workers including supervisors
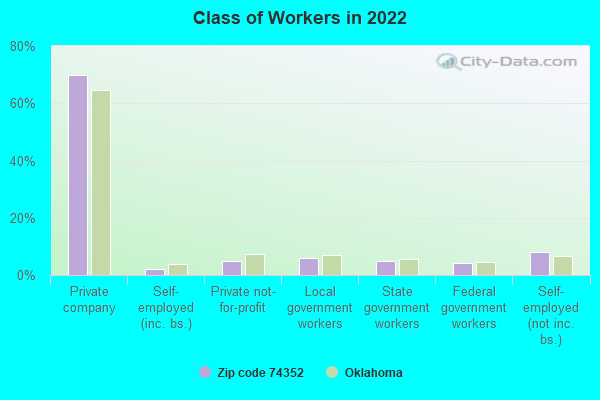
Top industries in this zip code by the number of employees in 2005:
Finance and Insurance: Commercial Banking (20-49 employees: 2 establishments)
Accommodation and Food Services: Full-Service Restaurants (20-49: 1, 10-19: 2)
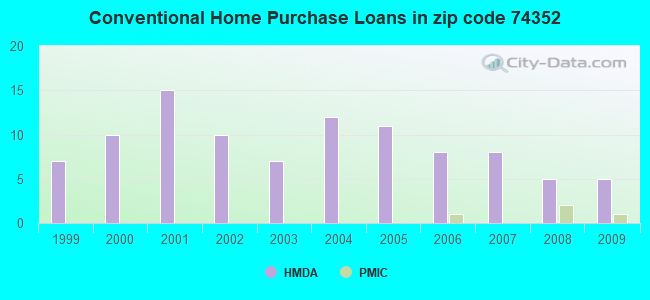
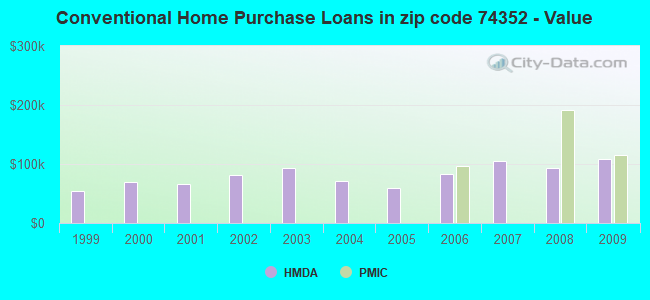
Detailed PMIC statistics for the following Tracts:0302.00
2002 - 2018 National Fire Incident Reporting System (NFIRS) incidents
Based on the data from the years 2002 - 2018 the average number of fires per year is 76. The highest number of reported fire incidents - 110 took place in 2006, and the least - 46 in 2002. The data has an increasing trend.
When looking into fire subcategories, the most incidents belonged to: Outside Fires (69.1%), and Structure Fires (17.6%).
Fire incident types reported to NFIRS in Zip Code 74352
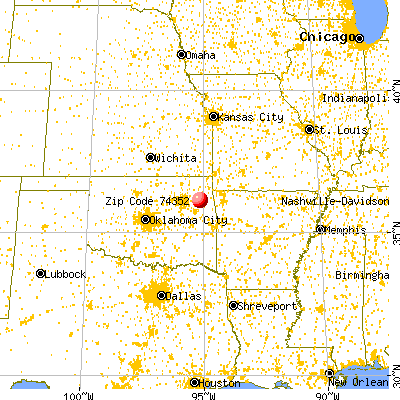


 Nearest zip codes: 74452, 74337, 74477, 74441, 74365, 74361.


 Based on the data from the years 2002 - 2018 the average number of fires per year is 76. The highest number of reported fire incidents - 110 took place in 2006, and the least - 46 in 2002. The data has an increasing trend.
 When looking into fire subcategories, the most incidents belonged to: Outside Fires (69.1%), and Structure Fires (17.6%).