Estimated zip code population in 2022: 27,725
Zip code population in 2010: 22,545
Zip code population in 2000: 13,824
Houses and condos: 9,713
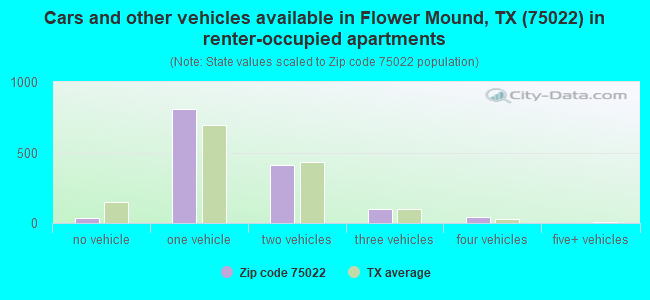
Renter-occupied apartments: 1,407
% of renters here:
15%State:
38%
March 2022 cost of living index in zip code 75022: 96.5
(near average, U.S. average is 100)
Land area: 19.2
sq. mi.
Water area: 2.1
sq. mi.
Population density: 1,443 people per square mile (low).
OSM Map
General Map
Google Map
MSN Map
OSM Map
General Map
Google Map
MSN Map
OSM Map
General Map
Google Map
MSN Map
OSM Map
General Map
Google Map
MSN Map
Please wait while loading the map...
Real estate property taxes paid for housing units in 2022:
This zip code:
1.5% ($9,872)Texas:
1.5% ($4,050)
Median real estate property taxes paid for housing units with mortgages in 2022: $10,400 (1.5%)
Median real estate property taxes paid for housing units with no mortgage in 2022: $8,680 (1.5%)
Profiles of local businesses
Business Search - 14 Million verified businesses
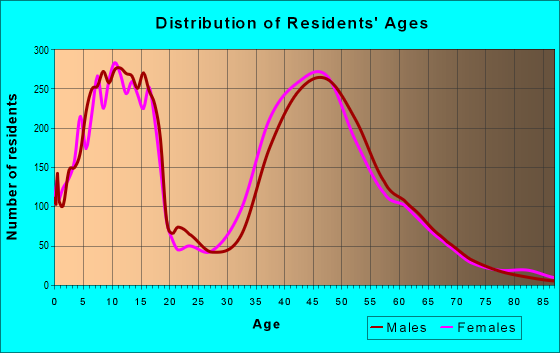
Males: 14,535 Females: 13,190
For population 25 years and over in 75022:
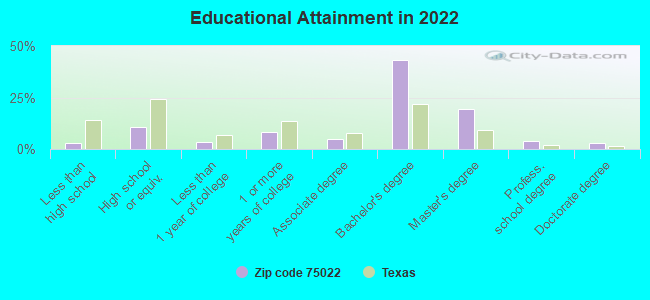
High school or higher: 100.0%Bachelor's degree or higher: 71.5%Graduate or professional degree: 27.0%Unemployed: 2.7%Mean travel time to work (commute): 27.1 minutes
For population 15 years and over in 75022:
Never married: 25.4%Now married: 64.7%Separated: 0.2%Widowed: 2.8%Divorced: 6.9%
Zip code 75022 compared to state average:
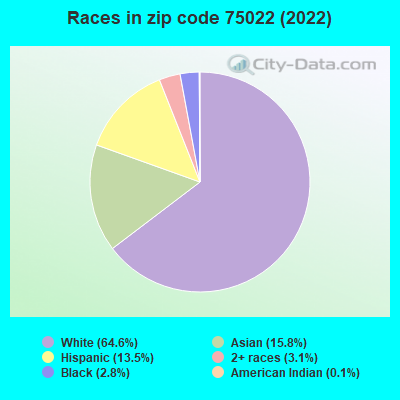
Median household income significantly above state average. Median house value significantly above state average. Black race population percentage significantly below state average. Hispanic race population percentage significantly below state average. Median age above state average. Renting percentage significantly below state average. Number of rooms per house significantly above state average. House age significantly below state average. Percentage of population with a bachelor's degree or higher above state average. 17,898 64.6% White 4,367 15.8% Asian 3,756 13.5% Hispanic or Latino 872 3.1% Two or more races 779 2.8% Black 30 0.1% American Indian 20 0.07% Some other race
Data:
Median household income ($)
Median household income (% change since 2000)
Household income diversity
Ratio of average income to average house value (%)
Ratio of average income to average rent
Median household income ($) - White
Median household income ($) - Black or African American
Median household income ($) - Asian
Median household income ($) - Hispanic or Latino
Median household income ($) - American Indian and Alaska Native
Median household income ($) - Multirace
Median household income ($) - Other Race
Median household income for houses/condos with a mortgage ($)
Median household income for apartments without a mortgage ($)
Races - White alone (%)
Races - White alone (% change since 2000)
Races - Black alone (%)
Races - Black alone (% change since 2000)
Races - American Indian alone (%)
Races - American Indian alone (% change since 2000)
Races - Asian alone (%)
Races - Asian alone (% change since 2000)
Races - Hispanic (%)
Races - Hispanic (% change since 2000)
Races - Native Hawaiian and Other Pacific Islander alone (%)
Races - Native Hawaiian and Other Pacific Islander alone (% change since 2000)
Races - Two or more races (%)
Races - Two or more races (% change since 2000)
Races - Other race alone (%)
Races - Other race alone (% change since 2000)
Racial diversity
Unemployment (%)
Unemployment (% change since 2000)
Unemployment (%) - White
Unemployment (%) - Black or African American
Unemployment (%) - Asian
Unemployment (%) - Hispanic or Latino
Unemployment (%) - American Indian and Alaska Native
Unemployment (%) - Multirace
Unemployment (%) - Other Race
Population density (people per square mile)
Population - Males (%)
Population - Females (%)
Population - Males (%) - White
Population - Males (%) - Black or African American
Population - Males (%) - Asian
Population - Males (%) - Hispanic or Latino
Population - Males (%) - American Indian and Alaska Native
Population - Males (%) - Multirace
Population - Males (%) - Other Race
Population - Females (%) - White
Population - Females (%) - Black or African American
Population - Females (%) - Asian
Population - Females (%) - Hispanic or Latino
Population - Females (%) - American Indian and Alaska Native
Population - Females (%) - Multirace
Population - Females (%) - Other Race
Coronavirus confirmed cases (Apr 28, 2024)
Deaths caused by coronavirus (Apr 28, 2024)
Coronavirus confirmed cases (per 100k population) (Apr 28, 2024)
Deaths caused by coronavirus (per 100k population) (Apr 28, 2024)
Daily increase in number of cases (Apr 28, 2024)
Weekly increase in number of cases (Apr 28, 2024)
Cases doubled (in days) (Apr 28, 2024)
Hospitalized patients (Apr 18, 2022)
Negative test results (Apr 18, 2022)
Total test results (Apr 18, 2022)
COVID Vaccine doses distributed (per 100k population) (Sep 19, 2023)
COVID Vaccine doses administered (per 100k population) (Sep 19, 2023)
COVID Vaccine doses distributed (Sep 19, 2023)
COVID Vaccine doses administered (Sep 19, 2023)
Likely homosexual households (%)
Likely homosexual households (% change since 2000)
Likely homosexual households - Lesbian couples (%)
Likely homosexual households - Lesbian couples (% change since 2000)
Likely homosexual households - Gay men (%)
Likely homosexual households - Gay men (% change since 2000)
Cost of living index
Median gross rent ($)
Median contract rent ($)
Median monthly housing costs ($)
Median house or condo value ($)
Median house or condo value ($ change since 2000)
Mean house or condo value by units in structure - 1, detached ($)
Mean house or condo value by units in structure - 1, attached ($)
Mean house or condo value by units in structure - 2 ($)
Mean house or condo value by units in structure by units in structure - 3 or 4 ($)
Mean house or condo value by units in structure - 5 or more ($)
Mean house or condo value by units in structure - Boat, RV, van, etc. ($)
Mean house or condo value by units in structure - Mobile home ($)
Median house or condo value ($) - White
Median house or condo value ($) - Black or African American
Median house or condo value ($) - Asian
Median house or condo value ($) - Hispanic or Latino
Median house or condo value ($) - American Indian and Alaska Native
Median house or condo value ($) - Multirace
Median house or condo value ($) - Other Race
Median resident age
Resident age diversity
Median resident age - Males
Median resident age - Females
Median resident age - White
Median resident age - Black or African American
Median resident age - Asian
Median resident age - Hispanic or Latino
Median resident age - American Indian and Alaska Native
Median resident age - Multirace
Median resident age - Other Race
Median resident age - Males - White
Median resident age - Males - Black or African American
Median resident age - Males - Asian
Median resident age - Males - Hispanic or Latino
Median resident age - Males - American Indian and Alaska Native
Median resident age - Males - Multirace
Median resident age - Males - Other Race
Median resident age - Females - White
Median resident age - Females - Black or African American
Median resident age - Females - Asian
Median resident age - Females - Hispanic or Latino
Median resident age - Females - American Indian and Alaska Native
Median resident age - Females - Multirace
Median resident age - Females - Other Race
Commute - mean travel time to work (minutes)
Travel time to work - Less than 5 minutes (%)
Travel time to work - Less than 5 minutes (% change since 2000)
Travel time to work - 5 to 9 minutes (%)
Travel time to work - 5 to 9 minutes (% change since 2000)
Travel time to work - 10 to 19 minutes (%)
Travel time to work - 10 to 19 minutes (% change since 2000)
Travel time to work - 20 to 29 minutes (%)
Travel time to work - 20 to 29 minutes (% change since 2000)
Travel time to work - 30 to 39 minutes (%)
Travel time to work - 30 to 39 minutes (% change since 2000)
Travel time to work - 40 to 59 minutes (%)
Travel time to work - 40 to 59 minutes (% change since 2000)
Travel time to work - 60 to 89 minutes (%)
Travel time to work - 60 to 89 minutes (% change since 2000)
Travel time to work - 90 or more minutes (%)
Travel time to work - 90 or more minutes (% change since 2000)
Marital status - Never married (%)
Marital status - Now married (%)
Marital status - Separated (%)
Marital status - Widowed (%)
Marital status - Divorced (%)
Median family income ($)
Median family income (% change since 2000)
Median non-family income ($)
Median non-family income (% change since 2000)
Median per capita income ($)
Median per capita income (% change since 2000)
Median family income ($) - White
Median family income ($) - Black or African American
Median family income ($) - Asian
Median family income ($) - Hispanic or Latino
Median family income ($) - American Indian and Alaska Native
Median family income ($) - Multirace
Median family income ($) - Other Race
Median year house/condo built
Median year apartment built
Year house built - Built 2005 or later (%)
Year house built - Built 2000 to 2004 (%)
Year house built - Built 1990 to 1999 (%)
Year house built - Built 1980 to 1989 (%)
Year house built - Built 1970 to 1979 (%)
Year house built - Built 1960 to 1969 (%)
Year house built - Built 1950 to 1959 (%)
Year house built - Built 1940 to 1949 (%)
Year house built - Built 1939 or earlier (%)
Average household size
Household density (households per square mile)
Average household size - White
Average household size - Black or African American
Average household size - Asian
Average household size - Hispanic or Latino
Average household size - American Indian and Alaska Native
Average household size - Multirace
Average household size - Other Race
Occupied housing units (%)
Vacant housing units (%)
Owner occupied housing units (%)
Renter occupied housing units (%)
Vacancy status - For rent (%)
Vacancy status - For sale only (%)
Vacancy status - Rented or sold, not occupied (%)
Vacancy status - For seasonal, recreational, or occasional use (%)
Vacancy status - For migrant workers (%)
Vacancy status - Other vacant (%)
Residents with income below the poverty level (%)
Residents with income below 50% of the poverty level (%)
Children below poverty level (%)
Poor families by family type - Married-couple family (%)
Poor families by family type - Male, no wife present (%)
Poor families by family type - Female, no husband present (%)
Poverty status for native-born residents (%)
Poverty status for foreign-born residents (%)
Poverty among high school graduates not in families (%)
Poverty among people who did not graduate high school not in families (%)
Residents with income below the poverty level (%) - White
Residents with income below the poverty level (%) - Black or African American
Residents with income below the poverty level (%) - Asian
Residents with income below the poverty level (%) - Hispanic or Latino
Residents with income below the poverty level (%) - American Indian and Alaska Native
Residents with income below the poverty level (%) - Multirace
Residents with income below the poverty level (%) - Other Race
Air pollution - Air Quality Index (AQI)
Air pollution - CO
Air pollution - NO2
Air pollution - SO2
Air pollution - Ozone
Air pollution - PM10
Air pollution - PM25
Air pollution - Pb
Crime - Murders per 100,000 population
Crime - Rapes per 100,000 population
Crime - Robberies per 100,000 population
Crime - Assaults per 100,000 population
Crime - Burglaries per 100,000 population
Crime - Thefts per 100,000 population
Crime - Auto thefts per 100,000 population
Crime - Arson per 100,000 population
Crime - City-data.com crime index
Crime - Violent crime index
Crime - Property crime index
Crime - Murders per 100,000 population (5 year average)
Crime - Rapes per 100,000 population (5 year average)
Crime - Robberies per 100,000 population (5 year average)
Crime - Assaults per 100,000 population (5 year average)
Crime - Burglaries per 100,000 population (5 year average)
Crime - Thefts per 100,000 population (5 year average)
Crime - Auto thefts per 100,000 population (5 year average)
Crime - Arson per 100,000 population (5 year average)
Crime - City-data.com crime index (5 year average)
Crime - Violent crime index (5 year average)
Crime - Property crime index (5 year average)
1996 Presidential Elections Results (%) - Democratic Party (Clinton)
1996 Presidential Elections Results (%) - Republican Party (Dole)
1996 Presidential Elections Results (%) - Other
2000 Presidential Elections Results (%) - Democratic Party (Gore)
2000 Presidential Elections Results (%) - Republican Party (Bush)
2000 Presidential Elections Results (%) - Other
2004 Presidential Elections Results (%) - Democratic Party (Kerry)
2004 Presidential Elections Results (%) - Republican Party (Bush)
2004 Presidential Elections Results (%) - Other
2008 Presidential Elections Results (%) - Democratic Party (Obama)
2008 Presidential Elections Results (%) - Republican Party (McCain)
2008 Presidential Elections Results (%) - Other
2012 Presidential Elections Results (%) - Democratic Party (Obama)
2012 Presidential Elections Results (%) - Republican Party (Romney)
2012 Presidential Elections Results (%) - Other
2016 Presidential Elections Results (%) - Democratic Party (Clinton)
2016 Presidential Elections Results (%) - Republican Party (Trump)
2016 Presidential Elections Results (%) - Other
2020 Presidential Elections Results (%) - Democratic Party (Biden)
2020 Presidential Elections Results (%) - Republican Party (Trump)
2020 Presidential Elections Results (%) - Other
Ancestries Reported - Arab (%)
Ancestries Reported - Czech (%)
Ancestries Reported - Danish (%)
Ancestries Reported - Dutch (%)
Ancestries Reported - English (%)
Ancestries Reported - French (%)
Ancestries Reported - French Canadian (%)
Ancestries Reported - German (%)
Ancestries Reported - Greek (%)
Ancestries Reported - Hungarian (%)
Ancestries Reported - Irish (%)
Ancestries Reported - Italian (%)
Ancestries Reported - Lithuanian (%)
Ancestries Reported - Norwegian (%)
Ancestries Reported - Polish (%)
Ancestries Reported - Portuguese (%)
Ancestries Reported - Russian (%)
Ancestries Reported - Scotch-Irish (%)
Ancestries Reported - Scottish (%)
Ancestries Reported - Slovak (%)
Ancestries Reported - Subsaharan African (%)
Ancestries Reported - Swedish (%)
Ancestries Reported - Swiss (%)
Ancestries Reported - Ukrainian (%)
Ancestries Reported - United States (%)
Ancestries Reported - Welsh (%)
Ancestries Reported - West Indian (%)
Ancestries Reported - Other (%)
Educational Attainment - No schooling completed (%)
Educational Attainment - Less than high school (%)
Educational Attainment - High school or equivalent (%)
Educational Attainment - Less than 1 year of college (%)
Educational Attainment - 1 or more years of college (%)
Educational Attainment - Associate degree (%)
Educational Attainment - Bachelor's degree (%)
Educational Attainment - Master's degree (%)
Educational Attainment - Professional school degree (%)
Educational Attainment - Doctorate degree (%)
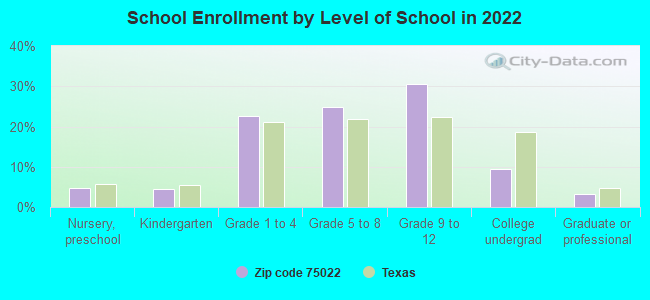
School Enrollment - Nursery, preschool (%)
School Enrollment - Kindergarten (%)
School Enrollment - Grade 1 to 4 (%)
School Enrollment - Grade 5 to 8 (%)
School Enrollment - Grade 9 to 12 (%)
School Enrollment - College undergrad (%)
School Enrollment - Graduate or professional (%)
School Enrollment - Not enrolled in school (%)
School enrollment - Public schools (%)
School enrollment - Private schools (%)
School enrollment - Not enrolled (%)
Median number of rooms in houses and condos
Median number of rooms in apartments
Housing units lacking complete plumbing facilities (%)
Housing units lacking complete kitchen facilities (%)
Density of houses
Urban houses (%)
Rural houses (%)
Households with people 60 years and over (%)
Households with people 65 years and over (%)
Households with people 75 years and over (%)
Households with one or more nonrelatives (%)
Households with no nonrelatives (%)
Population in households (%)
Family households (%)
Nonfamily households (%)
Population in families (%)
Family households with own children (%)
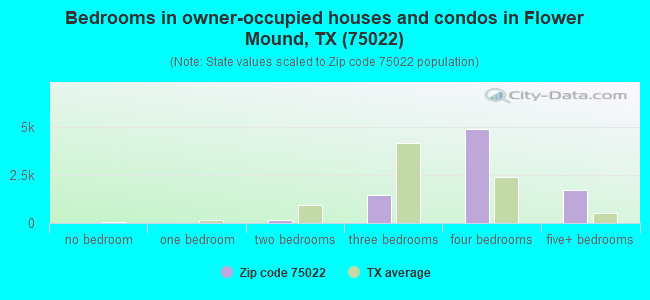
Median number of bedrooms in owner occupied houses
Mean number of bedrooms in owner occupied houses
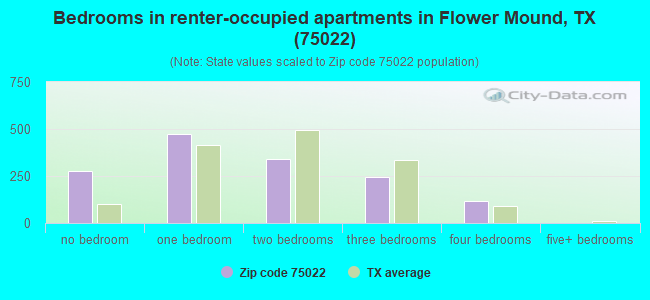
Median number of bedrooms in renter occupied houses
Mean number of bedrooms in renter occupied houses
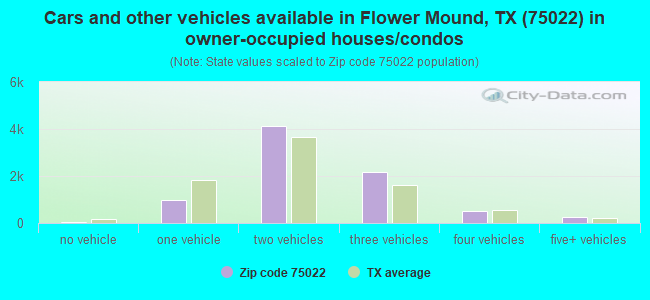
Median number of vehichles in owner occupied houses
Mean number of vehichles in owner occupied houses
Median number of vehichles in renter occupied houses
Mean number of vehichles in renter occupied houses
Mortgage status - with mortgage (%)
Mortgage status - with second mortgage (%)
Mortgage status - with home equity loan (%)
Mortgage status - with both second mortgage and home equity loan (%)
Mortgage status - without a mortgage (%)
Average family size
Average family size - White
Average family size - Black or African American
Average family size - Asian
Average family size - Hispanic or Latino
Average family size - American Indian and Alaska Native
Average family size - Multirace
Average family size - Other Race
Geographical mobility - Same house 1 year ago (%)
Geographical mobility - Moved within same county (%)
Geographical mobility - Moved from different county within same state (%)
Geographical mobility - Moved from different state (%)
Geographical mobility - Moved from abroad (%)
Place of birth - Born in state of residence (%)
Place of birth - Born in other state (%)
Place of birth - Native, outside of US (%)
Place of birth - Foreign born (%)
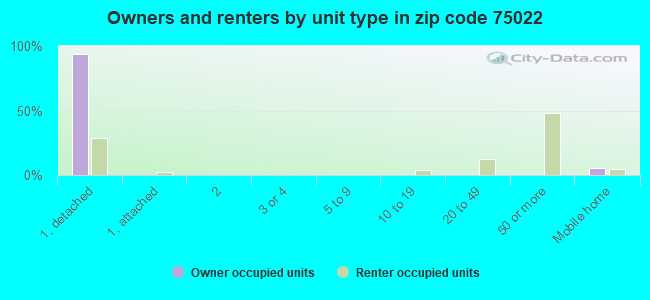
Housing units in structures - 1, detached (%)
Housing units in structures - 1, attached (%)
Housing units in structures - 2 (%)
Housing units in structures - 3 or 4 (%)
Housing units in structures - 5 to 9 (%)
Housing units in structures - 10 to 19 (%)
Housing units in structures - 20 to 49 (%)
Housing units in structures - 50 or more (%)
Housing units in structures - Mobile home (%)
Housing units in structures - Boat, RV, van, etc. (%)
House/condo owner moved in on average (years ago)
Renter moved in on average (years ago)
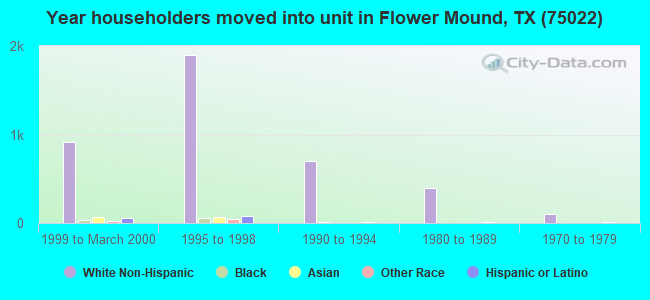
Year householder moved into unit - Moved in 1999 to March 2000 (%)
Year householder moved into unit - Moved in 1995 to 1998 (%)
Year householder moved into unit - Moved in 1990 to 1994 (%)
Year householder moved into unit - Moved in 1980 to 1989 (%)
Year householder moved into unit - Moved in 1970 to 1979 (%)
Year householder moved into unit - Moved in 1969 or earlier (%)
Means of transportation to work - Drove car alone (%)
Means of transportation to work - Carpooled (%)
Means of transportation to work - Public transportation (%)
Means of transportation to work - Bus or trolley bus (%)
Means of transportation to work - Streetcar or trolley car (%)
Means of transportation to work - Subway or elevated (%)
Means of transportation to work - Railroad (%)
Means of transportation to work - Ferryboat (%)
Means of transportation to work - Taxicab (%)
Means of transportation to work - Motorcycle (%)
Means of transportation to work - Bicycle (%)
Means of transportation to work - Walked (%)
Means of transportation to work - Other means (%)
Working at home (%)
Industry diversity
Most Common Industries - Agriculture, forestry, fishing and hunting, and mining (%)
Most Common Industries - Agriculture, forestry, fishing and hunting (%)
Most Common Industries - Mining, quarrying, and oil and gas extraction (%)
Most Common Industries - Construction (%)
Most Common Industries - Manufacturing (%)
Most Common Industries - Wholesale trade (%)
Most Common Industries - Retail trade (%)
Most Common Industries - Transportation and warehousing, and utilities (%)
Most Common Industries - Transportation and warehousing (%)
Most Common Industries - Utilities (%)
Most Common Industries - Information (%)
Most Common Industries - Finance and insurance, and real estate and rental and leasing (%)
Most Common Industries - Finance and insurance (%)
Most Common Industries - Real estate and rental and leasing (%)
Most Common Industries - Professional, scientific, and management, and administrative and waste management services (%)
Most Common Industries - Professional, scientific, and technical services (%)
Most Common Industries - Management of companies and enterprises (%)
Most Common Industries - Administrative and support and waste management services (%)
Most Common Industries - Educational services, and health care and social assistance (%)
Most Common Industries - Educational services (%)
Most Common Industries - Health care and social assistance (%)
Most Common Industries - Arts, entertainment, and recreation, and accommodation and food services (%)
Most Common Industries - Arts, entertainment, and recreation (%)
Most Common Industries - Accommodation and food services (%)
Most Common Industries - Other services, except public administration (%)
Most Common Industries - Public administration (%)
Occupation diversity
Most Common Occupations - Management, business, science, and arts occupations (%)
Most Common Occupations - Management, business, and financial occupations (%)
Most Common Occupations - Management occupations (%)
Most Common Occupations - Business and financial operations occupations (%)
Most Common Occupations - Computer, engineering, and science occupations (%)
Most Common Occupations - Computer and mathematical occupations (%)
Most Common Occupations - Architecture and engineering occupations (%)
Most Common Occupations - Life, physical, and social science occupations (%)
Most Common Occupations - Education, legal, community service, arts, and media occupations (%)
Most Common Occupations - Community and social service occupations (%)
Most Common Occupations - Legal occupations (%)
Most Common Occupations - Education, training, and library occupations (%)
Most Common Occupations - Arts, design, entertainment, sports, and media occupations (%)
Most Common Occupations - Healthcare practitioners and technical occupations (%)
Most Common Occupations - Health diagnosing and treating practitioners and other technical occupations (%)
Most Common Occupations - Health technologists and technicians (%)
Most Common Occupations - Service occupations (%)
Most Common Occupations - Healthcare support occupations (%)
Most Common Occupations - Protective service occupations (%)
Most Common Occupations - Fire fighting and prevention, and other protective service workers including supervisors (%)
Most Common Occupations - Law enforcement workers including supervisors (%)
Most Common Occupations - Food preparation and serving related occupations (%)
Most Common Occupations - Building and grounds cleaning and maintenance occupations (%)
Most Common Occupations - Personal care and service occupations (%)
Most Common Occupations - Sales and office occupations (%)
Most Common Occupations - Sales and related occupations (%)
Most Common Occupations - Office and administrative support occupations (%)
Most Common Occupations - Natural resources, construction, and maintenance occupations (%)
Most Common Occupations - Farming, fishing, and forestry occupations (%)
Most Common Occupations - Construction and extraction occupations (%)
Most Common Occupations - Installation, maintenance, and repair occupations (%)
Most Common Occupations - Production, transportation, and material moving occupations (%)
Most Common Occupations - Production occupations (%)
Most Common Occupations - Transportation occupations (%)
Most Common Occupations - Material moving occupations (%)
People in Group quarters - Institutionalized population (%)
People in Group quarters - Correctional institutions (%)
People in Group quarters - Federal prisons and detention centers (%)
People in Group quarters - Halfway houses (%)
People in Group quarters - Local jails and other confinement facilities (including police lockups) (%)
People in Group quarters - Military disciplinary barracks (%)
People in Group quarters - State prisons (%)
People in Group quarters - Other types of correctional institutions (%)
People in Group quarters - Nursing homes (%)
People in Group quarters - Hospitals/wards, hospices, and schools for the handicapped (%)
People in Group quarters - Hospitals/wards and hospices for chronically ill (%)
People in Group quarters - Hospices or homes for chronically ill (%)
People in Group quarters - Military hospitals or wards for chronically ill (%)
People in Group quarters - Other hospitals or wards for chronically ill (%)
People in Group quarters - Hospitals or wards for drug/alcohol abuse (%)
People in Group quarters - Mental (Psychiatric) hospitals or wards (%)
People in Group quarters - Schools, hospitals, or wards for the mentally retarded (%)
People in Group quarters - Schools, hospitals, or wards for the physically handicapped (%)
People in Group quarters - Institutions for the deaf (%)
People in Group quarters - Institutions for the blind (%)
People in Group quarters - Orthopedic wards and institutions for the physically handicapped (%)
People in Group quarters - Wards in general hospitals for patients who have no usual home elsewhere (%)
People in Group quarters - Wards in military hospitals for patients who have no usual home elsewhere (%)
People in Group quarters - Juvenile institutions (%)
People in Group quarters - Long-term care (%)
People in Group quarters - Homes for abused, dependent, and neglected children (%)
People in Group quarters - Residential treatment centers for emotionally disturbed children (%)
People in Group quarters - Training schools for juvenile delinquents (%)
People in Group quarters - Short-term care, detention or diagnostic centers for delinquent children (%)
People in Group quarters - Type of juvenile institution unknown (%)
People in Group quarters - Noninstitutionalized population (%)
People in Group quarters - College dormitories (includes college quarters off campus) (%)
People in Group quarters - Military quarters (%)
People in Group quarters - On base (%)
People in Group quarters - Barracks, unaccompanied personnel housing (UPH), (Enlisted/Officer), ;and similar group living quarters for military personnel (%)
People in Group quarters - Transient quarters for temporary residents (%)
People in Group quarters - Military ships (%)
People in Group quarters - Group homes (%)
People in Group quarters - Homes or halfway houses for drug/alcohol abuse (%)
People in Group quarters - Homes for the mentally ill (%)
People in Group quarters - Homes for the mentally retarded (%)
People in Group quarters - Homes for the physically handicapped (%)
People in Group quarters - Other group homes (%)
People in Group quarters - Religious group quarters (%)
People in Group quarters - Dormitories (%)
People in Group quarters - Agriculture workers' dormitories on farms (%)
People in Group quarters - Job Corps and vocational training facilities (%)
People in Group quarters - Other workers' dormitories (%)
People in Group quarters - Crews of maritime vessels (%)
People in Group quarters - Other nonhousehold living situations (%)
People in Group quarters - Other noninstitutional group quarters (%)
Residents speaking English at home (%)
Residents speaking English at home - Born in the United States (%)
Residents speaking English at home - Native, born elsewhere (%)
Residents speaking English at home - Foreign born (%)
Residents speaking Spanish at home (%)
Residents speaking Spanish at home - Born in the United States (%)
Residents speaking Spanish at home - Native, born elsewhere (%)
Residents speaking Spanish at home - Foreign born (%)
Residents speaking other language at home (%)
Residents speaking other language at home - Born in the United States (%)
Residents speaking other language at home - Native, born elsewhere (%)
Residents speaking other language at home - Foreign born (%)
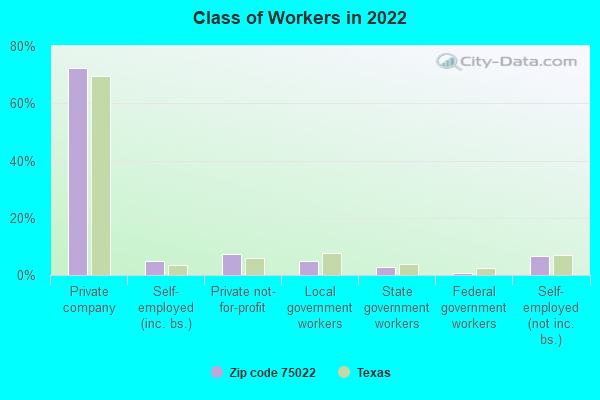
Class of Workers - Employee of private company (%)
Class of Workers - Self-employed in own incorporated business (%)
Class of Workers - Private not-for-profit wage and salary workers (%)
Class of Workers - Local government workers (%)
Class of Workers - State government workers (%)
Class of Workers - Federal government workers (%)
Class of Workers - Self-employed workers in own not incorporated business and Unpaid family workers (%)
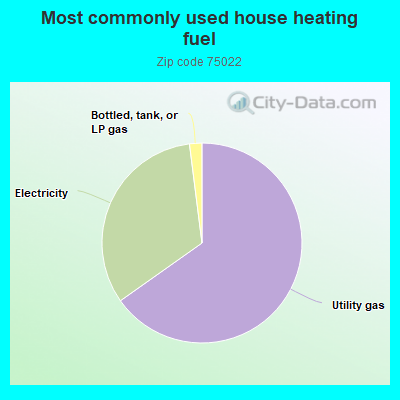
House heating fuel used in houses and condos - Utility gas (%)
House heating fuel used in houses and condos - Bottled, tank, or LP gas (%)
House heating fuel used in houses and condos - Electricity (%)
House heating fuel used in houses and condos - Fuel oil, kerosene, etc. (%)
House heating fuel used in houses and condos - Coal or coke (%)
House heating fuel used in houses and condos - Wood (%)
House heating fuel used in houses and condos - Solar energy (%)
House heating fuel used in houses and condos - Other fuel (%)
House heating fuel used in houses and condos - No fuel used (%)
House heating fuel used in apartments - Utility gas (%)
House heating fuel used in apartments - Bottled, tank, or LP gas (%)
House heating fuel used in apartments - Electricity (%)
House heating fuel used in apartments - Fuel oil, kerosene, etc. (%)
House heating fuel used in apartments - Coal or coke (%)
House heating fuel used in apartments - Wood (%)
House heating fuel used in apartments - Solar energy (%)
House heating fuel used in apartments - Other fuel (%)
House heating fuel used in apartments - No fuel used (%)
Armed forces status - In Armed Forces (%)
Armed forces status - Civilian (%)
Armed forces status - Civilian - Veteran (%)
Armed forces status - Civilian - Nonveteran (%)
Fatal accidents locations in years 2005-2021
Fatal accidents locations in 2005
Fatal accidents locations in 2006
Fatal accidents locations in 2007
Fatal accidents locations in 2008
Fatal accidents locations in 2009
Fatal accidents locations in 2010
Fatal accidents locations in 2011
Fatal accidents locations in 2012
Fatal accidents locations in 2013
Fatal accidents locations in 2014
Fatal accidents locations in 2015
Fatal accidents locations in 2016
Fatal accidents locations in 2017
Fatal accidents locations in 2018
Fatal accidents locations in 2019
Fatal accidents locations in 2020
Fatal accidents locations in 2021
Alcohol use - People drinking some alcohol every month (%)
Alcohol use - People not drinking at all (%)
Alcohol use - Average days/month drinking alcohol
Alcohol use - Average drinks/week
Alcohol use - Average days/year people drink much
Audiometry - Average condition of hearing (%)
Audiometry - People that can hear a whisper from across a quiet room (%)
Audiometry - People that can hear normal voice from across a quiet room (%)
Audiometry - Ears ringing, roaring, buzzing (%)
Audiometry - Had a job exposure to loud noise (%)
Audiometry - Had off-work exposure to loud noise (%)
Blood Pressure & Cholesterol - Has high blood pressure (%)
Blood Pressure & Cholesterol - Checking blood pressure at home (%)
Blood Pressure & Cholesterol - Frequently checking blood cholesterol (%)
Blood Pressure & Cholesterol - Has high cholesterol level (%)
Consumer Behavior - Money monthly spent on food at supermarket/grocery store
Consumer Behavior - Money monthly spent on food at other stores
Consumer Behavior - Money monthly spent on eating out
Consumer Behavior - Money monthly spent on carryout/delivered foods
Consumer Behavior - Income spent on food at supermarket/grocery store (%)
Consumer Behavior - Income spent on food at other stores (%)
Consumer Behavior - Income spent on eating out (%)
Consumer Behavior - Income spent on carryout/delivered foods (%)
Current Health Status - General health condition (%)
Current Health Status - Blood donors (%)
Current Health Status - Has blood ever tested for HIV virus (%)
Current Health Status - Left-handed people (%)
Dermatology - People using sunscreen (%)
Diabetes - Diabetics (%)
Diabetes - Had a blood test for high blood sugar (%)
Diabetes - People taking insulin (%)
Diet Behavior & Nutrition - Diet health (%)
Diet Behavior & Nutrition - Milk product consumption (# of products/month)
Diet Behavior & Nutrition - Meals not home prepared (#/week)
Diet Behavior & Nutrition - Meals from fast food or pizza place (#/week)
Diet Behavior & Nutrition - Ready-to-eat foods (#/month)
Diet Behavior & Nutrition - Frozen meals/pizza (#/month)
Drug Use - People that ever used marijuana or hashish (%)
Drug Use - Ever used hard drugs (%)
Drug Use - Ever used any form of cocaine (%)
Drug Use - Ever used heroin (%)
Drug Use - Ever used methamphetamine (%)
Health Insurance - People covered by health insurance (%)
Kidney Conditions-Urology - Avg. # of times urinating at night
Medical Conditions - People with asthma (%)
Medical Conditions - People with anemia (%)
Medical Conditions - People with psoriasis (%)
Medical Conditions - People with overweight (%)
Medical Conditions - Elderly people having difficulties in thinking or remembering (%)
Medical Conditions - People who ever received blood transfusion (%)
Medical Conditions - People having trouble seeing even with glass/contacts (%)
Medical Conditions - People with arthritis (%)
Medical Conditions - People with gout (%)
Medical Conditions - People with congestive heart failure (%)
Medical Conditions - People with coronary heart disease (%)
Medical Conditions - People with angina pectoris (%)
Medical Conditions - People who ever had heart attack (%)
Medical Conditions - People who ever had stroke (%)
Medical Conditions - People with emphysema (%)
Medical Conditions - People with thyroid problem (%)
Medical Conditions - People with chronic bronchitis (%)
Medical Conditions - People with any liver condition (%)
Medical Conditions - People who ever had cancer or malignancy (%)
Mental Health - People who have little interest in doing things (%)
Mental Health - People feeling down, depressed, or hopeless (%)
Mental Health - People who have trouble sleeping or sleeping too much (%)
Mental Health - People feeling tired or having little energy (%)
Mental Health - People with poor appetite or overeating (%)
Mental Health - People feeling bad about themself (%)
Mental Health - People who have trouble concentrating on things (%)
Mental Health - People moving or speaking slowly or too fast (%)
Mental Health - People having thoughts they would be better off dead (%)
Oral Health - Average years since last visit a dentist
Oral Health - People embarrassed because of mouth (%)
Oral Health - People with gum disease (%)
Oral Health - General health of teeth and gums (%)
Oral Health - Average days a week using dental floss/device
Oral Health - Average days a week using mouthwash for dental problem
Oral Health - Average number of teeth
Pesticide Use - Households using pesticides to control insects (%)
Pesticide Use - Households using pesticides to kill weeds (%)
Physical Activity - People doing vigorous-intensity work activities (%)
Physical Activity - People doing moderate-intensity work activities (%)
Physical Activity - People walking or bicycling (%)
Physical Activity - People doing vigorous-intensity recreational activities (%)
Physical Activity - People doing moderate-intensity recreational activities (%)
Physical Activity - Average hours a day doing sedentary activities
Physical Activity - Average hours a day watching TV or videos
Physical Activity - Average hours a day using computer
Physical Functioning - People having limitations keeping them from working (%)
Physical Functioning - People limited in amount of work they can do (%)
Physical Functioning - People that need special equipment to walk (%)
Physical Functioning - People experiencing confusion/memory problems (%)
Physical Functioning - People requiring special healthcare equipment (%)
Prescription Medications - Average number of prescription medicines taking
Preventive Aspirin Use - Adults 40+ taking low-dose aspirin (%)
Reproductive Health - Vaginal deliveries (%)
Reproductive Health - Cesarean deliveries (%)
Reproductive Health - Deliveries resulted in a live birth (%)
Reproductive Health - Pregnancies resulted in a delivery (%)
Reproductive Health - Women breastfeeding newborns (%)
Reproductive Health - Women that had a hysterectomy (%)
Reproductive Health - Women that had both ovaries removed (%)
Reproductive Health - Women that have ever taken birth control pills (%)
Reproductive Health - Women taking birth control pills (%)
Reproductive Health - Women that have ever used Depo-Provera or injectables (%)
Reproductive Health - Women that have ever used female hormones (%)
Sexual Behavior - People 18+ that ever had sex (vaginal, anal, or oral) (%)
Sexual Behavior - Males 18+ that ever had vaginal sex with a woman (%)
Sexual Behavior - Males 18+ that ever performed oral sex on a woman (%)
Sexual Behavior - Males 18+ that ever had anal sex with a woman (%)
Sexual Behavior - Males 18+ that ever had any sex with a man (%)
Sexual Behavior - Females 18+ that ever had vaginal sex with a man (%)
Sexual Behavior - Females 18+ that ever performed oral sex on a man (%)
Sexual Behavior - Females 18+ that ever had anal sex with a man (%)
Sexual Behavior - Females 18+ that ever had any kind of sex with a woman (%)
Sexual Behavior - Average age people first had sex
Sexual Behavior - Average number of female sex partners in lifetime (males 18+)
Sexual Behavior - Average number of female vaginal sex partners in lifetime (males 18+)
Sexual Behavior - Average age people first performed oral sex on a woman (18+)
Sexual Behavior - Average number of woman performed oral sex on in lifetime (18+)
Sexual Behavior - Average number of male sex partners in lifetime (males 18+)
Sexual Behavior - Average number of male anal sex partners in lifetime (males 18+)
Sexual Behavior - Average age people first performed oral sex on a man (18+)
Sexual Behavior - Average number of male oral sex partners in lifetime (18+)
Sexual Behavior - People using protection when performing oral sex (%)
Sexual Behavior - Average number of times people have vaginal or anal sex a year
Sexual Behavior - People having sex without condom (%)
Sexual Behavior - Average number of male sex partners in lifetime (females 18+)
Sexual Behavior - Average number of male vaginal sex partners in lifetime (females 18+)
Sexual Behavior - Average number of female sex partners in lifetime (females 18+)
Sexual Behavior - Circumcised males 18+ (%)
Sleep Disorders - Average hours sleeping at night
Sleep Disorders - People that has trouble sleeping (%)
Smoking-Cigarette Use - People smoking cigarettes (%)
Taste & Smell - People 40+ having problems with smell (%)
Taste & Smell - People 40+ having problems with taste (%)
Taste & Smell - People 40+ that ever had wisdom teeth removed (%)
Taste & Smell - People 40+ that ever had tonsils teeth removed (%)
Taste & Smell - People 40+ that ever had a loss of consciousness because of a head injury (%)
Taste & Smell - People 40+ that ever had a broken nose or other serious injury to face or skull (%)
Taste & Smell - People 40+ that ever had two or more sinus infections (%)
Weight - Average height (inches)
Weight - Average weight (pounds)
Weight - Average BMI
Weight - People that are obese (%)
Weight - People that ever were obese (%)
Weight - People trying to lose weight (%)
Urban population: 25,256
Rural population: 2,468
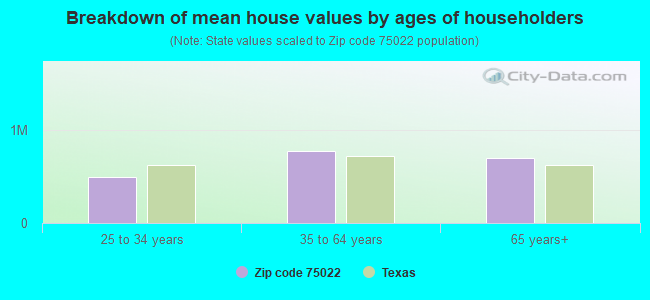
Estimated median house/condo value in 2022: $664,431
75022:
$664,431Texas:
$275,400
According to our research of Texas and other state lists, there were 8 registered sex offenders living in 75022 zip code as of April 28, 2024 . The ratio of all residents to sex offenders in zip code 75022 is 3,047 to 1.The ratio of registered sex offenders to all residents in this zip code is much lower than the state average.
Median resident age: This zip code:
42.0 yearsTexas median age:
35.6 years
Average household size: This zip code:
2.9 peopleTexas:
2.6 people
Averages for the 2020 tax year for zip code 75022, filed in 2021:
Average Adjusted Gross Income (AGI) in 2020: $206,107 (Individual Income Tax Returns) Here:
$206,107State:
$77,054
Salary/wage: $157,533 (reported on 85.5% of returns )Here:
$157,533State:
$62,766
(% of AGI for various income ranges: 1132.2% for AGIs below $25k , 3613.9% for AGIs $25k-50k , 6586.4% for AGIs $50k-75k , 9965.7% for AGIs $75k-100k , 20791.7% for AGIs $100k-200k , 96156.0% for AGIs over 200k ) Taxable interest for individuals: $6,928 (reported on 48.5% of returns )This zip code:
$6,928Texas:
$2,665
(% of AGI for various income ranges: 19.2% for AGIs below $25k , 91.0% for AGIs $25k-50k , 81.6% for AGIs $50k-75k , 132.6% for AGIs $75k-100k , 168.0% for AGIs $100k-200k , 2960.9% for AGIs over 200k ) Ordinary dividends: $11,422 (reported on 43.9% of returns )Here:
$11,422State:
$10,044
(% of AGI for various income ranges: 40.1% for AGIs below $25k , 127.8% for AGIs $25k-50k , 185.6% for AGIs $50k-75k , 370.9% for AGIs $75k-100k , 465.2% for AGIs $100k-200k , 4024.3% for AGIs over 200k ) Net capital gain/loss in AGI: +$57,911 (reported on 42.2% of returns )Here:
+$57,911State:
+$39,590
(% of AGI for various income ranges: 36.5% for AGIs below $25k , 125.1% for AGIs $25k-50k , 171.2% for AGIs $50k-75k , 330.9% for AGIs $75k-100k , 710.0% for AGIs $100k-200k , 23248.3% for AGIs over 200k ) Profit/loss from business: +$27,596 (reported on 20.3% of returns )Here:
+$27,596State:
+$10,888
(% of AGI for various income ranges: 85.2% for AGIs below $25k , 234.8% for AGIs $25k-50k , 214.1% for AGIs $50k-75k , 587.8% for AGIs $75k-100k , 845.4% for AGIs $100k-200k , 3876.5% for AGIs over 200k ) Taxable individual retirement arrangement distribution: $38,636 (reported on 10.4% of returns )75022:
$38,636Texas:
$24,740
(% of AGI for various income ranges: 43.9% for AGIs below $25k , 194.5% for AGIs $25k-50k , 318.1% for AGIs $50k-75k , 723.7% for AGIs $75k-100k , 868.6% for AGIs $100k-200k , 2220.9% for AGIs over 200k ) Self-employed (Keogh) retirement plans: $28,187 (reported on 2.0% of returns )75022:
$28,187Texas:
$29,298
(% of AGI for various income ranges: 79.5% for AGIs $100k-200k , 450.1% for AGIs over 200k ) Total itemized deductions: $52,067 (reported on 22.9% of returns )Here:
$52,067State:
$40,428
(% of AGI for various income ranges: 82.6% for AGIs below $25k , 237.6% for AGIs $25k-50k , 435.0% for AGIs $50k-75k , 939.6% for AGIs $75k-100k , 1510.7% for AGIs $100k-200k , 9082.9% for AGIs over 200k ) Charity contributions: $22,516 (reported on 20.3% of returns )Here:
$22,516State:
$18,201
(% of AGI for various income ranges: 8.1% for AGIs below $25k , 33.8% for AGIs $25k-50k , 70.3% for AGIs $50k-75k , 166.5% for AGIs $75k-100k , 384.3% for AGIs $100k-200k , 3935.8% for AGIs over 200k ) Taxes paid: $9,284 (reported on 22.8% of returns )(% of AGI for various income ranges: 18.7% for AGIs below $25k , 56.0% for AGIs $25k-50k , 116.3% for AGIs $50k-75k , 250.2% for AGIs $75k-100k , 419.8% for AGIs $100k-200k , 1344.9% for AGIs over 200k ) Earned income credit: $1,740 (reported on 3.8% of returns )(% of AGI for various income ranges: 29.8% for AGIs below $25k , 28.3% for AGIs $25k-50k ) Percentage of individuals using paid preparers for their 2020 taxes: 92.8%(% for various income ranges: 91.5% for AGIs below $25k , 91.6% for AGIs $25k-50k , 92.4% for AGIs $50k-75k , 92.1% for AGIs $75k-100k , 93.4% for AGIs $100k-200k , 93.9% for AGIs over 200k )
Averages for the 2012 tax year for zip code 75022, filed in 2013:
Average Adjusted Gross Income (AGI) in 2012: $165,211 (Individual Income Tax Returns) Here:
$165,211State:
$65,384
Salary/wage: $131,733 (reported on 88.3% of returns )Here:
$131,733State:
$52,524
(% of AGI for various income ranges: 83.0% for AGIs below $25k , 75.2% for AGIs $25k-50k , 71.6% for AGIs $50k-75k , 77.2% for AGIs $75k-100k , 86.8% for AGIs $100k-200k , 62.5% for AGIs over 200k ) Taxable interest for individuals: $2,272 (reported on 53.2% of returns )This zip code:
$2,272Texas:
$2,372
(% of AGI for various income ranges: 1.3% for AGIs below $25k , 1.6% for AGIs $25k-50k , 1.2% for AGIs $50k-75k , 0.6% for AGIs $75k-100k , 0.5% for AGIs $100k-200k , 0.8% for AGIs over 200k ) Ordinary dividends: $8,310 (reported on 41.3% of returns )(% of AGI for various income ranges: 4.8% for AGIs below $25k , 3.1% for AGIs $25k-50k , 2.2% for AGIs $50k-75k , 1.8% for AGIs $75k-100k , 1.0% for AGIs $100k-200k , 2.4% for AGIs over 200k ) Net capital gain/loss in AGI: +$46,291 (reported on 37.1% of returns )Here:
+$46,291State:
+$35,319
(% of AGI for various income ranges: 1.1% for AGIs below $25k , 0.5% for AGIs $25k-50k , 0.9% for AGIs $50k-75k , 1.3% for AGIs $75k-100k , 0.8% for AGIs $100k-200k , 16.0% for AGIs over 200k ) Profit/loss from business: +$26,295 (reported on 20.8% of returns )Here:
+$26,295State:
+$13,732
(% of AGI for various income ranges: 6.6% for AGIs below $25k , 7.6% for AGIs $25k-50k , 4.3% for AGIs $50k-75k , 5.6% for AGIs $75k-100k , 2.9% for AGIs $100k-200k , 3.1% for AGIs over 200k ) Taxable individual retirement arrangement distribution: $30,396 (reported on 9.9% of returns )75022:
$30,396Texas:
$19,511
(% of AGI for various income ranges: 2.6% for AGIs below $25k , 3.1% for AGIs $25k-50k , 4.7% for AGIs $50k-75k , 3.5% for AGIs $75k-100k , 2.4% for AGIs $100k-200k , 1.3% for AGIs over 200k ) Self-employment retirement plans: $22,500 (reported on 1.8% of returns )75022:
$22,500Texas:
$23,938
(% of AGI for various income ranges: 0.2% for AGIs $100k-200k , 0.3% for AGIs over 200k ) Total itemized deductions: $32,477 (13% of AGI, reported on 60.2% of returns )Here:
$32,477State:
$24,724
Here:
13.2% of AGIState:
15.9% of AGI
(% of AGI for various income ranges: 15.8% for AGIs below $25k , 17.7% for AGIs $25k-50k , 19.7% for AGIs $50k-75k , 18.4% for AGIs $75k-100k , 15.4% for AGIs $100k-200k , 9.2% for AGIs over 200k ) Charity contributions: $8,103 (reported on 53.5% of returns )(% of AGI for various income ranges: 0.8% for AGIs below $25k , 1.9% for AGIs $25k-50k , 2.5% for AGIs $50k-75k , 2.8% for AGIs $75k-100k , 2.6% for AGIs $100k-200k , 2.7% for AGIs over 200k ) Taxes paid: $11,102 (reported on 59.7% of returns )75022:
$11,102State:
$6,921
(% of AGI for various income ranges: 3.7% for AGIs below $25k , 5.1% for AGIs $25k-50k , 6.3% for AGIs $50k-75k , 6.1% for AGIs $75k-100k , 5.6% for AGIs $100k-200k , 3.1% for AGIs over 200k ) Earned income credit: $1,800 (reported on 3.9% of returns )(% of AGI for various income ranges: 2.3% for AGIs below $25k , 0.6% for AGIs $25k-50k ) Percentage of individuals using paid preparers for their 2012 taxes: 47.0%(% for various income ranges: 36.7% for AGIs below $25k , 45.9% for AGIs $25k-50k , 50.8% for AGIs $50k-75k , 48.7% for AGIs $75k-100k , 44.8% for AGIs $100k-200k , 61.2% for AGIs over 200k )
Averages for the 2004 tax year for zip code 75022, filed in 2005:
Average Adjusted Gross Income (AGI) in 2004: $127,327 (Individual Income Tax Returns) Here:
$127,327State:
$47,881
Salary/wage: $111,334 (reported on 89.9% of returns )Here:
$111,334State:
$41,947
(% of AGI for various income ranges: 78.0% for AGIs $10k-25k , 78.4% for AGIs $25k-50k , 80.6% for AGIs $50k-75k , 87.6% for AGIs $75k-100k , 75.8% for AGIs over 100k ) Taxable interest for individuals: $2,756 (reported on 64.7% of returns )This zip code:
$2,756Texas:
$2,255
(% of AGI for various income ranges: 2.8% for AGIs $10k-25k , 1.9% for AGIs $25k-50k , 1.3% for AGIs $50k-75k , 1.1% for AGIs $75k-100k , 1.2% for AGIs over 100k ) Taxable dividends: $3,225 (reported on 47.0% of returns )(% of AGI for various income ranges: 1.7% for AGIs $10k-25k , 2.1% for AGIs $25k-50k , 1.7% for AGIs $50k-75k , 1.1% for AGIs $75k-100k , 1.1% for AGIs over 100k ) Net capital gain/loss: +$19,978 (reported on 43.1% of returns )Here:
+$19,978State:
+$16,110
(% of AGI for various income ranges: 1.7% for AGIs $10k-25k , 0.7% for AGIs $25k-50k , 1.2% for AGIs $50k-75k , 0.6% for AGIs $75k-100k , 7.8% for AGIs over 100k ) Profit/loss from business: +$18,652 (reported on 20.2% of returns )Here:
+$18,652State:
+$11,013
(% of AGI for various income ranges: 6.2% for AGIs $10k-25k , 6.5% for AGIs $25k-50k , 6.1% for AGIs $50k-75k , 3.5% for AGIs $75k-100k , 2.5% for AGIs over 100k ) IRA payment deduction: $3,315 (reported on 4.0% of returns )(% of AGI for various income ranges: 0.4% for AGIs $25k-50k , 0.3% for AGIs $50k-75k , 0.2% for AGIs $75k-100k , 0.1% for AGIs over 100k ) Self-employed pension: $15,693 (reported on 1.7% of returns )Here:
$15,693Texas:
$16,401
(% of AGI for various income ranges: 0.3% for AGIs $50k-75k , 0.2% for AGIs $75k-100k , 0.2% for AGIs over 100k ) Total itemized deductions: $27,908 (16% of AGI, reported on 66.8% of returns )Here:
$27,908State:
$19,631
Here:
16.3% of AGIState:
18.9% of AGI
(% of AGI for various income ranges: 18.2% for AGIs $10k-25k , 23.7% for AGIs $25k-50k , 25.1% for AGIs $50k-75k , 22.4% for AGIs $75k-100k , 12.7% for AGIs over 100k ) Charity contributions deductions: $5,923 (3% of AGI, reported on 61.1% of returns )Here:
3.4% of AGIState:
4.2% of AGI
(% of AGI for various income ranges: 1.2% for AGIs $10k-25k , 2.6% for AGIs $25k-50k , 3.0% for AGIs $50k-75k , 2.9% for AGIs $75k-100k , 2.8% for AGIs over 100k ) Total tax: $26,789 (reported on 85.0% of returns )75022:
$26,789State:
$9,058
(% of AGI for various income ranges: 5.0% for AGIs $10k-25k , 7.3% for AGIs $25k-50k , 8.5% for AGIs $50k-75k , 9.3% for AGIs $75k-100k , 19.4% for AGIs over 100k ) Earned income credit: $1,487 (reported on 3.3% of returns )Percentage of individuals using paid preparers for their 2004 taxes: 47.2%(% for various income ranges: 38.7% for AGIs below $10k , 45.4% for AGIs $10k-25k , 52.1% for AGIs $25k-50k , 49.3% for AGIs $50k-75k , 46.0% for AGIs $75k-100k , 49.5% for AGIs over 100k )
Estimated median household income in 2022: This zip code:
$178,042Texas:
$72,284
Nearest zip codes: 75028 ,
76092 ,
75077 ,
76226 ,
76262 ,
76210 .
Grapevine Zip Code Map
Percentage of family households: This zip code:
65.8%Texas:
50.5%
Percentage of households with unmarried partners: This zip code:
1.7%Texas:
48.7%
Likely homosexual households (counted as self-reported same-sex unmarried-partner households)
Lesbian couples: 0.2% of all households Gay men: 0.1% of all households
Household received Food Stamps/SNAP in the past 12 months: 337Household did not receive Food Stamps/SNAP in the past 12 months: 9,166
Women who had a birth in the past 12 months: 358 (365 now married , 0 unmarried) Women who did not have a birth in the past 12 months: 5,771 (3,143 now married , 2,608 unmarried)
Housing units in zip code 75022 with a mortgage: 5,365 (510
second mortgage , 352
both second mortgage and home equity loan )
Houses without a mortgage: 135
Median monthly owner costs for units with a mortgage: $3,417
Median monthly owner costs for units without a mortgage: $1,318
Residents with income below the poverty level in 2022:
This zip code:
5.7%Whole state:
14.0%
Residents with income below 50% of the poverty level in 2022:
This zip code:
1.4%Whole state:
7.4%
Median number of rooms in houses and condos: Median number of rooms in apartments:
Year house built (houses)
57 2020 or later2,542 2010 to 20192,579 2000 to 20093,093 1990 to 1999661 1980 to 1989444 1970 to 1979148 1960 to 196954 1950 to 19590 1940 to 19497 1939 or earlier
Zip code 75022 household income distribution in 2022 53 Less than $10,00026 $10,000 to $14,99953 $15,000 to $19,999244 $20,000 to $24,99986 $25,000 to $29,99946 $30,000 to $34,999249 $35,000 to $39,99973 $40,000 to $44,99976 $45,000 to $49,999477 $50,000 to $59,999410 $60,000 to $74,999968 $75,000 to $99,999634 $100,000 to $124,999529 $125,000 to $149,9991,224 $150,000 to $199,9994,374 $200,000 or moreEstimate of home value of owner-occupied houses/condos in 2022 in zip code 75022 208 Less than $10,000197 $10,000 to $14,9995 $25,000 to $29,99979 $40,000 to $49,9993 $50,000 to $59,99920 $100,000 to $124,99912 $125,000 to $149,99946 $150,000 to $174,99917 $175,000 to $199,99936 $200,000 to $249,999115 $250,000 to $299,999903 $300,000 to $399,9991,860 $400,000 to $499,9994,037 $500,000 to $749,9991,494 $750,000 to $999,999939 $1,000,000 to $1,499,999100 $1,500,000 to $1,999,999204 $2,000,000 or moreRent paid by renters in 2022 in zip code 75022 11 $500 to $54988 $600 to $64952 $800 to $89926 $900 to $99920 $1,000 to $1,249176 $1,250 to $1,499527 $1,500 to $1,999224 $2,000 to $2,499348 $2,500 to $2,99936 $3,000 to $3,49958 $3,500 or more24 No cash rent
Median gross rent in 2022: $1,978.
Median price asked for vacant for-sale houses and condos in 2022: $294,790.
Estimated median house (or condo) value in 2022 for: White Non-Hispanic householders: $678,331Black or African American householders: $604,938American Indian or Alaska Native householders: $1,737,529Asian householders: $671,937Some other race householders: $515,698Two or more races householders: $582,142Hispanic or Latino householders: $605,772Estimated median house or condo value in 2022: $664,431
75022:
$664,431Texas:
$275,400
Lower value quartile - upper value quartile: $504,862 - $846,947
Mean price in 2022: Detached houses: $497,876Here:
$497,876State:
$369,058
Townhouses or other attached units: $314,444Here:
$314,444State:
$327,631
In 2-unit structures: $70,248Here:
$70,248State:
$374,947
In 3-to-4-unit structures: $129,877Here:
$129,877State:
$209,652
In 5-or-more-unit structures: $300,481Here:
$300,481State:
$413,944
Mobile homes: $109,416Here:
$109,416State:
$124,413
Occupied boats, RVs, vans, etc.: $425,779Here:
$425,779State:
$73,921
Housing units in structures:
One, detached: 8,075One, attached: 4010 to 19: 7120 to 49: 25950 or more: 832Mobile homes: 474Unemployment : 2.7%
Means of transportation to work in zip code 75022 62.1% 9,026 Drove a car alone5.3% 770 Carpooled0.1% 9 Bicycle1.3% 185 Walked1.8% 256 Other means35.0% 5,086 Worked at homeTravel time to work (commute) in zip code 75022 152 Less than 5 minutes711 5 to 9 minutes1,272 10 to 14 minutes1,034 15 to 19 minutes1,975 20 to 24 minutes812 25 to 29 minutes1,602 30 to 34 minutes525 35 to 39 minutes900 40 to 44 minutes830 45 to 59 minutes234 60 to 89 minutes207 90 or more minutes
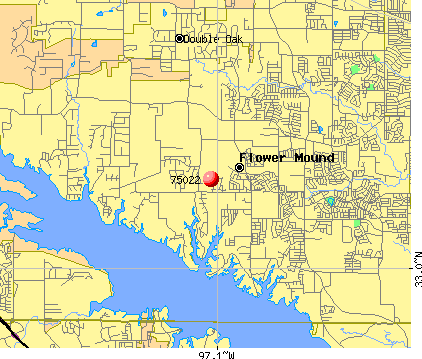
Neighborhoods in zip code 75022: Percentage of zip code residents living and working in this county: 53.9%
Household type by relationship:
Households: 27,725
Male householders: 6,282 (768 living alone ), Female householders: 3,238 (807 living alone )6,924 spouses (6,886 opposite-sex spouses ), 211 unmarried partners , (211 opposite-sex unmarried partners ), 9,753 children (9,515 natural , 156 adopted , 79 stepchildren ), 127 grandchildren , 128 brothers or sisters , 285 parents , 0 foster children , 158 other relatives , 459 non-relatives In group quarters: 124 (-1 institutionalized population )
Size of family households: 2,837 2-persons , 1,732 3-persons , 2,011 4-persons , 610 5-persons , 194 6-persons , 292 7-or-more-persons
Size of nonfamily households: 1,575 1-person , 177 2-persons , 10 3-persons , 40 4-persons
6,666 married couples with children. single-parent households (247 men , 400 women ).
75.7% of residents of 75022 zip code speak English at home. of residents speak Spanish at home (49% very well, 34% well, 7% not well, 10% not at all ).of residents speak other Indo-European language at home (95% very well, 4% well, 1% not well ).of residents speak Asian or Pacific Island language at home (78% very well, 15% well, 7% not well ).of residents speak other language at home (100% very well ).
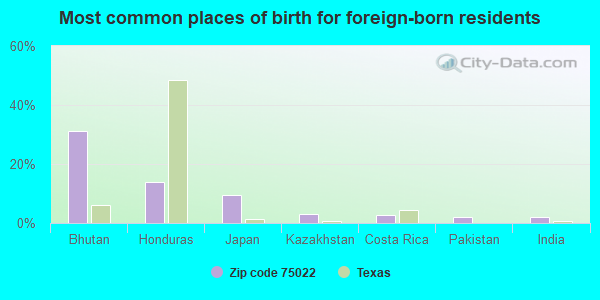
Foreign born population: 4,906 (17.7%)
(58.5%
of them are naturalized citizens )
This zip code:
17.7%Whole state:
17.2%
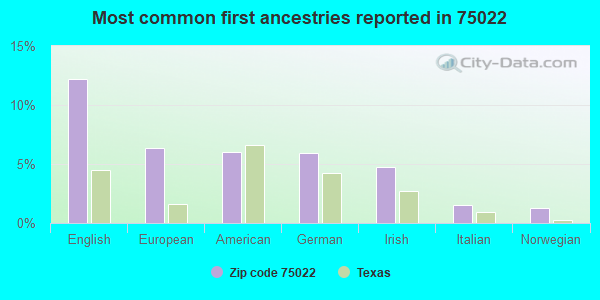
31% Bhutan 14% Honduras 10% Japan 3% Kazakhstan 3% Costa Rica 2% Pakistan 2% India 12% English 6% European 6% American 6% German 5% Irish 1% Italian 1% Norwegian
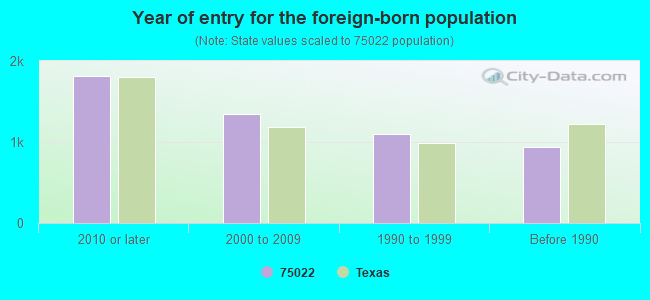
Year of entry for the foreign-born population
1,819 2010 or later 1,340 2000 to 2009 1,102 1990 to 1999 940 Before 1990
There are
114 Medical Specialists in Zip Code 75022 .
Housing units lacking complete plumbing facilities: 0.5%
Housing units lacking complete kitchen facilities: 1.3%
65.2% Utility gas 32.8% Electricity 2.0% Bottled, tank, or LP gas
Place of birth for U.S.-born residents:
This state: 11,333Northeast: 1,804Midwest: 3,461South: 3,694West: 2,414
31% of the 75022 zip code residents lived in the same house 5 years ago.
Out of people who lived in different houses, 26% lived in this county.
Out of people who lived in different counties, 50% lived in Texas.
86% of the 75022 zip code residents lived in the same house 1 year ago.
Out of people who lived in different houses, 47% moved from this county.
Out of people who lived in different houses, 29% moved from different county within same state.
Out of people who lived in different houses, 20% moved from different state.
Out of people who lived in different houses, 4% moved from abroad.
Private vs. public school enrollment:
Students in private schools in grades 1 to 8 (elementary and middle school): 164
Students in private schools in grades 9 to 12 (high school): 369
Students in private undergraduate colleges: 127
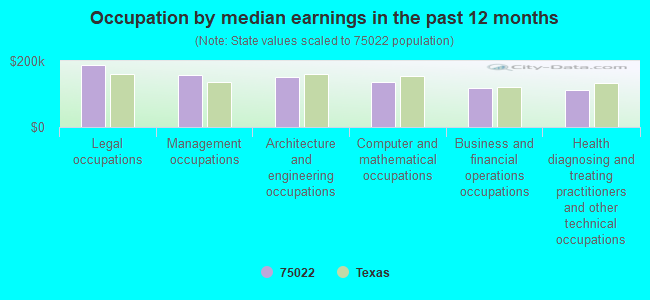
Occupation by median earnings in the past 12 months ($)
187,318 Legal occupations 158,751 Management occupations 152,871 Architecture and engineering occupations 137,074 Computer and mathematical occupations 118,405 Business and financial operations occupations 112,998 Health diagnosing and treating practitioners and other technical occupations
Companies with federal contracts located in this zip code:
COMPUSCAN IMAGING SOLUTIONS IN (6504 CARDINAL DR in FLOWER MOUND, TX) in 8 contracts from 2003 to 2006
Contracts for ADP Systems Development Services, Computer Aided Design/Computer Aided Manufacturing (CAD/CAM) Services, ADP Optical Scanning Services, Other ADP and Telecommunications Services (includes data storage on tapes, compact disks, etc.) by U.S. Army Corps of Engineers - civil program financing only, ArmySigned by year: 2000: $0; 2001: $0; 2002: $0; 2003: $25,000; 2004: $8,826; 2005: $8,824; 2006: $27,763.
Biggest contracts: with U.S. Army Corps of Engineers - civil program financing only for ADP Systems Development Services. Taking place in NM. Signed on 2003-04-28. Completion date: 2003-05-30.
with Army for Computer Aided Design/Computer Aided Manufacturing (CAD/CAM) Services. Signed on 2006-05-18. Completion date: 2006-06-16.
with Army for ADP Optical Scanning Services. Taking place in NM. Signed on 2006-06-15. Completion date: 2006-06-05.
with Army for Other ADP and Telecommunications Services (includes data storage on tapes, compact disks, etc.). Taking place in NM. Signed on 2004-04-16. Completion date: 2005-01-07.
VICTORY SOLUTIONS (3409 SUTTERS WAY in LEWISVILLE, TX; small business)
$46,500 with Air Force for Technical Assistance. Taking place in MD. Signed on 2005-09-28. Completion date: 2006-09-29.
HORIZION QUALITY ROOFING (3610 GREEN MEADOW LN in FLOWER MOUND, TX; small business)
$7,858 with U.S. Army Corps of Engineers - civil program financing only for Maintenance, Repair or Alteration of Real Property -- Other Industrial Buildings. Signed on 2003-09-15. Completion date: 2003-10-05.
CLARK, KIMBERLY, OWNER (2201 LONG PRAIRIE, in FLOWER MOUND, TX; small business)
$3,543 with Army for Court Reporting Services. Taking place in KY. Signed on 2002-09-28. Completion date: 2002-09-30.
Top industries in this zip code by the number of employees in 2005:
Administrative and Support and Waste Management and Remediation Services: Professional Employer Organizations (250-499 employees: 1 establishment)Accommodation and Food Services: Full-Service Restaurants (100-249: 1, 20-49: 4, 5-9: 1, 1-4: 5)Arts, Entertainment, and Recreation: Fitness and Recreational Sports Centers (100-249: 1, 20-49: 1, 10-19: 1, 5-9: 1)Professional, Scientific, and Technical Services: Computer Systems Design Services (100-249: 1, 5-9: 3, 1-4: 15)Health Care and Social Assistance: Offices of Physicians (except Mental Health Specialists) (20-49: 3, 10-19: 3, 5-9: 3, 1-4: 7)Health Care and Social Assistance: Offices of Dentists (10-19: 5, 5-9: 4, 1-4: 3)Health Care and Social Assistance: Child Day Care Services (20-49: 3, 1-4: 1)Other Services (except Public Administration): Religious Organizations (20-49: 2, 10-19: 1, 5-9: 1, 1-4: 3)Accommodation and Food Services: Limited-Service Restaurants (20-49: 1, 10-19: 2, 5-9: 1, 1-4: 2)Educational Services: Elementary and Secondary Schools (50-99: 1)
People in group quarters in 2010:
110 people in nursing facilities/skilled-nursing facilities
People in group quarters in 2000:
93 people in nursing homes
6 people in other group homes
Fatal accident statistics in 2012:
Fatal accident count: 1Vehicles involved in fatal accidents: 1Fatal accidents caused by drunken drivers: 1Fatalities: 1Persons involved in fatal accidents: 1Pedestrians involved in fatal accidents: 0
Fatal accident statistics in 2011:
Fatal accident count: 1Vehicles involved in fatal accidents: 2Fatal accidents caused by drunken drivers: 0Fatalities: 1Persons involved in fatal accidents: 3Pedestrians involved in fatal accidents: 0
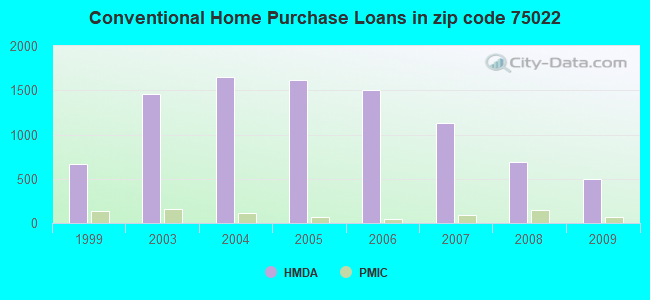
Home Mortgage Disclosure Act Aggregated Statistics For Year 2009(Based on 4 partial tracts) A) FHA, FSA/RHS & VA B) Conventional C) Refinancings D) Home Improvement Loans E) Loans on Dwellings For 5+ Families F) Non-occupant Loans on G) Loans On Manufactured Number Average Value Number Average Value Number Average Value Number Average Value Number Average Value Number Average Value Number Average Value
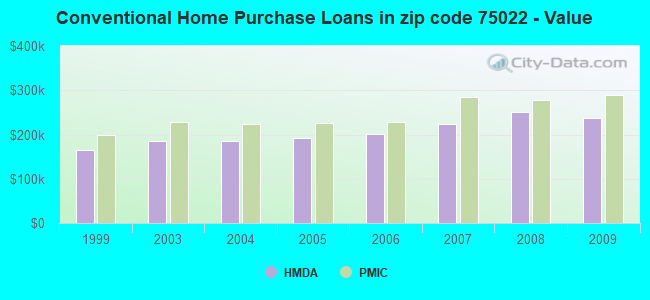
LOANS ORIGINATED 109 $225,859 497 $237,375 1,781 $240,971 54 $71,065 1 $2,654,970 29 $210,878 4 $161,278 APPLICATIONS APPROVED, NOT ACCEPTED 4 $188,612 28 $228,330 111 $245,343 7 $49,746 0 $0 3 $328,613 0 $0 APPLICATIONS DENIED 14 $243,190 52 $215,850 310 $256,311 35 $99,663 0 $0 11 $206,306 0 $0 APPLICATIONS WITHDRAWN 12 $226,317 56 $231,986 273 $255,958 14 $90,961 0 $0 3 $203,473 0 $0 FILES CLOSED FOR INCOMPLETENESS 0 $0 11 $211,245 68 $266,361 3 $79,293 0 $0 2 $202,280 1 $27,830
Aggregated Statistics For Year 2008(Based on 4 partial tracts) A) FHA, FSA/RHS & VA B) Conventional C) Refinancings D) Home Improvement Loans F) Non-occupant Loans on G) Loans On Manufactured Number Average Value Number Average Value Number Average Value Number Average Value Number Average Value Number Average Value
LOANS ORIGINATED 69 $216,237 691 $250,431 548 $229,465 104 $66,274 45 $186,464 1 $11,930 APPLICATIONS APPROVED, NOT ACCEPTED 5 $166,224 64 $281,588 65 $253,458 17 $57,869 2 $201,650 4 $63,120 APPLICATIONS DENIED 6 $234,675 89 $263,409 173 $220,351 89 $68,912 19 $155,501 4 $36,280 APPLICATIONS WITHDRAWN 9 $245,684 70 $250,169 133 $218,273 12 $110,702 12 $184,001 0 $0 FILES CLOSED FOR INCOMPLETENESS 0 $0 12 $225,362 28 $263,361 3 $139,853 1 $381,790 0 $0
Aggregated Statistics For Year 2007(Based on 4 partial tracts) A) FHA, FSA/RHS & VA B) Conventional C) Refinancings D) Home Improvement Loans F) Non-occupant Loans on G) Loans On Manufactured Number Average Value Number Average Value Number Average Value Number Average Value Number Average Value Number Average Value
LOANS ORIGINATED 31 $184,528 1,134 $222,638 514 $236,727 147 $60,357 60 $137,842 1 $22,860 APPLICATIONS APPROVED, NOT ACCEPTED 0 $0 119 $209,476 83 $206,798 55 $47,086 13 $186,260 2 $72,065 APPLICATIONS DENIED 8 $172,831 110 $309,437 188 $266,987 68 $68,878 19 $172,944 2 $56,735 APPLICATIONS WITHDRAWN 1 $179,910 95 $234,470 113 $227,001 9 $164,282 13 $244,985 0 $0 FILES CLOSED FOR INCOMPLETENESS 0 $0 25 $282,368 58 $244,729 10 $98,855 2 $197,310 0 $0
Aggregated Statistics For Year 2006(Based on 4 partial tracts) A) FHA, FSA/RHS & VA B) Conventional C) Refinancings D) Home Improvement Loans F) Non-occupant Loans on G) Loans On Manufactured Number Average Value Number Average Value Number Average Value Number Average Value Number Average Value Number Average Value
LOANS ORIGINATED 21 $187,861 1,499 $202,084 422 $223,885 156 $64,262 90 $154,161 1 $14,910 APPLICATIONS APPROVED, NOT ACCEPTED 1 $175,940 167 $194,479 64 $200,191 48 $50,475 13 $239,713 3 $39,097 APPLICATIONS DENIED 1 $85,830 130 $215,989 196 $235,791 84 $77,848 20 $153,872 5 $42,544 APPLICATIONS WITHDRAWN 2 $216,785 117 $247,646 149 $204,394 20 $87,718 5 $203,574 0 $0 FILES CLOSED FOR INCOMPLETENESS 0 $0 41 $226,377 88 $242,488 2 $287,110 4 $339,575 0 $0
Aggregated Statistics For Year 2005(Based on 4 partial tracts) A) FHA, FSA/RHS & VA B) Conventional C) Refinancings D) Home Improvement Loans F) Non-occupant Loans on G) Loans On Manufactured Number Average Value Number Average Value Number Average Value Number Average Value Number Average Value Number Average Value
LOANS ORIGINATED 23 $195,686 1,611 $191,475 619 $224,567 140 $78,297 76 $143,774 2 $49,050 APPLICATIONS APPROVED, NOT ACCEPTED 0 $0 150 $198,270 78 $207,885 46 $62,027 9 $172,214 2 $34,790 APPLICATIONS DENIED 2 $117,790 165 $226,506 305 $226,930 93 $66,255 26 $243,840 4 $35,070 APPLICATIONS WITHDRAWN 5 $139,956 152 $231,082 194 $228,038 41 $205,498 20 $183,409 0 $0 FILES CLOSED FOR INCOMPLETENESS 0 $0 38 $221,009 170 $250,052 7 $58,057 6 $117,458 0 $0
Aggregated Statistics For Year 2004(Based on 4 partial tracts) A) FHA, FSA/RHS & VA B) Conventional C) Refinancings D) Home Improvement Loans F) Non-occupant Loans on G) Loans On Manufactured Number Average Value Number Average Value Number Average Value Number Average Value Number Average Value Number Average Value
LOANS ORIGINATED 32 $166,537 1,655 $185,340 1,091 $193,132 136 $81,962 76 $161,084 0 $0 APPLICATIONS APPROVED, NOT ACCEPTED 1 $202,420 175 $175,379 138 $213,211 27 $124,261 3 $101,397 1 $45,720 APPLICATIONS DENIED 3 $115,567 154 $183,441 374 $203,047 102 $59,808 22 $174,724 4 $49,700 APPLICATIONS WITHDRAWN 10 $172,628 194 $197,880 299 $205,330 17 $54,848 11 $132,837 1 $63,620 FILES CLOSED FOR INCOMPLETENESS 1 $165,570 35 $248,757 165 $215,912 4 $59,692 1 $128,230 0 $0
Aggregated Statistics For Year 2003(Based on 4 partial tracts) A) FHA, FSA/RHS & VA B) Conventional C) Refinancings D) Home Improvement Loans E) Loans on Dwellings For 5+ Families F) Non-occupant Loans on Number Average Value Number Average Value Number Average Value Number Average Value Number Average Value Number Average Value
LOANS ORIGINATED 58 $161,518 1,461 $185,227 3,492 $191,820 183 $48,354 1 $2,658,700 94 $149,317 APPLICATIONS APPROVED, NOT ACCEPTED 0 $0 147 $182,747 323 $184,662 62 $39,140 0 $0 11 $175,842 APPLICATIONS DENIED 2 $125,740 130 $196,070 642 $194,689 85 $43,875 0 $0 17 $194,544 APPLICATIONS WITHDRAWN 4 $171,282 140 $208,476 432 $197,059 7 $51,416 0 $0 11 $134,454 FILES CLOSED FOR INCOMPLETENESS 2 $138,665 20 $192,622 92 $217,688 6 $40,790 0 $0 0 $0
Aggregated Statistics For Year 1999(Based on 1 partial tract) A) FHA, FSA/RHS & VA B) Conventional C) Refinancings D) Home Improvement Loans F) Non-occupant Loans on Number Average Value Number Average Value Number Average Value Number Average Value Number Average Value
LOANS ORIGINATED 21 $144,439 669 $164,718 140 $170,893 72 $49,348 7 $171,943 APPLICATIONS APPROVED, NOT ACCEPTED 1 $149,490 70 $145,442 28 $131,262 25 $44,373 4 $114,670 APPLICATIONS DENIED 3 $87,487 77 $113,919 38 $133,155 22 $30,887 0 $0 APPLICATIONS WITHDRAWN 0 $0 78 $181,772 20 $193,154 4 $36,100 2 $113,395 FILES CLOSED FOR INCOMPLETENESS 0 $0 27 $268,599 6 $132,223 2 $19,110 1 $109,570
Detailed HMDA statistics for the following Tracts:
0203.05
,
0217.14
Private Mortgage Insurance Companies Aggregated Statistics For Year 2009(Based on 4 partial tracts) A) Conventional B) Refinancings Number Average Value Number Average Value
LOANS ORIGINATED 68 $288,702 40 $272,311 APPLICATIONS APPROVED, NOT ACCEPTED 16 $280,879 10 $292,017 APPLICATIONS DENIED 7 $448,383 5 $268,578 APPLICATIONS WITHDRAWN 7 $350,314 1 $282,300 FILES CLOSED FOR INCOMPLETENESS 3 $212,383 0 $0
Aggregated Statistics For Year 2008(Based on 4 partial tracts) A) Conventional B) Refinancings C) Non-occupant Loans on Number Average Value Number Average Value Number Average Value
LOANS ORIGINATED 144 $277,267 23 $282,349 5 $183,692 APPLICATIONS APPROVED, NOT ACCEPTED 31 $267,236 10 $291,970 1 $199,790 APPLICATIONS DENIED 5 $403,360 1 $283,270 0 $0 APPLICATIONS WITHDRAWN 5 $284,988 0 $0 1 $165,000 FILES CLOSED FOR INCOMPLETENESS 1 $427,420 1 $581,490 1 $427,420
Aggregated Statistics For Year 2007(Based on 4 partial tracts) A) Conventional B) Refinancings C) Non-occupant Loans on Number Average Value Number Average Value Number Average Value
LOANS ORIGINATED 91 $285,442 15 $221,210 4 $207,458 APPLICATIONS APPROVED, NOT ACCEPTED 16 $261,971 5 $316,788 3 $149,780 APPLICATIONS DENIED 0 $0 0 $0 0 $0 APPLICATIONS WITHDRAWN 5 $350,660 0 $0 0 $0 FILES CLOSED FOR INCOMPLETENESS 0 $0 0 $0 0 $0
Aggregated Statistics For Year 2006(Based on 4 partial tracts) A) Conventional B) Refinancings C) Non-occupant Loans on Number Average Value Number Average Value Number Average Value
LOANS ORIGINATED 46 $229,072 12 $242,262 3 $147,997 APPLICATIONS APPROVED, NOT ACCEPTED 10 $216,548 3 $275,640 1 $235,900 APPLICATIONS DENIED 0 $0 0 $0 0 $0 APPLICATIONS WITHDRAWN 4 $397,370 1 $471,490 1 $539,740 FILES CLOSED FOR INCOMPLETENESS 1 $250,490 0 $0 0 $0
Aggregated Statistics For Year 2005(Based on 4 partial tracts) A) Conventional B) Refinancings C) Non-occupant Loans on Number Average Value Number Average Value Number Average Value
LOANS ORIGINATED 71 $226,046 33 $260,234 5 $161,868 APPLICATIONS APPROVED, NOT ACCEPTED 10 $246,894 12 $311,695 0 $0 APPLICATIONS DENIED 1 $371,350 0 $0 0 $0 APPLICATIONS WITHDRAWN 2 $227,340 4 $256,950 0 $0 FILES CLOSED FOR INCOMPLETENESS 2 $209,235 0 $0 0 $0
Aggregated Statistics For Year 2004(Based on 4 partial tracts) A) Conventional B) Refinancings C) Non-occupant Loans on Number Average Value Number Average Value Number Average Value
LOANS ORIGINATED 113 $224,765 49 $207,521 4 $189,900 APPLICATIONS APPROVED, NOT ACCEPTED 29 $224,720 20 $204,284 0 $0 APPLICATIONS DENIED 1 $213,710 0 $0 0 $0 APPLICATIONS WITHDRAWN 8 $199,704 10 $235,604 2 $374,110 FILES CLOSED FOR INCOMPLETENESS 1 $103,380 0 $0 0 $0
Aggregated Statistics For Year 2003(Based on 4 partial tracts) A) Conventional B) Refinancings C) Non-occupant Loans on Number Average Value Number Average Value Number Average Value
LOANS ORIGINATED 156 $228,857 176 $213,655 7 $161,067 APPLICATIONS APPROVED, NOT ACCEPTED 42 $242,169 58 $246,584 1 $223,650 APPLICATIONS DENIED 3 $313,440 3 $1,126,203 0 $0 APPLICATIONS WITHDRAWN 7 $272,496 10 $309,684 0 $0 FILES CLOSED FOR INCOMPLETENESS 0 $0 1 $306,150 0 $0
Aggregated Statistics For Year 1999(Based on 1 partial tract) A) Conventional B) Refinancings C) Non-occupant Loans on Number Average Value Number Average Value Number Average Value
LOANS ORIGINATED 140 $198,741 15 $192,927 0 $0 APPLICATIONS APPROVED, NOT ACCEPTED 18 $172,947 4 $198,760 1 $80,690 APPLICATIONS DENIED 5 $195,362 0 $0 0 $0 APPLICATIONS WITHDRAWN 3 $274,640 1 $355,900 0 $0 FILES CLOSED FOR INCOMPLETENESS 4 $217,870 0 $0 0 $0
Detailed PMIC statistics for the following Tracts:
0203.05
,
0217.14
2002 - 2018 National Fire Incident Reporting System (NFIRS) incidents See full 2006 National Fire Incident Reporting System statistics for zip code 75022, Texas
Most common first names in zip code 75022 among deceased individuals Name Count Lived (average)
John 9 67.9 years Robert 9 80.8 years Charles 8 79.7 years Mary 7 89.9 years James 6 83.3 years Betty 5 82.8 years Dorothy 4 81.3 years Barbara 4 72.7 years Elmer 4 87.0 years Joyce 4 68.0 years
Most common last names in zip code 75022 among deceased individuals Last name Count Lived (average)
Davis 7 79.5 years Smith 5 73.0 years Taylor 4 67.0 years Greene 3 71.7 years Chandler 3 77.0 years Anderson 3 71.4 years Graham 3 76.3 years Martin 3 69.0 years Moore 3 74.7 years Simmons 3 83.7 years
Businesses in zip code 75022
Name Count Name Count
Chick-Fil-A 1 Jimmy John's 2 DHL 1 Jones New York 1 FedEx 4 McDonald's 1 Firestone Complete Auto Care 1 Panda Express 1 GameStop 1 Papa John's Pizza 1 IHOP 1 UPS 2


 Nearest zip codes: 75028, 76092, 75077, 76226, 76262, 76210.
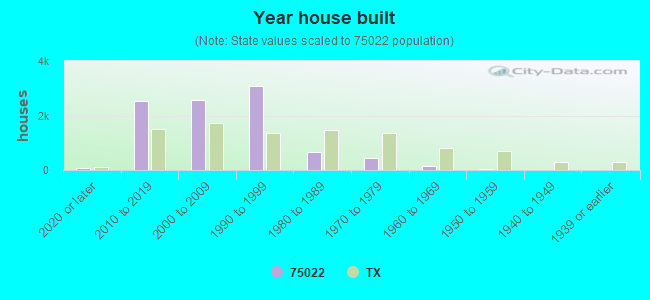


 : $70,413 in 8 contracts from 2003 to 2006
 According to the data from the years 2002 - 2018 the average number of fire incidents per year is 27. The highest number of fire incidents - 42 took place in 2006, and the least - 6 in 2002. The data has an increasing trend.
 When looking into fire subcategories, the most incidents belonged to: Outside Fires (47.1%), and Structure Fires (40.6%).