Estimated zip code population in 2022: 49,034 Zip code population in 2010: 42,226 Zip code population in 2000: 35,738
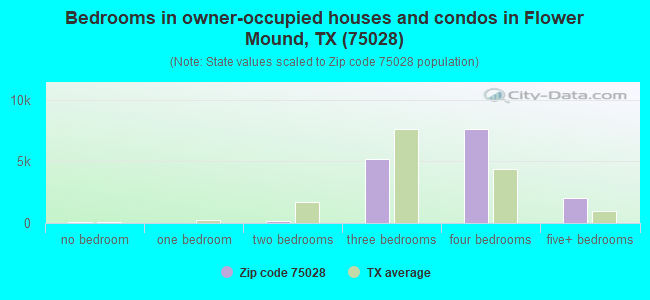
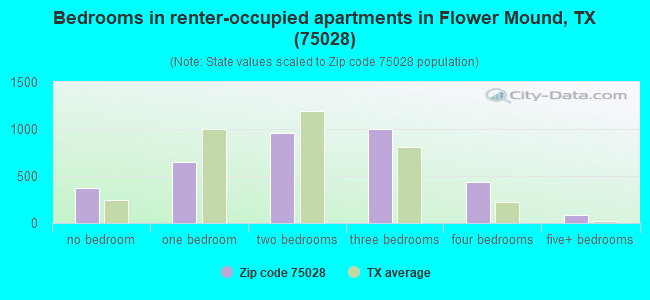
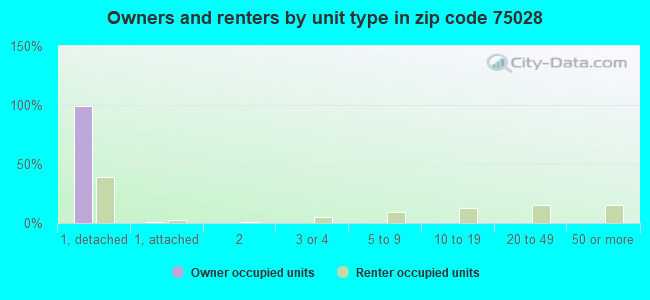
Houses and condos: 18,576 Renter-occupied apartments: 3,458
% of renters here:
19%
State:
38%
March 2022 cost of living index in zip code 75028: 96.8 (near average, U.S. average is 100)
Land area: 15.1 sq. mi. Water area: 0.1 sq. mi.
Population density: 3,237 people per square mile
(average).
OSM Map
General Map
Google Map
MSN Map
OSM Map
General Map
Google Map
MSN Map
OSM Map
General Map
Google Map
MSN Map
OSM Map
General Map
Google Map
MSN Map
Please wait while loading the map...
Real estate property taxes paid for housing units in 2022:
This zip code:
1.5% ($7,413)
Texas:
1.5% ($4,050)
Median real estate property taxes paid for housing units with mortgages in 2022: $7,577 (1.5%) Median real estate property taxes paid for housing units with no mortgage in 2022: $7,138 (1.4%)
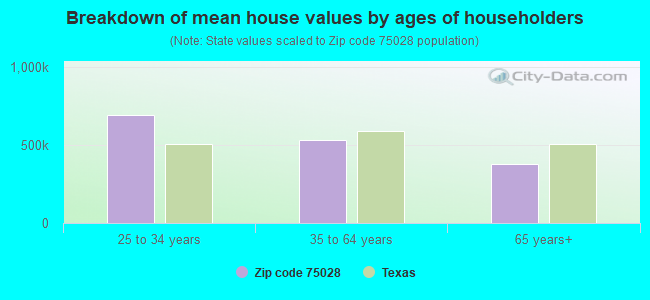
Estimated median house/condo value in 2022: $495,141
75028:
$495,141
Texas:
$275,400
According to our research of Texas and other state lists, there were 10 registered sex offenders living in 75028 zip code as of April 27, 2024. The ratio of all residents to sex offenders in zip code 75028 is 4,670 to 1. The ratio of registered sex offenders to all residents in this zip code is much lower than the state average.
Median resident age:
This zip code:
43.6 years
Texas median age:
35.6 years
Average household size:
This zip code:
2.7 people
Texas:
2.6 people
Averages for the 2020 tax year for zip code 75028, filed in 2021:
Average Adjusted Gross Income (AGI) in 2020: $122,497 (Individual Income Tax Returns)
Here:
$122,497
State:
$77,054
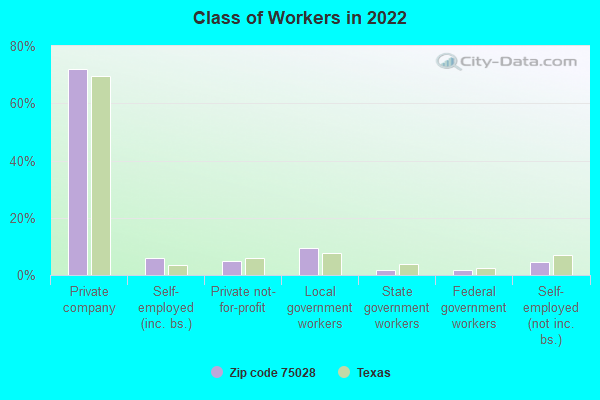
Salary/wage: $110,070 (reported on 85.9% of returns)
Here:
$110,070
State:
$62,766
(% of AGI for various income ranges: 1071.6% for AGIs below $25k, 3483.7% for AGIs $25k-50k, 6343.3% for AGIs $50k-75k, 9742.7% for AGIs $75k-100k, 19631.7% for AGIs $100k-200k, 74065.3% for AGIs over 200k)
Taxable interest for individuals: $1,647 (reported on 39.8% of returns)
This zip code:
$1,647
Texas:
$2,665
(% of AGI for various income ranges: 16.1% for AGIs below $25k, 28.3% for AGIs $25k-50k, 38.2% for AGIs $50k-75k, 63.4% for AGIs $75k-100k, 96.2% for AGIs $100k-200k, 602.8% for AGIs over 200k)
Ordinary dividends: $4,748 (reported on 32.9% of returns)
Here:
$4,748
State:
$10,044
(% of AGI for various income ranges: 33.7% for AGIs below $25k, 54.7% for AGIs $25k-50k, 108.8% for AGIs $50k-75k, 187.9% for AGIs $75k-100k, 222.0% for AGIs $100k-200k, 1429.1% for AGIs over 200k)
Net capital gain/loss in AGI: +$19,272 (reported on 30.5% of returns)
Here:
+$19,272
State:
+$39,590
(% of AGI for various income ranges: 23.9% for AGIs below $25k, 45.3% for AGIs $25k-50k, 97.3% for AGIs $50k-75k, 218.8% for AGIs $75k-100k, 369.4% for AGIs $100k-200k, 8105.7% for AGIs over 200k)
Profit/loss from business: +$16,403 (reported on 18.6% of returns)
Here:
+$16,403
State:
+$10,888
(% of AGI for various income ranges: 117.3% for AGIs below $25k, 165.2% for AGIs $25k-50k, 277.3% for AGIs $50k-75k, 315.5% for AGIs $75k-100k, 507.2% for AGIs $100k-200k, 2316.7% for AGIs over 200k)
Taxable individual retirement arrangement distribution: $26,834 (reported on 10.1% of returns)
75028:
$26,834
Texas:
$24,740
(% of AGI for various income ranges: 64.1% for AGIs below $25k, 154.9% for AGIs $25k-50k, 300.8% for AGIs $50k-75k, 410.1% for AGIs $75k-100k, 680.8% for AGIs $100k-200k, 1329.0% for AGIs over 200k)
Self-employed (Keogh) retirement plans: $29,806 (reported on 0.8% of returns)
75028:
$29,806
Texas:
$29,298
(% of AGI for various income ranges: 31.2% for AGIs $100k-200k, 288.1% for AGIs over 200k)
Total itemized deductions: $34,699 (reported on 16.2% of returns)
Here:
$34,699
State:
$40,428
(% of AGI for various income ranges: 73.7% for AGIs below $25k, 159.0% for AGIs $25k-50k, 395.6% for AGIs $50k-75k, 605.5% for AGIs $75k-100k, 1049.1% for AGIs $100k-200k, 4712.4% for AGIs over 200k)
Charity contributions: $12,525 (reported on 13.8% of returns)
Here:
$12,525
State:
$18,201
(% of AGI for various income ranges: 6.5% for AGIs below $25k, 19.6% for AGIs $25k-50k, 63.5% for AGIs $50k-75k, 127.9% for AGIs $75k-100k, 294.7% for AGIs $100k-200k, 1759.0% for AGIs over 200k)
Taxes paid: $8,579 (reported on 16.0% of returns)
75028:
$8,579
State:
$7,821
(% of AGI for various income ranges: 14.4% for AGIs below $25k, 29.6% for AGIs $25k-50k, 100.8% for AGIs $50k-75k, 159.7% for AGIs $75k-100k, 295.4% for AGIs $100k-200k, 1060.7% for AGIs over 200k)
Earned income credit: $1,830 (reported on 5.6% of returns)
Here:
$1,830
State:
$2,584
(% of AGI for various income ranges: 37.0% for AGIs below $25k, 40.2% for AGIs $25k-50k, 1.3% for AGIs $50k-75k)
Percentage of individuals using paid preparers for their 2020 taxes: 93.2%
Here:
93%
State:
92%
(% for various income ranges: 91.6% for AGIs below $25k, 93.3% for AGIs $25k-50k, 93.9% for AGIs $50k-75k, 92.8% for AGIs $75k-100k, 93.6% for AGIs $100k-200k, 94.6% for AGIs over 200k)
Averages for the 2012 tax year for zip code 75028, filed in 2013:
Average Adjusted Gross Income (AGI) in 2012: $100,755 (Individual Income Tax Returns)
Here:
$100,755
State:
$65,384
Salary/wage: $88,881 (reported on 89.6% of returns)
Here:
$88,881
State:
$52,524
(% of AGI for various income ranges: 82.7% for AGIs below $25k, 79.4% for AGIs $25k-50k, 79.8% for AGIs $50k-75k, 83.6% for AGIs $75k-100k, 87.6% for AGIs $100k-200k, 68.3% for AGIs over 200k)
Taxable interest for individuals: $980 (reported on 42.8% of returns)
This zip code:
$980
Texas:
$2,372
(% of AGI for various income ranges: 1.0% for AGIs below $25k, 0.5% for AGIs $25k-50k, 0.7% for AGIs $50k-75k, 0.4% for AGIs $75k-100k, 0.3% for AGIs $100k-200k, 0.4% for AGIs over 200k)
Ordinary dividends: $3,156 (reported on 28.8% of returns)
Here:
$3,156
State:
$9,721
(% of AGI for various income ranges: 1.7% for AGIs below $25k, 1.2% for AGIs $25k-50k, 0.9% for AGIs $50k-75k, 0.6% for AGIs $75k-100k, 0.6% for AGIs $100k-200k, 1.2% for AGIs over 200k)
Net capital gain/loss in AGI: +$8,610 (reported on 24.5% of returns)
Here:
+$8,610
State:
+$35,319
(% of AGI for various income ranges: 0.4% for AGIs $50k-75k, 0.3% for AGIs $75k-100k, 0.5% for AGIs $100k-200k, 5.0% for AGIs over 200k)
Profit/loss from business: +$14,484 (reported on 18.4% of returns)
Here:
+$14,484
State:
+$13,732
(% of AGI for various income ranges: 7.6% for AGIs below $25k, 5.1% for AGIs $25k-50k, 3.2% for AGIs $50k-75k, 2.5% for AGIs $75k-100k, 2.5% for AGIs $100k-200k, 2.0% for AGIs over 200k)
Taxable individual retirement arrangement distribution: $21,629 (reported on 9.8% of returns)
75028:
$21,629
Texas:
$19,511
(% of AGI for various income ranges: 3.1% for AGIs below $25k, 3.4% for AGIs $25k-50k, 3.1% for AGIs $50k-75k, 3.1% for AGIs $75k-100k, 2.2% for AGIs $100k-200k, 1.3% for AGIs over 200k)
Self-employment retirement plans: $19,282 (reported on 0.9% of returns)
75028:
$19,282
Texas:
$23,938
(% of AGI for various income ranges: 0.2% for AGIs $50k-75k, 0.1% for AGIs $100k-200k, 0.3% for AGIs over 200k)
Total itemized deductions: $22,875 (15% of AGI, reported on 52.0% of returns)
Here:
$22,875
State:
$24,724
Here:
14.9% of AGI
State:
15.9% of AGI
(% of AGI for various income ranges: 13.1% for AGIs below $25k, 14.2% for AGIs $25k-50k, 15.5% for AGIs $50k-75k, 14.9% for AGIs $75k-100k, 13.4% for AGIs $100k-200k, 8.3% for AGIs over 200k)
Charity contributions: $4,893 (reported on 45.1% of returns)
Here:
$4,893
State:
$6,808
(% of AGI for various income ranges: 1.1% for AGIs below $25k, 1.7% for AGIs $25k-50k, 2.1% for AGIs $50k-75k, 2.5% for AGIs $75k-100k, 2.5% for AGIs $100k-200k, 2.0% for AGIs over 200k)
Taxes paid: $7,571 (reported on 51.5% of returns)
75028:
$7,571
State:
$6,921
(% of AGI for various income ranges: 2.7% for AGIs below $25k, 3.9% for AGIs $25k-50k, 4.5% for AGIs $50k-75k, 4.7% for AGIs $75k-100k, 4.5% for AGIs $100k-200k, 2.9% for AGIs over 200k)
Earned income credit: $1,943 (reported on 6.8% of returns)
Here:
$1,943
State:
$2,570
(% of AGI for various income ranges: 3.5% for AGIs below $25k, 0.8% for AGIs $25k-50k)
Percentage of individuals using paid preparers for their 2012 taxes: 40.4%
Here:
40%
State:
51%
(% for various income ranges: 33.1% for AGIs below $25k, 39.5% for AGIs $25k-50k, 43.1% for AGIs $50k-75k, 40.2% for AGIs $75k-100k, 40.8% for AGIs $100k-200k, 57.5% for AGIs over 200k)
Averages for the 2004 tax year for zip code 75028, filed in 2005:
Average Adjusted Gross Income (AGI) in 2004: $85,030 (Individual Income Tax Returns)
Here:
$85,030
State:
$47,881
Salary/wage: $79,439 (reported on 91.7% of returns)
Here:
$79,439
State:
$41,947
(% of AGI for various income ranges: 162.3% for AGIs below $10k, 81.4% for AGIs $10k-25k, 85.6% for AGIs $25k-50k, 88.9% for AGIs $50k-75k, 91.9% for AGIs $75k-100k, 83.2% for AGIs over 100k)
Taxable interest for individuals: $994 (reported on 55.2% of returns)
This zip code:
$994
Texas:
$2,255
(% of AGI for various income ranges: 6.5% for AGIs below $10k, 2.0% for AGIs $10k-25k, 1.0% for AGIs $25k-50k, 0.8% for AGIs $50k-75k, 0.6% for AGIs $75k-100k, 0.5% for AGIs over 100k)
Taxable dividends: $1,557 (reported on 35.2% of returns)
Here:
$1,557
State:
$4,261
(% of AGI for various income ranges: 5.6% for AGIs below $10k, 1.7% for AGIs $10k-25k, 0.7% for AGIs $25k-50k, 0.5% for AGIs $50k-75k, 0.6% for AGIs $75k-100k, 0.6% for AGIs over 100k)
Net capital gain/loss: +$7,341 (reported on 30.0% of returns)
Here:
+$7,341
State:
+$16,110
(% of AGI for various income ranges: -0.5% for AGIs below $10k, 0.7% for AGIs $10k-25k, 0.2% for AGIs $25k-50k, 0.4% for AGIs $50k-75k, 0.3% for AGIs $75k-100k, 3.8% for AGIs over 100k)
Profit/loss from business: +$11,105 (reported on 19.4% of returns)
Here:
+$11,105
State:
+$11,013
(% of AGI for various income ranges: 7.7% for AGIs below $10k, 6.4% for AGIs $10k-25k, 4.6% for AGIs $25k-50k, 3.1% for AGIs $50k-75k, 2.2% for AGIs $75k-100k, 2.2% for AGIs over 100k)
IRA payment deduction: $3,108 (reported on 2.9% of returns)
75028:
$3,108
Texas:
$3,120
(% of AGI for various income ranges: 0.5% for AGIs below $10k, 0.1% for AGIs $10k-25k, 0.2% for AGIs $25k-50k, 0.1% for AGIs $50k-75k, 0.1% for AGIs $75k-100k, 0.1% for AGIs over 100k)
Self-employed pension: $12,793 (reported on 1.0% of returns)
Here:
$12,793
Texas:
$16,401
(% of AGI for various income ranges: 0.5% for AGIs below $10k, 0.1% for AGIs $50k-75k, 0.1% for AGIs $75k-100k, 0.2% for AGIs over 100k)
Total itemized deductions: $20,799 (18% of AGI, reported on 61.9% of returns)
Here:
$20,799
State:
$19,631
Here:
17.7% of AGI
State:
18.9% of AGI
(% of AGI for various income ranges: 22.3% for AGIs below $10k, 16.8% for AGIs $10k-25k, 18.8% for AGIs $25k-50k, 20.1% for AGIs $50k-75k, 18.5% for AGIs $75k-100k, 13.2% for AGIs over 100k)
Charity contributions deductions: $3,653 (3% of AGI, reported on 56.1% of returns)
Here:
$3,653
State:
$4,753
Here:
3.0% of AGI
State:
4.2% of AGI
(% of AGI for various income ranges: 1.1% for AGIs below $10k, 1.4% for AGIs $10k-25k, 2.3% for AGIs $25k-50k, 2.7% for AGIs $50k-75k, 2.7% for AGIs $75k-100k, 2.3% for AGIs over 100k)
Total tax: $14,341 (reported on 85.3% of returns)
75028:
$14,341
State:
$9,058
(% of AGI for various income ranges: 4.5% for AGIs below $10k, 5.0% for AGIs $10k-25k, 7.3% for AGIs $25k-50k, 8.6% for AGIs $50k-75k, 9.9% for AGIs $75k-100k, 17.4% for AGIs over 100k)
Earned income credit: $1,591 (reported on 4.7% of returns)
Here:
$1,591
State:
$2,024
Percentage of individuals using paid preparers for their 2004 taxes: 41.5%
Here:
42%
State:
57%
(% for various income ranges: 27.8% for AGIs below $10k, 42.5% for AGIs $10k-25k, 45.0% for AGIs $25k-50k, 45.9% for AGIs $50k-75k, 38.5% for AGIs $75k-100k, 46.2% for AGIs over 100k)
Likely homosexual households (counted as self-reported same-sex unmarried-partner households)
Lesbian couples: 0.1% of all households
Gay men: 0.0% of all households
Household received Food Stamps/SNAP in the past 12 months: 184 Household did not receive Food Stamps/SNAP in the past 12 months: 18,113
Women who had a birth in the past 12 months: 399 (367 now married, 36 unmarried) Women who did not have a birth in the past 12 months: 10,305 (6,159 now married, 4,094 unmarried)
Housing units in zip code 75028 with a mortgage: 11,170 (905 second mortgage, 16 home equity loan, 505 both second mortgage and home equity loan) Houses without a mortgage: 125
Median monthly owner costs for units with a mortgage: $2,582 Median monthly owner costs for units without a mortgage: $1,108
Residents with income below the poverty level in 2022:
This zip code:
3.4%
Whole state:
14.0%
Residents with income below 50% of the poverty level in 2022:
This zip code:
1.0%
Whole state:
7.4%
Median number of rooms in houses and condos:
Here:
7.7
State:
6.3
Median number of rooms in apartments:
Here:
4.7
State:
4.0
Notable locations in this zip code not listed on our city pages
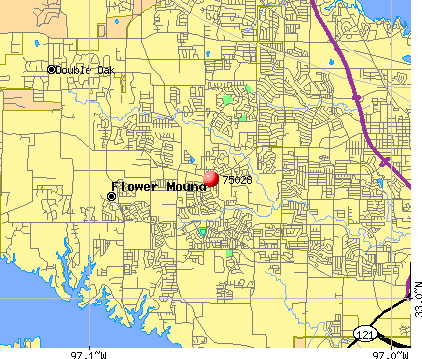
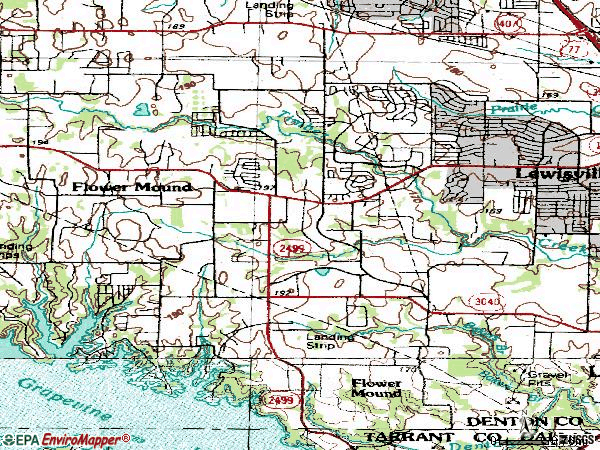
Notable locations in zip code 75028: Flower Mound Water Treatment Facility (A), Flower Mound Fire Department Station 1 (B). Display/hide their locations on the map
Churches in zip code 75028 include: Faith Lutheran Church (A), Timbercreek Baptist Church (B), Restoration Fellowship Church (C), Trinity Presbyterian Church (D), Bethel Church (E), Flower Mound Church (F). Display/hide their locations on the map
10,491 married couples with children.
1,320 single-parent households (434 men, 886 women).
83.2% of residents of 75028 zip code speak English at home.
5.7% of residents speak Spanish at home (84% very well, 11% well, 3% not well, 1% not at all).
4.0% of residents speak other Indo-European language at home (86% very well, 10% well, 4% not well).
7.0% of residents speak Asian or Pacific Island language at home (75% very well, 13% well, 12% not well, 1% not at all).
0.4% of residents speak other language at home (96% very well, 3% well, 1% not well).
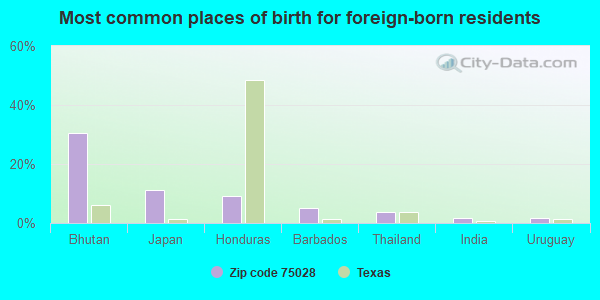
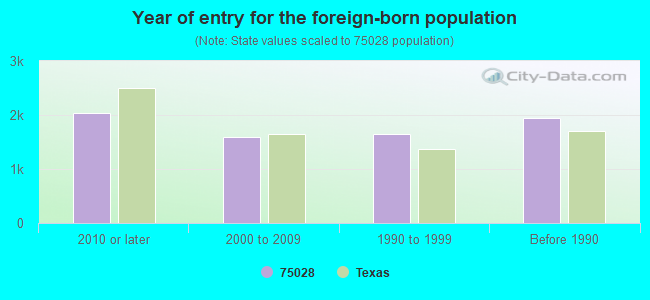
Foreign born population: 6,588 (13.4%) (68.7% of them are naturalized citizens)
Facilities with environmental interests located in this zip code:
ABLE FUEL INJECTION SVC (1419 CRESENT AVE in LEWISVILLE, TX)
(Resource Conservation and Recovery Act (tracking hazardous waste)) Organizations: ABLE FUEL INJECTION SERVICE INC (CONTACT/OPERATOR)
ANGELO LAFRATE CONSTRUCTION (10193 LAKESIDE PARKWAY in FLOWER MOUND, TX)
National Pollutant Discharge Elimination System NON-MAJOR (Tracking pollutant discharge elimination systems) - permit Alternative names: AGELO IAFRATE CONSTRUCTION
Housing units lacking complete plumbing facilities: 0.2% Housing units lacking complete kitchen facilities: 1.8%
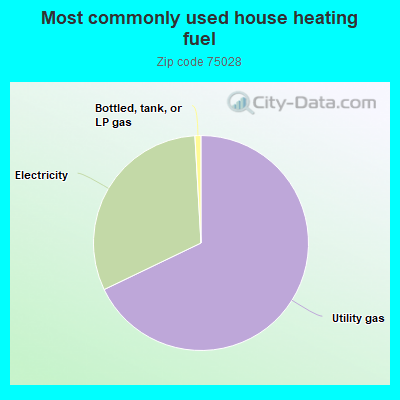
67.6%Utility gas
31.1%Electricity
0.9%Bottled, tank, or LP gas
Population in 1990: 16,825. Population change in the 1990s: +18,913 (+112.4%).
Place of birth for U.S.-born residents:
This state: 20,136
Northeast: 4,150
Midwest: 7,066
South: 6,209
West: 4,441
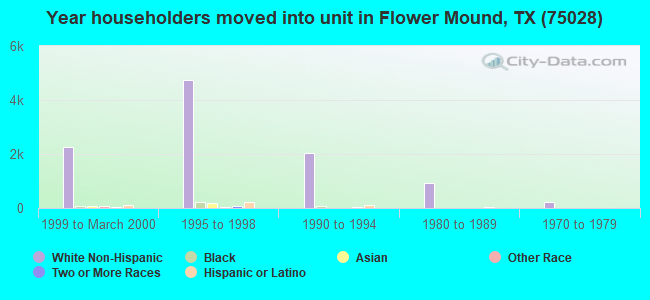
38% of the 75028 zip code residents lived in the same house 5 years ago. Out of people who lived in different houses, 29% lived in this county. Out of people who lived in different counties, 50% lived in Texas.
90% of the 75028 zip code residents lived in the same house 1 year ago. Out of people who lived in different houses, 47% moved from this county. Out of people who lived in different houses, 28% moved from different county within same state. Out of people who lived in different houses, 21% moved from different state. Out of people who lived in different houses, 5% moved from abroad.
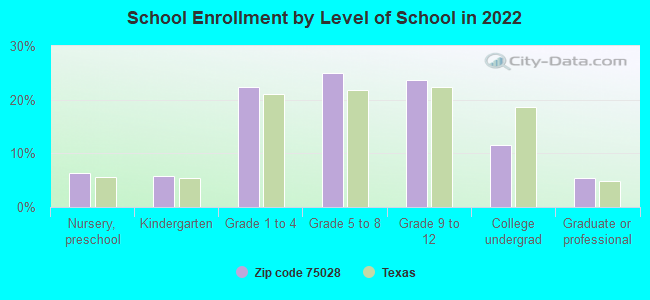
Private vs. public school enrollment:
Students in private schools in grades 1 to 8 (elementary and middle school): 748
Here:
11.9%
Texas:
8.8%
Students in private schools in grades 9 to 12 (high school): 127
Here:
4.1%
Texas:
8.0%
Students in private undergraduate colleges: 259
Here:
17.2%
Texas:
16.2%
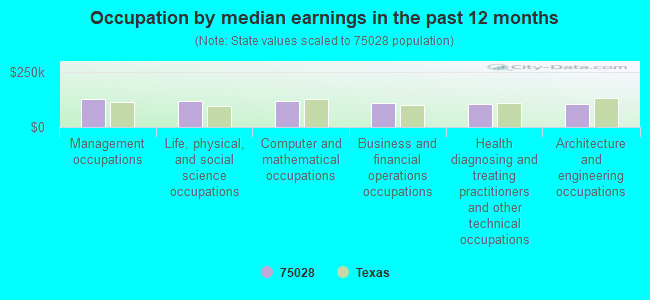
Occupation by median earnings in the past 12 months ($)
128,980Management occupations
119,346Life, physical, and social science occupations
116,559Computer and mathematical occupations
107,702Business and financial operations occupations
106,175Health diagnosing and treating practitioners and other technical occupations
102,760Architecture and engineering occupations
Companies with federal contracts located in this zip code (FLOWER MOUND, TX):
BEYOND FITNESS, INC (2221 JUSTIN ROAD, SUITE 11; small business) : $193,102 in 2 contractsin 2000
$101,266 with Air Force for Lease or Rental of Equipment -- Instruments and Laboratory Equipment. Signed on 2000-10-31. Completion date: 2001-09-30.
$91,836, same as above.Signed on 2000-01-21. Completion date: 2000-09-30.
BP STRUCTURES, LLC (1804 MEADOW RIDGE DR; small business) : $93,512 in 2 contractsin 2005
$76,512 with Air Force for Construction of Structures and Facilities -- Miscellaneous Buildings. Signed on 2005-08-02. Completion date: 2005-09-06.
$17,000 with Air Force for Draperies, Awnings, and Shades. Signed on 2005-10-19. Completion date: 2005-12-18.
FLOWER MOUND, TOWN OF (2121 CROSS TIMBERS RD) : $70,654 in 3 contractsfrom 2005 to 2006
$24,230 with U.S. Army Corps of Engineers - civil program financing only for Other Professional Services. Signed on 2005-04-14. Completion date: 2005-09-30.
$24,230 with Army for Other Professional Services. Signed on 2005-04-14. Completion date: 2005-09-30.
$22,194, same as above.Signed on 2006-04-11. Completion date: 2006-09-30.
TEXAS CABLE PARTNERS, L P (300 PARKER SQUARE, SUITE 2) : $33,749 in 8 contractsfrom 2004 to 2006
Contracts for Other Utilities, Installation of Equipment -- Communication, Detection, and Coherent Radiation Equipment, Electrical Hardware and Supplies, Technical Representation Services -- Electrical and Electronic Equipment Components by Air Force, Drug Enforcement Administration Signed by year:2000: $0; 2001: $0; 2002: $0; 2003: $0; 2004: $12,902; 2005: $20,847; 2006: $0.
Biggest contracts:
$12,902 with Air Force for Other Utilities. Signed on 2004-10-01. Completion date: 2005-09-30.
$12,254, same as above.Signed on 2005-10-01. Completion date: 2006-09-30.
$6,299 with Air Force for Installation of Equipment -- Communication, Detection, and Coherent Radiation Equipment. Signed on 2005-09-26. Completion date: 2005-12-31.
$3,988 with Drug Enforcement Administration for Electrical Hardware and Supplies. Signed on 2005-10-11. Completion date: 2006-09-30.
TEXAS CABLE PARTNERS, LP (300 PARKER SQUARE, SUITE 2) : $7,895 in 4 contractsfrom 2003 to 2004
$3,916 with Navy for Telephone and/or Communications Services (includes Telegraph, Telex, and Cablevision Services). Signed on 2003-12-18. Completion date: 2004-09-30.
$2,359 with Army for ADP Telecommunications and Transmission Services. Signed on 2004-12-02. Completion date: 2005-12-01.
$1,620 with Navy for Telephone and/or Communications Services (includes Telegraph, Telex, and Cablevision Services). Signed on 2004-02-23. Completion date: 2004-09-30.
$0, same as above.Signed on 2003-12-18. Completion date: 2004-09-30.
JULIE K WALZ (3417 JAMESTON DRIVE; small business) : $6,509 in 2 contractsfrom 2001 to 2002
$3,962 with U.S. Army Corps of Engineers - civil program financing only for Technical Assistance. Signed on 2001-11-05. Completion date: 2001-12-05.
$2,547, same as above.Signed on 2002-04-04. Completion date: 2002-04-04.
LEADERSHIP ON THE MOVE (5437 GREGORY DR; small business)
$5,250 with Army for Other Education and Training Services. Signed on 2004-05-25. Completion date: 2004-06-03.
VANSICKLE, ORAL (504 NEWPORT DR; small business)
$5,135 with Army for Operation of Government-Owned Facilities -- Other Non-Building Facilities. Signed on 2006-01-31. Completion date: 2006-04-01.
ROBINSON, KIRBY (905 HILLSIDE LN; small business)
$3,000 with Army for Recreational Services. Signed on 2006-06-12. Completion date: 2006-06-06.
Top industries in this zip code by the number of employees in 2005:
Health Care and Social Assistance: Nursing Care Facilities (250-499 employees: 1 establishment, 100-249 employees: 3 establishments, 50-99 employees: 1 establishment)
2002 - 2018 National Fire Incident Reporting System (NFIRS) incidents
According to the data from the years 2002 - 2018 the average number of fire incidents per year is 96. The highest number of fire incidents - 146 took place in 2003, and the least - 57 in 2007. The data has a decreasing trend.
When looking into fire subcategories, the most incidents belonged to: Outside Fires (46.5%), and Structure Fires (39.7%).
Fire incident types reported to NFIRS in Zip Code 75028

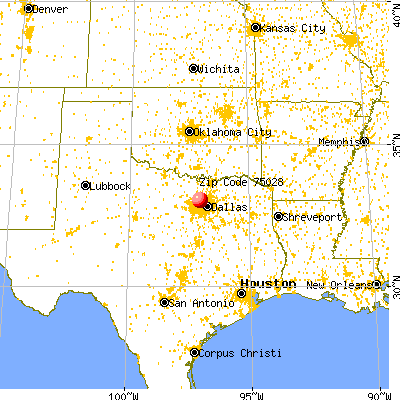


 Nearest zip codes: 75077, 75067, 75022, 75057, 75065, 75019.


 According to the data from the years 2002 - 2018 the average number of fire incidents per year is 96. The highest number of fire incidents - 146 took place in 2003, and the least - 57 in 2007. The data has a decreasing trend.
 When looking into fire subcategories, the most incidents belonged to: Outside Fires (46.5%), and Structure Fires (39.7%).