Estimated zip code population in 2022: 41,281 Zip code population in 2010: 28,145 Zip code population in 2000: 16,491
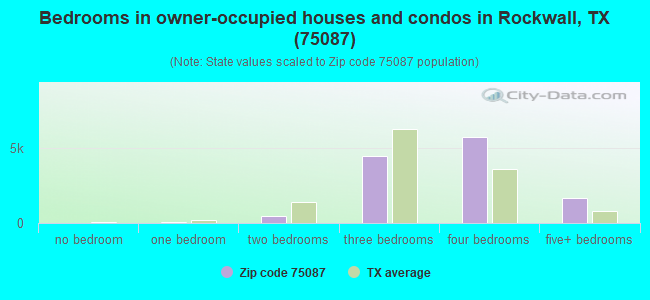
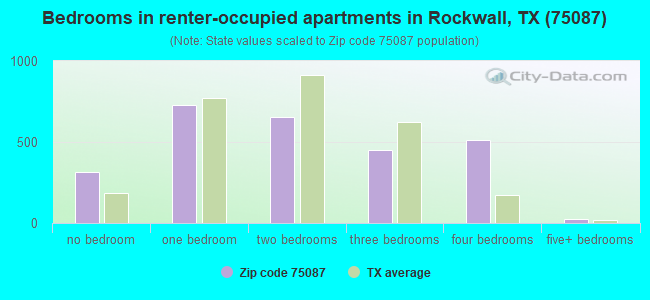
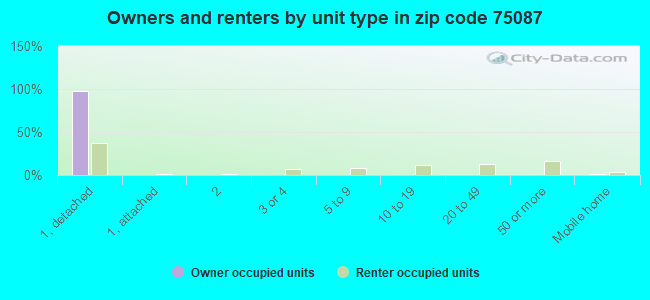
Houses and condos: 15,288 Renter-occupied apartments: 2,630
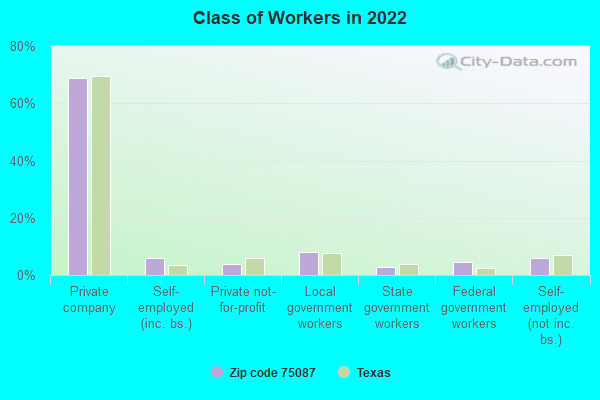
% of renters here:
18%
State:
38%
March 2022 cost of living index in zip code 75087: 95.2 (less than average, U.S. average is 100)
Land area: 26.2 sq. mi. Water area: 9.5 sq. mi.
Population density: 1,577 people per square mile
(low).
OSM Map
General Map
Google Map
MSN Map
OSM Map
General Map
Google Map
MSN Map
OSM Map
General Map
Google Map
MSN Map
OSM Map
General Map
Google Map
MSN Map
Please wait while loading the map...
Real estate property taxes paid for housing units in 2022:
This zip code:
1.5% ($6,650)
Texas:
1.5% ($4,050)
Median real estate property taxes paid for housing units with mortgages in 2022: $7,202 (1.6%) Median real estate property taxes paid for housing units with no mortgage in 2022: $4,779 (1.3%)
Estimated median house/condo value in 2022: $432,193
75087:
$432,193
Texas:
$275,400
According to our research of Texas and other state lists, there were 7 registered sex offenders living in 75087 zip code as of April 27, 2024. The ratio of all residents to sex offenders in zip code 75087 is 4,622 to 1. The ratio of registered sex offenders to all residents in this zip code is much lower than the state average.
Median resident age:
This zip code:
39.4 years
Texas median age:
35.6 years
Average household size:
This zip code:
2.7 people
Texas:
2.6 people
Averages for the 2020 tax year for zip code 75087, filed in 2021:
Average Adjusted Gross Income (AGI) in 2020: $108,000 (Individual Income Tax Returns)
Here:
$108,000
State:
$77,054
Salary/wage: $88,934 (reported on 82.8% of returns)
Here:
$88,934
State:
$62,766
(% of AGI for various income ranges: 1126.3% for AGIs below $25k, 3501.1% for AGIs $25k-50k, 6410.8% for AGIs $50k-75k, 9549.0% for AGIs $75k-100k, 18978.8% for AGIs $100k-200k, 64357.1% for AGIs over 200k)
Taxable interest for individuals: $2,166 (reported on 32.1% of returns)
This zip code:
$2,166
Texas:
$2,665
(% of AGI for various income ranges: 21.0% for AGIs below $25k, 36.9% for AGIs $25k-50k, 54.2% for AGIs $50k-75k, 79.8% for AGIs $75k-100k, 98.7% for AGIs $100k-200k, 914.1% for AGIs over 200k)
Ordinary dividends: $6,576 (reported on 23.7% of returns)
Here:
$6,576
State:
$10,044
(% of AGI for various income ranges: 31.5% for AGIs below $25k, 58.9% for AGIs $25k-50k, 102.3% for AGIs $50k-75k, 131.4% for AGIs $75k-100k, 217.1% for AGIs $100k-200k, 2349.0% for AGIs over 200k)
Net capital gain/loss in AGI: +$30,736 (reported on 23.0% of returns)
Here:
+$30,736
State:
+$39,590
(% of AGI for various income ranges: 20.5% for AGIs below $25k, 47.3% for AGIs $25k-50k, 105.4% for AGIs $50k-75k, 194.9% for AGIs $75k-100k, 447.7% for AGIs $100k-200k, 15629.7% for AGIs over 200k)
Profit/loss from business: +$16,105 (reported on 22.3% of returns)
Here:
+$16,105
State:
+$10,888
(% of AGI for various income ranges: 115.6% for AGIs below $25k, 178.9% for AGIs $25k-50k, 341.4% for AGIs $50k-75k, 475.2% for AGIs $75k-100k, 677.7% for AGIs $100k-200k, 3760.1% for AGIs over 200k)
Taxable individual retirement arrangement distribution: $23,017 (reported on 10.3% of returns)
75087:
$23,017
Texas:
$24,740
(% of AGI for various income ranges: 62.7% for AGIs below $25k, 141.5% for AGIs $25k-50k, 288.2% for AGIs $50k-75k, 405.0% for AGIs $75k-100k, 631.9% for AGIs $100k-200k, 1408.9% for AGIs over 200k)
Self-employed (Keogh) retirement plans: $22,220 (reported on 0.5% of returns)
75087:
$22,220
Texas:
$29,298
(% of AGI for various income ranges: 19.5% for AGIs $100k-200k, 224.5% for AGIs over 200k)
Total itemized deductions: $36,861 (reported on 14.9% of returns)
Here:
$36,861
State:
$40,428
(% of AGI for various income ranges: 63.7% for AGIs below $25k, 188.8% for AGIs $25k-50k, 450.6% for AGIs $50k-75k, 675.0% for AGIs $75k-100k, 1182.4% for AGIs $100k-200k, 6202.3% for AGIs over 200k)
Charity contributions: $13,940 (reported on 12.5% of returns)
Here:
$13,940
State:
$18,201
(% of AGI for various income ranges: 6.9% for AGIs below $25k, 27.9% for AGIs $25k-50k, 84.0% for AGIs $50k-75k, 134.6% for AGIs $75k-100k, 344.3% for AGIs $100k-200k, 2547.4% for AGIs over 200k)
Taxes paid: $7,974 (reported on 14.8% of returns)
75087:
$7,974
State:
$7,821
(% of AGI for various income ranges: 13.6% for AGIs below $25k, 39.3% for AGIs $25k-50k, 103.8% for AGIs $50k-75k, 173.2% for AGIs $75k-100k, 305.9% for AGIs $100k-200k, 1053.4% for AGIs over 200k)
Earned income credit: $2,215 (reported on 8.5% of returns)
Here:
$2,215
State:
$2,584
(% of AGI for various income ranges: 67.0% for AGIs below $25k, 62.7% for AGIs $25k-50k, 0.9% for AGIs $50k-75k)
Percentage of individuals using paid preparers for their 2020 taxes: 92.3%
Here:
92%
State:
92%
(% for various income ranges: 90.7% for AGIs below $25k, 92.8% for AGIs $25k-50k, 92.5% for AGIs $50k-75k, 92.2% for AGIs $75k-100k, 93.5% for AGIs $100k-200k, 92.2% for AGIs over 200k)
Averages for the 2012 tax year for zip code 75087, filed in 2013:
Average Adjusted Gross Income (AGI) in 2012: $83,937 (Individual Income Tax Returns)
Here:
$83,937
State:
$65,384
Salary/wage: $72,658 (reported on 85.2% of returns)
Here:
$72,658
State:
$52,524
(% of AGI for various income ranges: 73.4% for AGIs below $25k, 80.1% for AGIs $25k-50k, 76.2% for AGIs $50k-75k, 78.3% for AGIs $75k-100k, 82.4% for AGIs $100k-200k, 56.2% for AGIs over 200k)
Taxable interest for individuals: $1,828 (reported on 36.3% of returns)
This zip code:
$1,828
Texas:
$2,372
(% of AGI for various income ranges: 2.0% for AGIs below $25k, 0.9% for AGIs $25k-50k, 0.8% for AGIs $50k-75k, 0.6% for AGIs $75k-100k, 0.4% for AGIs $100k-200k, 1.2% for AGIs over 200k)
Ordinary dividends: $4,979 (reported on 22.5% of returns)
Here:
$4,979
State:
$9,721
(% of AGI for various income ranges: 2.4% for AGIs below $25k, 1.0% for AGIs $25k-50k, 1.0% for AGIs $50k-75k, 0.9% for AGIs $75k-100k, 0.9% for AGIs $100k-200k, 2.3% for AGIs over 200k)
Net capital gain/loss in AGI: +$17,049 (reported on 19.3% of returns)
Here:
+$17,049
State:
+$35,319
(% of AGI for various income ranges: 0.2% for AGIs $25k-50k, 0.6% for AGIs $50k-75k, 0.2% for AGIs $75k-100k, 0.8% for AGIs $100k-200k, 13.1% for AGIs over 200k)
Profit/loss from business: +$15,633 (reported on 21.5% of returns)
Here:
+$15,633
State:
+$13,732
(% of AGI for various income ranges: 10.3% for AGIs below $25k, 5.0% for AGIs $25k-50k, 3.8% for AGIs $50k-75k, 2.6% for AGIs $75k-100k, 3.5% for AGIs $100k-200k, 4.4% for AGIs over 200k)
Taxable individual retirement arrangement distribution: $19,398 (reported on 11.2% of returns)
75087:
$19,398
Texas:
$19,511
(% of AGI for various income ranges: 3.6% for AGIs below $25k, 2.8% for AGIs $25k-50k, 3.5% for AGIs $50k-75k, 3.3% for AGIs $75k-100k, 2.3% for AGIs $100k-200k, 2.2% for AGIs over 200k)
Self-employment retirement plans: $14,240 (reported on 0.7% of returns)
75087:
$14,240
Texas:
$23,938
(% of AGI for various income ranges: 0.2% for AGIs $50k-75k, 0.1% for AGIs $100k-200k, 0.2% for AGIs over 200k)
Total itemized deductions: $22,459 (18% of AGI, reported on 47.4% of returns)
Here:
$22,459
State:
$24,724
Here:
17.7% of AGI
State:
15.9% of AGI
(% of AGI for various income ranges: 14.9% for AGIs below $25k, 14.0% for AGIs $25k-50k, 15.1% for AGIs $50k-75k, 14.9% for AGIs $75k-100k, 13.3% for AGIs $100k-200k, 9.1% for AGIs over 200k)
Charity contributions: $5,402 (reported on 39.7% of returns)
Here:
$5,402
State:
$6,808
(% of AGI for various income ranges: 1.3% for AGIs below $25k, 2.0% for AGIs $25k-50k, 2.3% for AGIs $50k-75k, 2.5% for AGIs $75k-100k, 2.6% for AGIs $100k-200k, 3.0% for AGIs over 200k)
Taxes paid: $6,810 (reported on 47.1% of returns)
75087:
$6,810
State:
$6,921
(% of AGI for various income ranges: 3.4% for AGIs below $25k, 3.7% for AGIs $25k-50k, 4.4% for AGIs $50k-75k, 4.5% for AGIs $75k-100k, 4.3% for AGIs $100k-200k, 2.7% for AGIs over 200k)
Earned income credit: $1,957 (reported on 9.6% of returns)
Here:
$1,957
State:
$2,570
(% of AGI for various income ranges: 4.5% for AGIs below $25k, 0.9% for AGIs $25k-50k)
Percentage of individuals using paid preparers for their 2012 taxes: 45.7%
Here:
46%
State:
51%
(% for various income ranges: 40.6% for AGIs below $25k, 44.6% for AGIs $25k-50k, 46.2% for AGIs $50k-75k, 43.5% for AGIs $75k-100k, 47.3% for AGIs $100k-200k, 69.1% for AGIs over 200k)
Averages for the 2004 tax year for zip code 75087, filed in 2005:
Average Adjusted Gross Income (AGI) in 2004: $70,028 (Individual Income Tax Returns)
Here:
$70,028
State:
$47,881
Salary/wage: $62,593 (reported on 84.9% of returns)
Here:
$62,593
State:
$41,947
(% of AGI for various income ranges: 75.4% for AGIs $10k-25k, 79.1% for AGIs $25k-50k, 79.6% for AGIs $50k-75k, 82.8% for AGIs $75k-100k, 70.4% for AGIs over 100k)
Taxable interest for individuals: $2,245 (reported on 50.4% of returns)
This zip code:
$2,245
Texas:
$2,255
(% of AGI for various income ranges: 3.5% for AGIs $10k-25k, 1.8% for AGIs $25k-50k, 1.5% for AGIs $50k-75k, 0.9% for AGIs $75k-100k, 1.6% for AGIs over 100k)
Taxable dividends: $3,282 (reported on 28.3% of returns)
Here:
$3,282
State:
$4,261
(% of AGI for various income ranges: 1.6% for AGIs $10k-25k, 0.9% for AGIs $25k-50k, 0.9% for AGIs $50k-75k, 0.8% for AGIs $75k-100k, 1.6% for AGIs over 100k)
Net capital gain/loss: +$13,164 (reported on 26.1% of returns)
Here:
+$13,164
State:
+$16,110
(% of AGI for various income ranges: 0.3% for AGIs $10k-25k, 0.2% for AGIs $25k-50k, 0.7% for AGIs $50k-75k, 0.9% for AGIs $75k-100k, 8.1% for AGIs over 100k)
Profit/loss from business: +$13,952 (reported on 23.8% of returns)
Here:
+$13,952
State:
+$11,013
(% of AGI for various income ranges: 7.0% for AGIs $10k-25k, 4.7% for AGIs $25k-50k, 4.9% for AGIs $50k-75k, 3.7% for AGIs $75k-100k, 5.2% for AGIs over 100k)
IRA payment deduction: $3,399 (reported on 3.1% of returns)
75087:
$3,399
Texas:
$3,120
(% of AGI for various income ranges: 0.2% for AGIs $10k-25k, 0.3% for AGIs $25k-50k, 0.2% for AGIs $50k-75k, 0.2% for AGIs $75k-100k, 0.1% for AGIs over 100k)
Self-employed pension: $14,009 (reported on 1.2% of returns)
Here:
$14,009
Texas:
$16,401
(% of AGI for various income ranges: 0.1% for AGIs $10k-25k, 0.1% for AGIs $50k-75k, 0.1% for AGIs $75k-100k, 0.3% for AGIs over 100k)
Total itemized deductions: $20,897 (21% of AGI, reported on 51.6% of returns)
Here:
$20,897
State:
$19,631
Here:
20.6% of AGI
State:
18.9% of AGI
(% of AGI for various income ranges: 17.7% for AGIs $10k-25k, 18.4% for AGIs $25k-50k, 19.5% for AGIs $50k-75k, 17.8% for AGIs $75k-100k, 12.7% for AGIs over 100k)
Charity contributions deductions: $4,496 (4% of AGI, reported on 44.9% of returns)
Here:
$4,496
State:
$4,753
Here:
4.3% of AGI
State:
4.2% of AGI
(% of AGI for various income ranges: 1.9% for AGIs $10k-25k, 2.5% for AGIs $25k-50k, 2.8% for AGIs $50k-75k, 2.8% for AGIs $75k-100k, 3.0% for AGIs over 100k)
Total tax: $12,042 (reported on 81.4% of returns)
75087:
$12,042
State:
$9,058
(% of AGI for various income ranges: 4.6% for AGIs $10k-25k, 7.0% for AGIs $25k-50k, 8.7% for AGIs $50k-75k, 10.1% for AGIs $75k-100k, 18.1% for AGIs over 100k)
Earned income credit: $1,618 (reported on 7.9% of returns)
Here:
$1,618
State:
$2,024
Percentage of individuals using paid preparers for their 2004 taxes: 51.4%
Here:
51%
State:
57%
(% for various income ranges: 44.7% for AGIs below $10k, 53.9% for AGIs $10k-25k, 52.2% for AGIs $25k-50k, 52.6% for AGIs $50k-75k, 49.1% for AGIs $75k-100k, 55.0% for AGIs over 100k)
Likely homosexual households (counted as self-reported same-sex unmarried-partner households)
Lesbian couples: 0.1% of all households
Gay men: 0.0% of all households
Household received Food Stamps/SNAP in the past 12 months: 560 Household did not receive Food Stamps/SNAP in the past 12 months: 14,382
Women who had a birth in the past 12 months: 562 (550 now married, 21 unmarried) Women who did not have a birth in the past 12 months: 8,539 (5,312 now married, 3,178 unmarried)
Housing units in zip code 75087 with a mortgage: 9,191 (407 second mortgage, 206 both second mortgage and home equity loan) Houses without a mortgage: 37
Median monthly owner costs for units with a mortgage: $2,515 Median monthly owner costs for units without a mortgage: $860
Residents with income below the poverty level in 2022:
This zip code:
3.2%
Whole state:
14.0%
Residents with income below 50% of the poverty level in 2022:
This zip code:
1.9%
Whole state:
7.4%
Median number of rooms in houses and condos:
Here:
8.0
State:
6.3
Median number of rooms in apartments:
Here:
4.5
State:
4.0
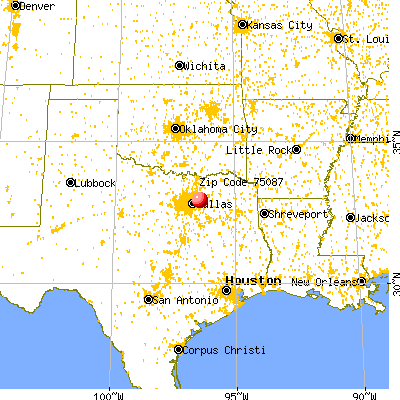
Notable locations in this zip code not listed on our city pages
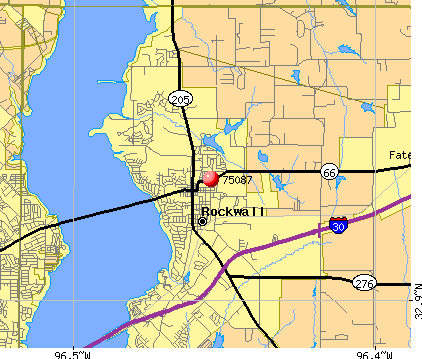
Notable locations in zip code 75087: Camp Lincoln (A), Rockwall County Courthouse (B), Rockwall County Library (C), Rockwall Fire Department Station 1 (D), Rockwall County Emergency Medical Service (E). Display/hide their locations on the map
Churches in zip code 75087 include: His Covenant Children Church (A), First Presbyterian Church (B), Free Methodist Church (C), Our Lady of the Lake Catholic Church (D), New Caldonia Baptist Church (E), Bethel Baptist Church (F), New Horizons Assembly of God Church (G). Display/hide their locations on the map
Lakes and reservoirs: Corder Lake (A), Stodghill Lake (B), Sands Lake (C), Railroad Tank (D), Phelps Lake (E), Nelson Lake (F), Greenes Lake (G), Crenshaw Lake (H). Display/hide their locations on the map
Parks in zip code 75087 include: Rockwall City Park (1), Wilkerson - Sanders Memorial Field (2), Hobart Wisdom Field (3), Herman E Utley Freshman Center Baseball Field (4). Display/hide their locations on the map
In group quarters: 533 (-1 institutionalized population)
Size of family households: 4,104 2-persons, 2,819 3-persons, 2,964 4-persons, 1,284 5-persons, 502 6-persons, 156 7-or-more-persons
Size of nonfamily households: 2,481 1-person, 579 2-persons, 10 3-persons
9,068 married couples with children.
1,394 single-parent households (574 men, 820 women).
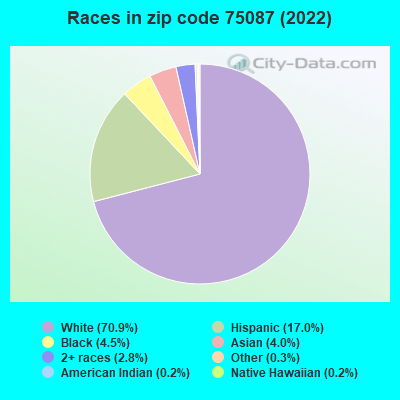
89.4% of residents of 75087 zip code speak English at home.
6.1% of residents speak Spanish at home (71% very well, 16% well, 10% not well, 3% not at all).
1.8% of residents speak other Indo-European language at home (68% very well, 22% well, 10% not well).
2.6% of residents speak Asian or Pacific Island language at home (82% very well, 10% well, 4% not well, 4% not at all).
0.3% of residents speak other language at home (91% very well, 9% well).
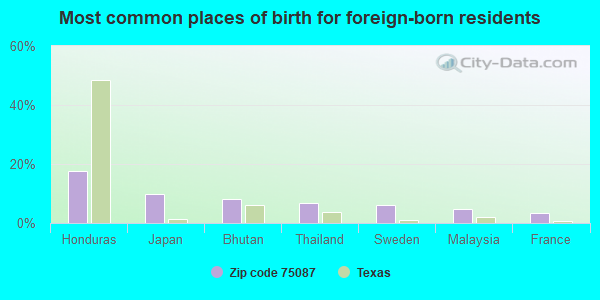
Foreign born population: 3,068 (7.4%) (65.9% of them are naturalized citizens)
Facilities with environmental interests located in this zip code:
B F JORDAN TRUCKS INC (2260 INTERSTATE 30 in ROCKWALL, TX)
(Resource Conservation and Recovery Act (tracking hazardous waste)) Alternative names: BF JORDAN TRUCKS INC
Housing units lacking complete plumbing facilities: 0.3% Housing units lacking complete kitchen facilities: 1.0%
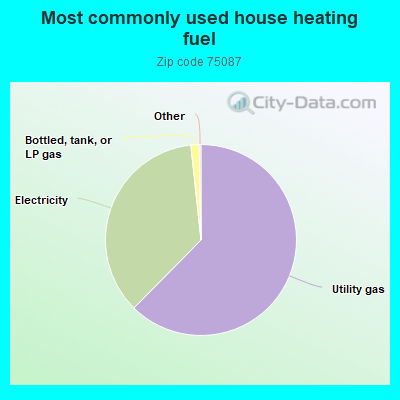
62.4%Utility gas
35.9%Electricity
1.4%Bottled, tank, or LP gas
Population in 1990: 17,438.
Place of birth for U.S.-born residents:
This state: 24,049
Northeast: 1,102
Midwest: 4,129
South: 4,640
West: 3,895
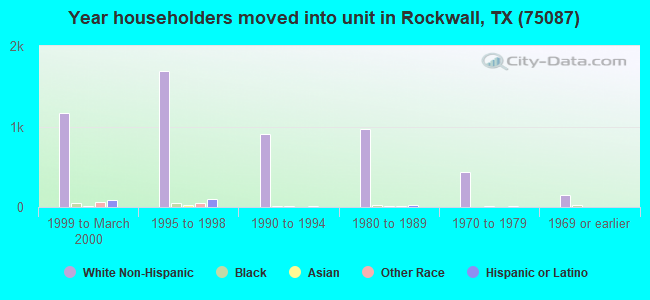
49% of the 75087 zip code residents lived in the same house 5 years ago. Out of people who lived in different houses, 29% lived in this county. Out of people who lived in different counties, 50% lived in Texas.
85% of the 75087 zip code residents lived in the same house 1 year ago. Out of people who lived in different houses, 20% moved from this county. Out of people who lived in different houses, 57% moved from different county within same state. Out of people who lived in different houses, 22% moved from different state. Out of people who lived in different houses, 5% moved from abroad.
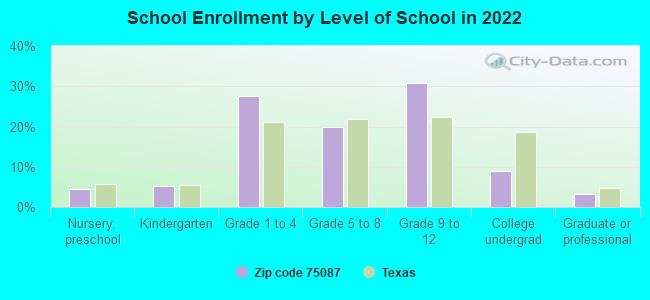
Private vs. public school enrollment:
Students in private schools in grades 1 to 8 (elementary and middle school): 415
Here:
8.2%
Texas:
8.8%
Students in private schools in grades 9 to 12 (high school): 339
Here:
10.3%
Texas:
8.0%
Students in private undergraduate colleges: 179
Here:
18.8%
Texas:
16.2%
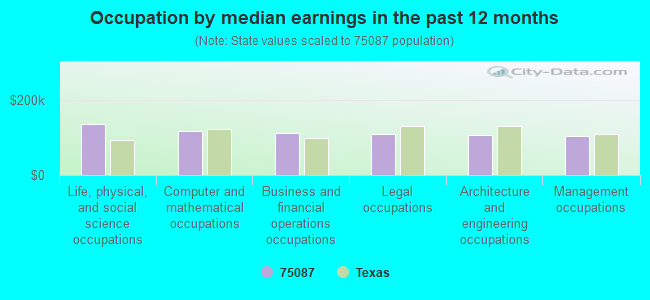
Occupation by median earnings in the past 12 months ($)
135,973Life, physical, and social science occupations
118,775Computer and mathematical occupations
112,700Business and financial operations occupations
109,980Legal occupations
106,808Architecture and engineering occupations
103,907Management occupations
Companies with federal contracts located in this zip code (ROCKWALL, TX):
CAE SOFT CORP (750 JUSTIN ROAD, 2ND FLOOR; small business) : $4,425,617 in 28 contractsfrom 2000 to 2006
Contracts for Other Defense -- Applied Research and Exploratory Development (R&D), Defense Electronics and Communication Equipment -- Advanced Development (R&D), Other Defense -- Advanced Development (R&D), Other Defense -- Basic Research (R&D), and moreby Air Force, Navy Signed by year:2000: $75,000; 2001: $456,710; 2002: $549,642; 2003: $1,766,454; 2004: $594,466; 2005: $389,703; 2006: $593,642.
Biggest contracts:
$950,000 with Air Force for Other Defense -- Applied Research and Exploratory Development (R&D). Signed on 2003-08-21. Completion date: 2006-11-20.
$375,000, same as above.Signed on 2003-04-07. Completion date: 2005-08-01.
$363,787, same as above.Signed on 2004-03-12. Completion date: 2005-08-01.
$339,372, same as above.Signed on 2002-03-01. Completion date: 2003-05-30.
PRECISION CABLE MFG CO INC (1290 E 130; small business) : $1,119,422 in 25 contractsfrom 1999 to 2005
Contracts for Switches, Resistors, Headsets, Handsets, Microphones and Speakers, Lugs, Terminals, and Terminal Strips, and moreby Defense Logistics Agency, Army, Air Force Signed by year:2000: $160,690; 2001: $270,366; 2002: $309,719; 2003: $51,700; 2004: $171,232; 2005: $27,475; 2006: $0.
Biggest contracts:
$165,000 with Defense Logistics Agency for Switches. Signed on 2004-08-12. Completion date: 2005-01-17.
$98,900, same as above.Signed on 2002-03-18. Completion date: 2002-06-26.
$98,900, same as above.Signed on 2002-04-18. Completion date: 2002-07-17.
$85,459 with Defense Logistics Agency for Resistors. Signed on 2002-01-29. Completion date: 2002-05-08.
COMMISARY SERVICES CORP (501 NASH STREET; small business) : $1,084,682 in 15 contractsfrom 2000 to 2006
Contracts for Other Housekeeping Services, Custodial Janitorial Services by Defense Commissary Agency, Department of Defense Signed by year:2000: $104,843; 2001: $109,906; 2002: $129,899; 2003: $113,751; 2004: $192,078; 2005: $340,057; 2006: $94,148.
Biggest contracts:
$184,654 with Defense Commissary Agency for Other Housekeeping Services. Taking place in FL. Signed on 2005-05-27. Completion date: 2006-06-30.
$162,326, same as above.Signed on 2004-05-20. Completion date: 2005-06-30.
$161,598 with Defense Commissary Agency for Other Housekeeping Services. Taking place in NY. Signed on 2005-03-01. Completion date: 2006-03-31.
$129,899 with Department of Defense for Other Housekeeping Services. Signed on 2002-02-28. Completion date: 2003-03-31.
GLOBAL CONTOUR LTD (1145 RIDGE RD W; small business) : $539,365 in 6 contractsfrom 2002 to 2005
Contracts for Defense Aircraft -- Operational Systems Development (R&D), Physical Sciences -- Management and Support (R&D), Systems Engineering Services, Other Research and Development -- Applied Research and Exploratory Development (R&D), and moreby Air Force, Army Signed by year:2000: $0; 2001: $0; 2002: $169,464; 2003: $199,902; 2004: $0; 2005: $169,999; 2006: $0.
Biggest contracts:
$100,000 with Air Force for Defense Aircraft -- Operational Systems Development (R&D). Signed on 2005-03-29. Completion date: 2005-10-29.
$99,951 with Air Force for Physical Sciences -- Management and Support (R&D). Signed on 2003-09-12. Completion date: 2004-06-14.
$99,951, same as above.Signed on 2003-08-27. Completion date: 2004-06-14.
$99,520 with Air Force for Systems Engineering Services. Signed on 2002-09-16. Completion date: 2003-09-30.
DAL TECHNOLOGIES, INC (519 INTERSTATE 30 147; small business) : $312,558 in 18 contractsfrom 2004 to 2006
Contracts for Landscaping/Groundskeeping Services by Army, U.S. Army Corps of Engineers - civil program financing only, Air Force Signed by year:2000: $0; 2001: $0; 2002: $0; 2003: $0; 2004: $11,769; 2005: $256,957; 2006: $43,832.
Biggest contracts:
$153,318 with Army for Landscaping/Groundskeeping Services. Signed on 2005-03-03. Completion date: 2005-09-30.
$18,445, same as above.Signed on 2006-05-17. Completion date: 2006-06-30.
$15,181, same as above.Signed on 2005-10-18. Completion date: 2006-09-30.
$12,222, same as above.Signed on 2006-05-02. Completion date: 2006-04-26.
C TAP LLC (316 S GOLIAD ST STE 205; small business)
$35,084 with Army for Optoelectronic Devices and Associated Hardware. Signed on 2003-09-24. Completion date: 2003-10-23.
TSM CONSULTING (209 ROCKBROOK DR; small business)
$8,512 with Army for Automated Information System Design and Integration Services. Signed on 2003-07-02. Completion date: 2003-07-14.
Top industries in this zip code by the number of employees in 2005:
2003 - 2018 National Fire Incident Reporting System (NFIRS) incidents
Based on the data from the years 2003 - 2018 the average number of fires per year is 68. The highest number of reported fires - 107 took place in 2006, and the least - 15 in 2003. The data has a growing trend.
When looking into fire subcategories, the most incidents belonged to: Outside Fires (43.6%), and Structure Fires (32.0%).
Fire incident types reported to NFIRS in Zip Code 75087


 Nearest zip codes: 75166, 75132, 75032, 75089, 75098, 75088.


 Based on the data from the years 2003 - 2018 the average number of fires per year is 68. The highest number of reported fires - 107 took place in 2006, and the least - 15 in 2003. The data has a growing trend.
 When looking into fire subcategories, the most incidents belonged to: Outside Fires (43.6%), and Structure Fires (32.0%).