Estimated zip code population in 2022: 48,334 Zip code population in 2010: 47,187 Zip code population in 2000: 43,958
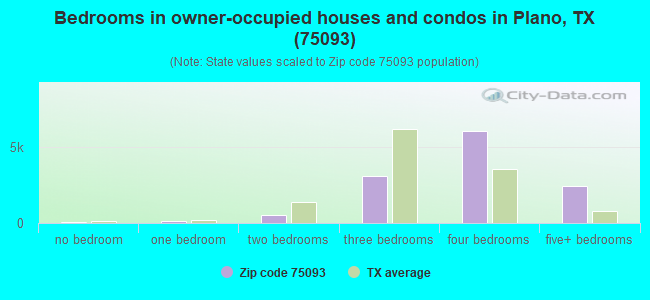
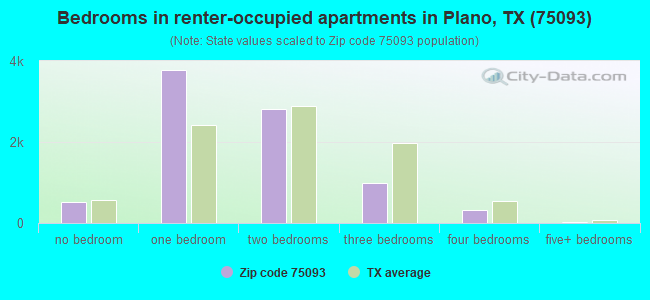
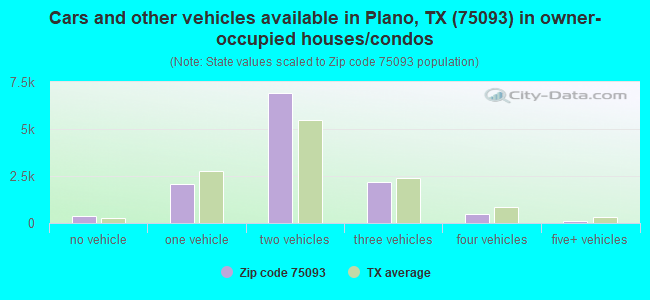
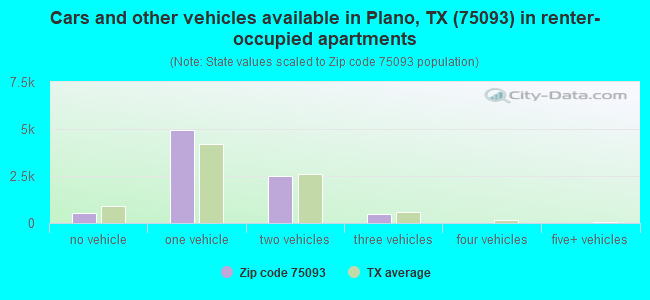
Houses and condos: 21,554 Renter-occupied apartments: 8,450
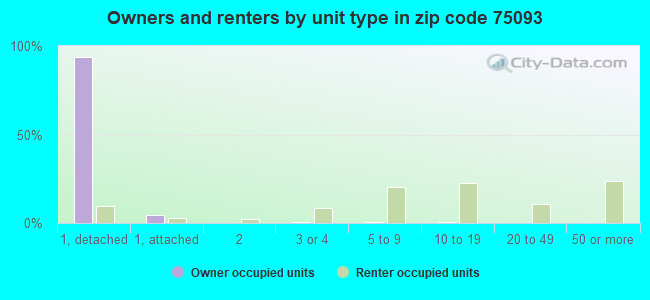
% of renters here:
41%
State:
38%
March 2022 cost of living index in zip code 75093: 97.9 (near average, U.S. average is 100)
Land area: 14.1 sq. mi. Water area: 0.1 sq. mi.
Population density: 3,424 people per square mile
(average).
OSM Map
General Map
Google Map
MSN Map
OSM Map
General Map
Google Map
MSN Map
OSM Map
General Map
Google Map
MSN Map
OSM Map
General Map
Google Map
MSN Map
Please wait while loading the map...
Real estate property taxes paid for housing units in 2022:
This zip code:
1.5% ($10,306)
Texas:
1.5% ($4,050)
Median real estate property taxes paid for housing units with mortgages in 2022: $10,151 (1.5%) Median real estate property taxes paid for housing units with no mortgage in 2022: $10,700 (1.5%)
Estimated median house/condo value in 2022: $681,094
75093:
$681,094
Texas:
$275,400
According to our research of Texas and other state lists, there were 14 registered sex offenders living in 75093 zip code as of April 27, 2024. The ratio of all residents to sex offenders in zip code 75093 is 3,478 to 1. The ratio of registered sex offenders to all residents in this zip code is much lower than the state average.
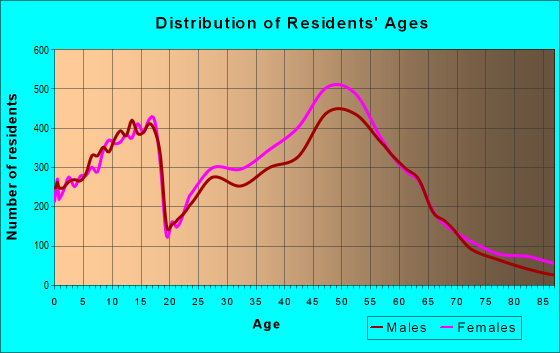
Median resident age:
This zip code:
43.3 years
Texas median age:
35.6 years
Average household size:
This zip code:
2.3 people
Texas:
2.6 people
Averages for the 2020 tax year for zip code 75093, filed in 2021:
Average Adjusted Gross Income (AGI) in 2020: $193,680 (Individual Income Tax Returns)
Here:
$193,680
State:
$77,054
Salary/wage: $136,265 (reported on 81.0% of returns)
Here:
$136,265
State:
$62,766
(% of AGI for various income ranges: 1189.3% for AGIs below $25k, 3724.1% for AGIs $25k-50k, 6894.5% for AGIs $50k-75k, 9926.4% for AGIs $75k-100k, 18760.2% for AGIs $100k-200k, 112889.6% for AGIs over 200k)
Taxable interest for individuals: $5,785 (reported on 45.1% of returns)
This zip code:
$5,785
Texas:
$2,665
(% of AGI for various income ranges: 36.9% for AGIs below $25k, 52.6% for AGIs $25k-50k, 83.0% for AGIs $50k-75k, 136.1% for AGIs $75k-100k, 282.6% for AGIs $100k-200k, 3169.7% for AGIs over 200k)
Ordinary dividends: $21,655 (reported on 41.5% of returns)
Here:
$21,655
State:
$10,044
(% of AGI for various income ranges: 78.4% for AGIs below $25k, 115.2% for AGIs $25k-50k, 193.9% for AGIs $50k-75k, 323.0% for AGIs $75k-100k, 774.6% for AGIs $100k-200k, 11698.3% for AGIs over 200k)
Net capital gain/loss in AGI: +$66,678 (reported on 40.8% of returns)
Here:
+$66,678
State:
+$39,590
(% of AGI for various income ranges: 35.3% for AGIs below $25k, 161.6% for AGIs $25k-50k, 214.3% for AGIs $50k-75k, 349.5% for AGIs $75k-100k, 938.4% for AGIs $100k-200k, 39529.2% for AGIs over 200k)
Profit/loss from business: +$32,906 (reported on 22.3% of returns)
Here:
+$32,906
State:
+$10,888
(% of AGI for various income ranges: 147.7% for AGIs below $25k, 212.4% for AGIs $25k-50k, 240.9% for AGIs $50k-75k, 432.0% for AGIs $75k-100k, 1003.0% for AGIs $100k-200k, 8282.3% for AGIs over 200k)
Taxable individual retirement arrangement distribution: $37,174 (reported on 11.3% of returns)
75093:
$37,174
Texas:
$24,740
(% of AGI for various income ranges: 66.2% for AGIs below $25k, 132.6% for AGIs $25k-50k, 267.2% for AGIs $50k-75k, 517.1% for AGIs $75k-100k, 1248.9% for AGIs $100k-200k, 3268.4% for AGIs over 200k)
Self-employed (Keogh) retirement plans: $33,741 (reported on 2.1% of returns)
75093:
$33,741
Texas:
$29,298
(% of AGI for various income ranges: 19.7% for AGIs $50k-75k, 78.5% for AGIs $100k-200k, 922.9% for AGIs over 200k)
Total itemized deductions: $55,395 (reported on 18.0% of returns)
Here:
$55,395
State:
$40,428
(% of AGI for various income ranges: 120.0% for AGIs below $25k, 194.3% for AGIs $25k-50k, 349.4% for AGIs $50k-75k, 558.5% for AGIs $75k-100k, 1377.6% for AGIs $100k-200k, 11576.6% for AGIs over 200k)
Charity contributions: $29,202 (reported on 15.7% of returns)
Here:
$29,202
State:
$18,201
(% of AGI for various income ranges: 8.3% for AGIs below $25k, 25.3% for AGIs $25k-50k, 48.7% for AGIs $50k-75k, 117.0% for AGIs $75k-100k, 333.9% for AGIs $100k-200k, 6306.2% for AGIs over 200k)
Taxes paid: $8,944 (reported on 17.7% of returns)
75093:
$8,944
State:
$7,821
(% of AGI for various income ranges: 24.1% for AGIs below $25k, 45.2% for AGIs $25k-50k, 82.6% for AGIs $50k-75k, 146.0% for AGIs $75k-100k, 349.5% for AGIs $100k-200k, 1511.0% for AGIs over 200k)
Earned income credit: $1,961 (reported on 6.8% of returns)
Here:
$1,961
State:
$2,584
(% of AGI for various income ranges: 60.7% for AGIs below $25k, 40.4% for AGIs $25k-50k)
Percentage of individuals using paid preparers for their 2020 taxes: 91.4%
Here:
91%
State:
92%
(% for various income ranges: 89.7% for AGIs below $25k, 91.3% for AGIs $25k-50k, 92.5% for AGIs $50k-75k, 90.7% for AGIs $75k-100k, 91.7% for AGIs $100k-200k, 92.4% for AGIs over 200k)
Averages for the 2012 tax year for zip code 75093, filed in 2013:
Average Adjusted Gross Income (AGI) in 2012: $171,169 (Individual Income Tax Returns)
Here:
$171,169
State:
$65,384
Salary/wage: $122,629 (reported on 84.4% of returns)
Here:
$122,629
State:
$52,524
(% of AGI for various income ranges: 76.5% for AGIs below $25k, 82.5% for AGIs $25k-50k, 79.2% for AGIs $50k-75k, 75.4% for AGIs $75k-100k, 76.2% for AGIs $100k-200k, 53.5% for AGIs over 200k)
Taxable interest for individuals: $4,359 (reported on 48.4% of returns)
This zip code:
$4,359
Texas:
$2,372
(% of AGI for various income ranges: 2.3% for AGIs below $25k, 1.1% for AGIs $25k-50k, 1.0% for AGIs $50k-75k, 1.2% for AGIs $75k-100k, 1.0% for AGIs $100k-200k, 1.3% for AGIs over 200k)
Ordinary dividends: $14,053 (reported on 39.9% of returns)
Here:
$14,053
State:
$9,721
(% of AGI for various income ranges: 4.6% for AGIs below $25k, 2.2% for AGIs $25k-50k, 2.3% for AGIs $50k-75k, 2.7% for AGIs $75k-100k, 2.6% for AGIs $100k-200k, 3.5% for AGIs over 200k)
Net capital gain/loss in AGI: +$55,710 (reported on 37.7% of returns)
Here:
+$55,710
State:
+$35,319
(% of AGI for various income ranges: 0.3% for AGIs below $25k, 0.4% for AGIs $25k-50k, 0.2% for AGIs $50k-75k, 1.0% for AGIs $75k-100k, 1.5% for AGIs $100k-200k, 16.9% for AGIs over 200k)
Profit/loss from business: +$32,906 (reported on 21.3% of returns)
Here:
+$32,906
State:
+$13,732
(% of AGI for various income ranges: 9.5% for AGIs below $25k, 5.0% for AGIs $25k-50k, 4.0% for AGIs $50k-75k, 4.7% for AGIs $75k-100k, 5.6% for AGIs $100k-200k, 3.6% for AGIs over 200k)
Taxable individual retirement arrangement distribution: $37,904 (reported on 11.2% of returns)
75093:
$37,904
Texas:
$19,511
(% of AGI for various income ranges: 3.5% for AGIs below $25k, 2.4% for AGIs $25k-50k, 4.2% for AGIs $50k-75k, 4.0% for AGIs $75k-100k, 4.0% for AGIs $100k-200k, 1.9% for AGIs over 200k)
Self-employment retirement plans: $29,214 (reported on 2.4% of returns)
75093:
$29,214
Texas:
$23,938
(% of AGI for various income ranges: 0.4% for AGIs $25k-50k, 0.2% for AGIs $75k-100k, 0.4% for AGIs $100k-200k, 0.5% for AGIs over 200k)
Total itemized deductions: $35,092 (11% of AGI, reported on 46.2% of returns)
Here:
$35,092
State:
$24,724
Here:
11.2% of AGI
State:
15.9% of AGI
(% of AGI for various income ranges: 17.6% for AGIs below $25k, 11.4% for AGIs $25k-50k, 12.8% for AGIs $50k-75k, 14.0% for AGIs $75k-100k, 14.0% for AGIs $100k-200k, 7.7% for AGIs over 200k)
Charity contributions: $9,602 (reported on 40.1% of returns)
Here:
$9,602
State:
$6,808
(% of AGI for various income ranges: 1.0% for AGIs below $25k, 1.2% for AGIs $25k-50k, 1.6% for AGIs $50k-75k, 2.0% for AGIs $75k-100k, 2.3% for AGIs $100k-200k, 2.4% for AGIs over 200k)
Taxes paid: $11,792 (reported on 45.6% of returns)
75093:
$11,792
State:
$6,921
(% of AGI for various income ranges: 4.0% for AGIs below $25k, 3.0% for AGIs $25k-50k, 3.6% for AGIs $50k-75k, 4.2% for AGIs $75k-100k, 5.0% for AGIs $100k-200k, 2.6% for AGIs over 200k)
Earned income credit: $1,806 (reported on 7.1% of returns)
Here:
$1,806
State:
$2,570
(% of AGI for various income ranges: 3.5% for AGIs below $25k, 0.6% for AGIs $25k-50k)
Percentage of individuals using paid preparers for their 2012 taxes: 49.5%
Here:
50%
State:
51%
(% for various income ranges: 44.5% for AGIs below $25k, 41.9% for AGIs $25k-50k, 43.4% for AGIs $50k-75k, 49.0% for AGIs $75k-100k, 50.0% for AGIs $100k-200k, 67.2% for AGIs over 200k)
Averages for the 2004 tax year for zip code 75093, filed in 2005:
Average Adjusted Gross Income (AGI) in 2004: $145,562 (Individual Income Tax Returns)
Here:
$145,562
State:
$47,881
Salary/wage: $117,114 (reported on 84.6% of returns)
Here:
$117,114
State:
$41,947
(% of AGI for various income ranges: 79.7% for AGIs $10k-25k, 85.3% for AGIs $25k-50k, 81.5% for AGIs $50k-75k, 81.3% for AGIs $75k-100k, 62.9% for AGIs over 100k)
Taxable interest for individuals: $4,304 (reported on 60.0% of returns)
This zip code:
$4,304
Texas:
$2,255
(% of AGI for various income ranges: 3.3% for AGIs $10k-25k, 1.9% for AGIs $25k-50k, 2.1% for AGIs $50k-75k, 1.8% for AGIs $75k-100k, 1.6% for AGIs over 100k)
Taxable dividends: $6,996 (reported on 46.4% of returns)
Here:
$6,996
State:
$4,261
(% of AGI for various income ranges: 2.8% for AGIs $10k-25k, 1.4% for AGIs $25k-50k, 2.0% for AGIs $50k-75k, 1.9% for AGIs $75k-100k, 2.1% for AGIs over 100k)
Net capital gain/loss: +$50,198 (reported on 44.0% of returns)
Here:
+$50,198
State:
+$16,110
(% of AGI for various income ranges: 0.8% for AGIs $10k-25k, 0.4% for AGIs $25k-50k, 0.9% for AGIs $50k-75k, 1.7% for AGIs $75k-100k, 17.2% for AGIs over 100k)
Profit/loss from business: +$29,743 (reported on 20.7% of returns)
Here:
+$29,743
State:
+$11,013
(% of AGI for various income ranges: 5.8% for AGIs $10k-25k, 4.2% for AGIs $25k-50k, 5.6% for AGIs $50k-75k, 4.9% for AGIs $75k-100k, 4.0% for AGIs over 100k)
IRA payment deduction: $3,787 (reported on 3.6% of returns)
75093:
$3,787
Texas:
$3,120
(% of AGI for various income ranges: 0.3% for AGIs $10k-25k, 0.3% for AGIs $25k-50k, 0.3% for AGIs $50k-75k, 0.3% for AGIs $75k-100k, 0.1% for AGIs over 100k)
Self-employed pension: $21,192 (reported on 3.2% of returns)
Here:
$21,192
Texas:
$16,401
(% of AGI for various income ranges: 0.2% for AGIs $25k-50k, 0.2% for AGIs $50k-75k, 0.3% for AGIs $75k-100k, 0.5% for AGIs over 100k)
Total itemized deductions: $31,779 (13% of AGI, reported on 50.7% of returns)
Here:
$31,779
State:
$19,631
Here:
13.0% of AGI
State:
18.9% of AGI
(% of AGI for various income ranges: 17.9% for AGIs $10k-25k, 14.2% for AGIs $25k-50k, 18.1% for AGIs $50k-75k, 18.3% for AGIs $75k-100k, 9.6% for AGIs over 100k)
Charity contributions deductions: $8,602 (3% of AGI, reported on 45.7% of returns)
Here:
$8,602
State:
$4,753
Here:
3.3% of AGI
State:
4.2% of AGI
(% of AGI for various income ranges: 1.5% for AGIs $10k-25k, 1.6% for AGIs $25k-50k, 2.2% for AGIs $50k-75k, 2.4% for AGIs $75k-100k, 2.7% for AGIs over 100k)
Total tax: $37,625 (reported on 83.0% of returns)
75093:
$37,625
State:
$9,058
(% of AGI for various income ranges: 5.1% for AGIs $10k-25k, 8.3% for AGIs $25k-50k, 10.7% for AGIs $50k-75k, 11.6% for AGIs $75k-100k, 22.8% for AGIs over 100k)
Earned income credit: $1,491 (reported on 5.7% of returns)
Here:
$1,491
State:
$2,024
Percentage of individuals using paid preparers for their 2004 taxes: 51.4%
Here:
51%
State:
57%
(% for various income ranges: 48.1% for AGIs below $10k, 50.9% for AGIs $10k-25k, 43.5% for AGIs $25k-50k, 46.4% for AGIs $50k-75k, 45.6% for AGIs $75k-100k, 60.1% for AGIs over 100k)
Likely homosexual households (counted as self-reported same-sex unmarried-partner households)
Lesbian couples: 0.0% of all households
Gay men: 0.0% of all households
Household received Food Stamps/SNAP in the past 12 months: 49 Household did not receive Food Stamps/SNAP in the past 12 months: 20,417
Women who had a birth in the past 12 months: 660 (387 now married, 268 unmarried) Women who did not have a birth in the past 12 months: 10,114 (4,943 now married, 5,155 unmarried)
Housing units in zip code 75093 with a mortgage: 7,628 (683 second mortgage, 19 home equity loan, 548 both second mortgage and home equity loan) Houses without a mortgage: 46
Median monthly owner costs for units with a mortgage: $3,300 Median monthly owner costs for units without a mortgage: $1,512
Residents with income below the poverty level in 2022:
This zip code:
5.9%
Whole state:
14.0%
Residents with income below 50% of the poverty level in 2022:
This zip code:
1.5%
Whole state:
7.4%
Median number of rooms in houses and condos:
Here:
8.3
State:
6.3
Median number of rooms in apartments:
Here:
3.4
State:
4.0
Notable locations in this zip code not listed on our city pages
Notable locations in zip code 75093: The Shops at Willow Bend (A), W O Haggard, Junior Library (B), Plano Fire Department Station 5 (C), Plano Fire Department Station 9 (D). Display/hide their locations on the map
Churches in zip code 75093 include: Grace Presbyterian Church (A), Willow Bend Baptist Church (B), Parkway Hills Baptist Church (C), Christ Our King Community Church (D), Liberty Church (E). Display/hide their locations on the map
7,338 married couples with children.
2,006 single-parent households (449 men, 1,557 women).
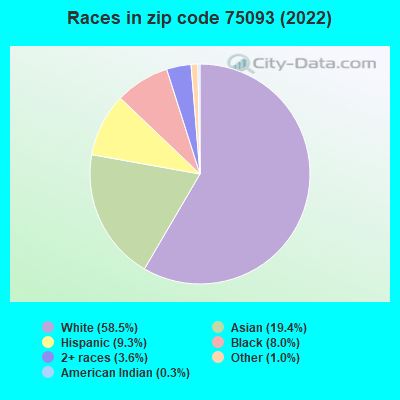
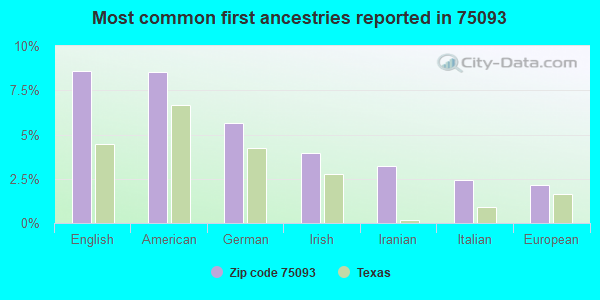
69.3% of residents of 75093 zip code speak English at home.
6.3% of residents speak Spanish at home (74% very well, 19% well, 8% not well).
11.8% of residents speak other Indo-European language at home (76% very well, 18% well, 4% not well, 2% not at all).
12.3% of residents speak Asian or Pacific Island language at home (73% very well, 19% well, 8% not well, 1% not at all).
1.7% of residents speak other language at home (86% very well, 11% well, 3% not at all).
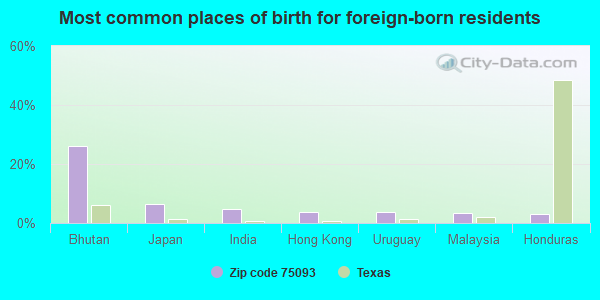
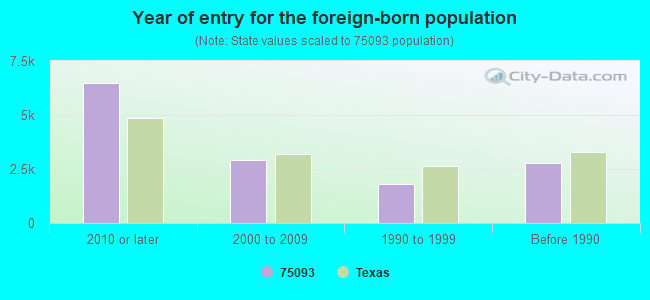
Foreign born population: 12,850 (26.6%) (48.8% of them are naturalized citizens)
Facilities with environmental interests located in this zip code:
BARKSDALE EL (2424 MIDWAY in PLANO, TX)
(National Center for Education Statistics) - STATE ID-043910132 Organizations: PLANO ISD (SCHOOL DISTRICT)
Housing units lacking complete plumbing facilities: 0.0% Housing units lacking complete kitchen facilities: 1.4%
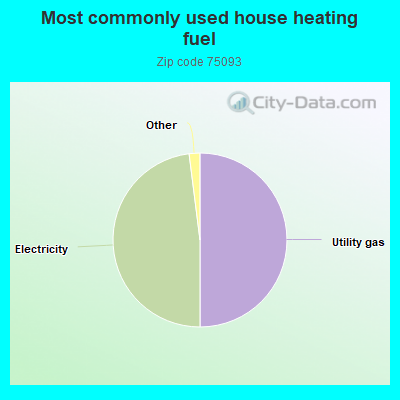
50.0%Utility gas
48.0%Electricity
0.7%No fuel used
0.6%Bottled, tank, or LP gas
Population in 1990: 14,376. Population change in the 1990s: +29,582 (+205.8%).
Place of birth for U.S.-born residents:
This state: 18,601
Northeast: 3,912
Midwest: 4,503
South: 5,665
West: 2,288
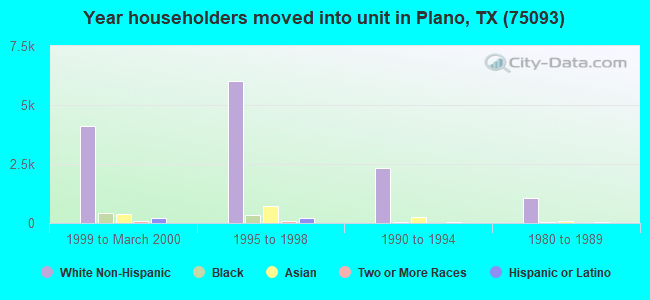
33% of the 75093 zip code residents lived in the same house 5 years ago. Out of people who lived in different houses, 30% lived in this county. Out of people who lived in different counties, 50% lived in Texas.
86% of the 75093 zip code residents lived in the same house 1 year ago. Out of people who lived in different houses, 33% moved from this county. Out of people who lived in different houses, 41% moved from different county within same state. Out of people who lived in different houses, 23% moved from different state. Out of people who lived in different houses, 6% moved from abroad.
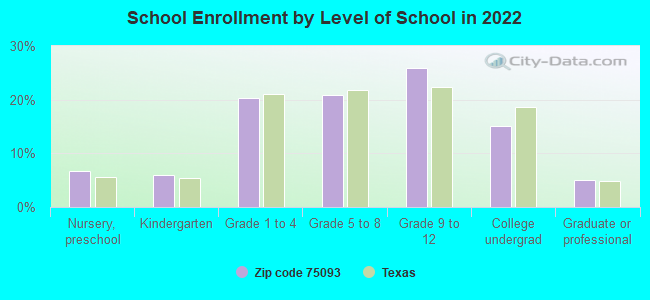
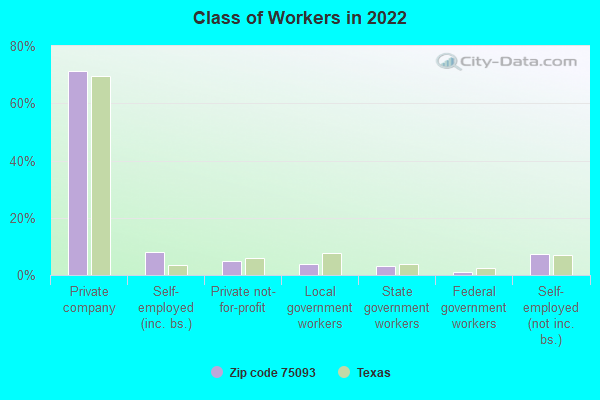
Private vs. public school enrollment:
Students in private schools in grades 1 to 8 (elementary and middle school): 901
Here:
21.8%
Texas:
8.8%
Students in private schools in grades 9 to 12 (high school): 471
Here:
18.2%
Texas:
8.0%
Students in private undergraduate colleges: 356
Here:
23.7%
Texas:
16.2%
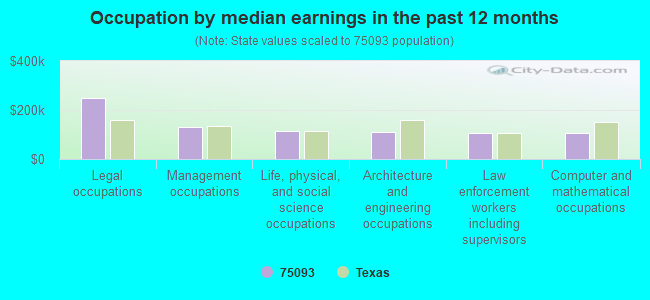
Occupation by median earnings in the past 12 months ($)
248,539Legal occupations
129,428Management occupations
114,547Life, physical, and social science occupations
111,082Architecture and engineering occupations
107,406Law enforcement workers including supervisors
106,688Computer and mathematical occupations
Companies with biggest federal contracts located in this zip code (PLANO, TX):
SIGNAL TECHNOLOGY CORPORATION (1820 PRESTON PARK BLVD STE) : $47,768,934 in 12 contractsfrom 2003 to 2006
Contracts for Engineering and Technical Services by Defense Microelectronics Activity, Department of Defense Signed by year:2000: $0; 2001: $0; 2002: $0; 2003: $4,641,485; 2004: $16,031,630; 2005: $14,238,878; 2006: $12,856,941.
Biggest contracts:
$11,029,850 with Defense Microelectronics Activity for Engineering and Technical Services. Signed on 2004-03-25. Completion date: 2005-05-31.
$9,494,408 with Department of Defense for Engineering and Technical Services. Signed on 2005-03-29. Completion date: 2006-05-31.
$7,180,897 with Defense Microelectronics Activity for Engineering and Technical Services. Signed on 2006-05-23. Completion date: 2007-05-31.
$4,711,970 with Department of Defense for Engineering and Technical Services. Signed on 2005-03-16. Completion date: 2006-05-31.
SIGNAL TECHNOLOGY CORPORATION (1800 PRESTON PARK BLVD STE; small business) : $14,757,907 in 3 contractsfrom 2002 to 2003
$6,549,435 with Department of Defense for Engineering and Technical Services. Signed on 2003-04-22. Completion date: 2004-04-30.
$4,115,000, same as above.Signed on 2002-09-26. Completion date: 2003-05-30.
$4,093,472, same as above.Signed on 2002-10-23. Completion date: 2003-06-30.
ASIER TECHNOLOGY CORPORATION (5068 W PLANO PKWY 336; small business) : $2,150,669 in 10 contractsfrom 2002 to 2006
Contracts for Other Research and Development -- Basic Research (R&D), Defense Missile and Space Systems -- Advanced Development (R&D), Other Research and Development -- Engineering Development (R&D), Other Defense -- Applied Research and Exploratory Development (R&D), and moreby Office of Policy, Management and Budget/Chief Financial Officer, Army, Air Force, Navy, and others Signed by year:2000: $0; 2001: $0; 2002: $54,395; 2003: $69,972; 2004: $729,478; 2005: $1,198,132; 2006: $98,692.
Biggest contracts:
$749,312 with Office of Policy, Management and Budget/Chief Financial Officer for Other Research and Development -- Basic Research (R&D). Signed on 2005-03-07. Effective on 2005-03-21. Completion date: 2006-03-14.
$630,000 with Army for Defense Missile and Space Systems -- Advanced Development (R&D). Signed on 2004-04-01. Completion date: 2005-09-30.
$349,014, same as above.Signed on 2005-01-27. Completion date: 2005-09-30.
$99,806, same as above.Signed on 2005-02-15. Completion date: 2005-08-03.
INTERPHASE CORPORATION (2901 DALLAS PKWY STE 200; small business) : $928,486 in 20 contractsfrom 2000 to 2005
Contracts for Electrical and Electronic assemblies, Boards, Cards, and Associated Hardware, Miscellaneous Electrical and Electronic Components, Connectors, Electrical, Electronic Modules, and moreby Navy, Army Signed by year:2000: $95,986; 2001: $328,450; 2002: $396,230; 2003: $28,000; 2004: $15,100; 2005: $64,720; 2006: $0.
Biggest contracts:
$299,750 with Navy for Electrical and Electronic assemblies, Boards, Cards, and Associated Hardware. Signed on 2002-09-16. Completion date: 2002-11-27.
$253,295 with Navy for Miscellaneous Electrical and Electronic Components. Signed on 2001-01-12. Completion date: 2001-03-15.
$96,480 with Navy for Electrical and Electronic assemblies, Boards, Cards, and Associated Hardware. Signed on 2002-04-24. Completion date: 2002-06-24.
$49,186 with Navy for Connectors, Electrical. Signed on 2000-03-27. Completion date: 2000-05-05.
ODEGOS TECHNOLOGY,INC (4433 DENVER DRIVE; small business) : $797,842 in 3 contractsfrom 1999 to 2001
$375,800 with Army for Defense Electronics and Communication Equipment -- Basic Research (R&D). Signed on 2001-08-23. Completion date: 2000-11-01.
$353,162, same as above.Signed on 2000-11-15. Completion date: 2000-11-01.
$68,880, same as above.Signed on 1999-12-15. Completion date: 2000-06-15.
MORIAH TECHNOLOGIES, INCORPORA (5068 W PLANO PARKWAY; small business) : $613,304 in 3 contractsfrom 1999 to 2002
$538,304 with Army for Defense Electronics and Communication Equipment -- Applied Research and Exploratory Development (R&D). Taking place in VA. Signed on 1999-11-18. Completion date: 2001-05-31.
$121,374, same as above.Signed on 2000-09-29. Completion date: 2001-08-31.
-$46,374, same as above.Signed on 2002-12-03. Completion date: 2002-02-28.
MANHATTAN SCIENTIFICS, INC (3204 SLEEPY HOLLOW DRIVE; small business) : $165,000 in 2 contractsfrom 2000 to 2003
$90,000 with Army for Fuel Cell Power Units, Components,and Accessories. Signed on 2003-07-22. Completion date: 2004-09-30.
$75,000 with Army for Other Energy -- Management and Support (R&D). Taking place in NY. Signed on 2000-04-28. Completion date: 2000-08-01.
KRYONYX, INC (4701 CHARLES PL STE 621; small business)
$70,000 with Army for Other Research and Development -- Basic Research (R&D). Signed on 2004-01-09. Completion date: 2004-06-30.
JACKSON & MCMAHAN CO LLC (2613 SHADOW HILL LN; small business)
$44,000 with Air Force for Laboratory Equipment and Supplies. Signed on 2002-04-30. Completion date: 2002-05-01.
JSCA HEALTH LLC (1504 BURNING TREE LN; small business) : $36,660 in 4 contractsfrom 2001 to 2005
$25,910 with Army for Other Professional Services. Signed on 2001-07-13. Completion date: 2001-07-24.
$5,750 with Army for Advertising Services. Taking place in MD. Signed on 2002-10-02. Completion date: 2002-10-09.
$5,000 with Army for Other Professional Services. Taking place in HI. Signed on 2005-10-19. Completion date: 2005-11-10.
$0 with Army for Advertising Services. Taking place in MD. Signed on 2002-10-02. Completion date: 2002-10-09.
Top industries in this zip code by the number of employees in 2005:
Health Care and Social Assistance: Offices of Physicians (except Mental Health Specialists) (500-999 employees: 1 establishment, 50-99 employees: 3 establishments, 20-49 employees: 11 establishments, 10-19 employees: 24 establishments, 5-9 employees: 39 establishments, 1-4 employees: 132 establishments)
2002 - 2018 National Fire Incident Reporting System (NFIRS) incidents
Based on the data from the years 2002 - 2018 the average number of fire incidents per year is 76. The highest number of fires - 105 took place in 2002, and the least - 57 in 2013. The data has a decreasing trend.
When looking into fire subcategories, the most reports belonged to: Outside Fires (41.9%), and Structure Fires (32.5%).
Fire incident types reported to NFIRS in Zip Code 75093


 Nearest zip codes: 75024, 75252, 75287, 75010, 75248, 75075.
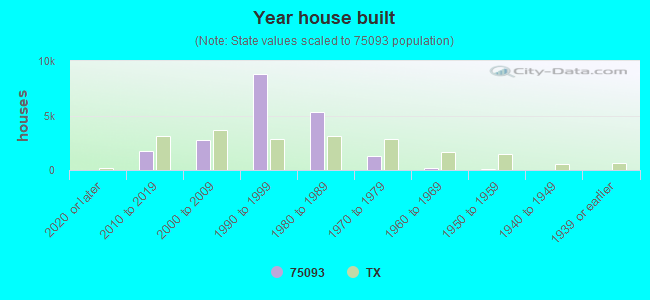


 Based on the data from the years 2002 - 2018 the average number of fire incidents per year is 76. The highest number of fires - 105 took place in 2002, and the least - 57 in 2013. The data has a decreasing trend.
 When looking into fire subcategories, the most reports belonged to: Outside Fires (41.9%), and Structure Fires (32.5%).