Estimated zip code population in 2022: 24,736
Zip code population in 2010: 17,993
Zip code population in 2000: 15,436
Houses and condos: 9,496
Renter-occupied apartments: 3,720
% of renters here:
41%State:
38%
March 2022 cost of living index in zip code 75146: 95.2
(less than average, U.S. average is 100)
Land area: 33.2
sq. mi.
Water area: 0.2
sq. mi.
Population density: 745 people per square mile (low).
OSM Map
General Map
Google Map
MSN Map
OSM Map
General Map
Google Map
MSN Map
OSM Map
General Map
Google Map
MSN Map
OSM Map
General Map
Google Map
MSN Map
Please wait while loading the map...
Real estate property taxes paid for housing units in 2022:
This zip code:
1.7% ($4,165)Texas:
1.5% ($4,050)
Median real estate property taxes paid for housing units with mortgages in 2022: $4,629 (1.8%)
Median real estate property taxes paid for housing units with no mortgage in 2022: $3,467 (1.6%)
Profiles of local businesses
Business Search - 14 Million verified businesses
Males: 10,626 Females: 14,109
For population 25 years and over in 75146:
High school or higher: 89.8%Bachelor's degree or higher: 25.9%Graduate or professional degree: 9.5%Unemployed: 7.6%Mean travel time to work (commute): 29.7 minutes
For population 15 years and over in 75146:
Never married: 33.8%Now married: 46.3%Separated: 2.9%Widowed: 3.8%Divorced: 13.1%
Zip code 75146 compared to state average:
Unemployed percentage above state average. Black race population percentage significantly above state average. Hispanic race population percentage below state average. Foreign-born population percentage significantly below state average. Length of stay since moving in above state average. 16,684 67.5% Black 4,676 18.9% Hispanic or Latino 2,647 10.7% White 475 1.9% Two or more races 252 1.0% Asian
Data:
Median household income ($)
Median household income (% change since 2000)
Household income diversity
Ratio of average income to average house value (%)
Ratio of average income to average rent
Median household income ($) - White
Median household income ($) - Black or African American
Median household income ($) - Asian
Median household income ($) - Hispanic or Latino
Median household income ($) - American Indian and Alaska Native
Median household income ($) - Multirace
Median household income ($) - Other Race
Median household income for houses/condos with a mortgage ($)
Median household income for apartments without a mortgage ($)
Races - White alone (%)
Races - White alone (% change since 2000)
Races - Black alone (%)
Races - Black alone (% change since 2000)
Races - American Indian alone (%)
Races - American Indian alone (% change since 2000)
Races - Asian alone (%)
Races - Asian alone (% change since 2000)
Races - Hispanic (%)
Races - Hispanic (% change since 2000)
Races - Native Hawaiian and Other Pacific Islander alone (%)
Races - Native Hawaiian and Other Pacific Islander alone (% change since 2000)
Races - Two or more races (%)
Races - Two or more races (% change since 2000)
Races - Other race alone (%)
Races - Other race alone (% change since 2000)
Racial diversity
Unemployment (%)
Unemployment (% change since 2000)
Unemployment (%) - White
Unemployment (%) - Black or African American
Unemployment (%) - Asian
Unemployment (%) - Hispanic or Latino
Unemployment (%) - American Indian and Alaska Native
Unemployment (%) - Multirace
Unemployment (%) - Other Race
Population density (people per square mile)
Population - Males (%)
Population - Females (%)
Population - Males (%) - White
Population - Males (%) - Black or African American
Population - Males (%) - Asian
Population - Males (%) - Hispanic or Latino
Population - Males (%) - American Indian and Alaska Native
Population - Males (%) - Multirace
Population - Males (%) - Other Race
Population - Females (%) - White
Population - Females (%) - Black or African American
Population - Females (%) - Asian
Population - Females (%) - Hispanic or Latino
Population - Females (%) - American Indian and Alaska Native
Population - Females (%) - Multirace
Population - Females (%) - Other Race
Coronavirus confirmed cases (Apr 27, 2024)
Deaths caused by coronavirus (Apr 27, 2024)
Coronavirus confirmed cases (per 100k population) (Apr 27, 2024)
Deaths caused by coronavirus (per 100k population) (Apr 27, 2024)
Daily increase in number of cases (Apr 27, 2024)
Weekly increase in number of cases (Apr 27, 2024)
Cases doubled (in days) (Apr 27, 2024)
Hospitalized patients (Apr 18, 2022)
Negative test results (Apr 18, 2022)
Total test results (Apr 18, 2022)
COVID Vaccine doses distributed (per 100k population) (Sep 19, 2023)
COVID Vaccine doses administered (per 100k population) (Sep 19, 2023)
COVID Vaccine doses distributed (Sep 19, 2023)
COVID Vaccine doses administered (Sep 19, 2023)
Likely homosexual households (%)
Likely homosexual households (% change since 2000)
Likely homosexual households - Lesbian couples (%)
Likely homosexual households - Lesbian couples (% change since 2000)
Likely homosexual households - Gay men (%)
Likely homosexual households - Gay men (% change since 2000)
Cost of living index
Median gross rent ($)
Median contract rent ($)
Median monthly housing costs ($)
Median house or condo value ($)
Median house or condo value ($ change since 2000)
Mean house or condo value by units in structure - 1, detached ($)
Mean house or condo value by units in structure - 1, attached ($)
Mean house or condo value by units in structure - 2 ($)
Mean house or condo value by units in structure by units in structure - 3 or 4 ($)
Mean house or condo value by units in structure - 5 or more ($)
Mean house or condo value by units in structure - Boat, RV, van, etc. ($)
Mean house or condo value by units in structure - Mobile home ($)
Median house or condo value ($) - White
Median house or condo value ($) - Black or African American
Median house or condo value ($) - Asian
Median house or condo value ($) - Hispanic or Latino
Median house or condo value ($) - American Indian and Alaska Native
Median house or condo value ($) - Multirace
Median house or condo value ($) - Other Race
Median resident age
Resident age diversity
Median resident age - Males
Median resident age - Females
Median resident age - White
Median resident age - Black or African American
Median resident age - Asian
Median resident age - Hispanic or Latino
Median resident age - American Indian and Alaska Native
Median resident age - Multirace
Median resident age - Other Race
Median resident age - Males - White
Median resident age - Males - Black or African American
Median resident age - Males - Asian
Median resident age - Males - Hispanic or Latino
Median resident age - Males - American Indian and Alaska Native
Median resident age - Males - Multirace
Median resident age - Males - Other Race
Median resident age - Females - White
Median resident age - Females - Black or African American
Median resident age - Females - Asian
Median resident age - Females - Hispanic or Latino
Median resident age - Females - American Indian and Alaska Native
Median resident age - Females - Multirace
Median resident age - Females - Other Race
Commute - mean travel time to work (minutes)
Travel time to work - Less than 5 minutes (%)
Travel time to work - Less than 5 minutes (% change since 2000)
Travel time to work - 5 to 9 minutes (%)
Travel time to work - 5 to 9 minutes (% change since 2000)
Travel time to work - 10 to 19 minutes (%)
Travel time to work - 10 to 19 minutes (% change since 2000)
Travel time to work - 20 to 29 minutes (%)
Travel time to work - 20 to 29 minutes (% change since 2000)
Travel time to work - 30 to 39 minutes (%)
Travel time to work - 30 to 39 minutes (% change since 2000)
Travel time to work - 40 to 59 minutes (%)
Travel time to work - 40 to 59 minutes (% change since 2000)
Travel time to work - 60 to 89 minutes (%)
Travel time to work - 60 to 89 minutes (% change since 2000)
Travel time to work - 90 or more minutes (%)
Travel time to work - 90 or more minutes (% change since 2000)
Marital status - Never married (%)
Marital status - Now married (%)
Marital status - Separated (%)
Marital status - Widowed (%)
Marital status - Divorced (%)
Median family income ($)
Median family income (% change since 2000)
Median non-family income ($)
Median non-family income (% change since 2000)
Median per capita income ($)
Median per capita income (% change since 2000)
Median family income ($) - White
Median family income ($) - Black or African American
Median family income ($) - Asian
Median family income ($) - Hispanic or Latino
Median family income ($) - American Indian and Alaska Native
Median family income ($) - Multirace
Median family income ($) - Other Race
Median year house/condo built
Median year apartment built
Year house built - Built 2005 or later (%)
Year house built - Built 2000 to 2004 (%)
Year house built - Built 1990 to 1999 (%)
Year house built - Built 1980 to 1989 (%)
Year house built - Built 1970 to 1979 (%)
Year house built - Built 1960 to 1969 (%)
Year house built - Built 1950 to 1959 (%)
Year house built - Built 1940 to 1949 (%)
Year house built - Built 1939 or earlier (%)
Average household size
Household density (households per square mile)
Average household size - White
Average household size - Black or African American
Average household size - Asian
Average household size - Hispanic or Latino
Average household size - American Indian and Alaska Native
Average household size - Multirace
Average household size - Other Race
Occupied housing units (%)
Vacant housing units (%)
Owner occupied housing units (%)
Renter occupied housing units (%)
Vacancy status - For rent (%)
Vacancy status - For sale only (%)
Vacancy status - Rented or sold, not occupied (%)
Vacancy status - For seasonal, recreational, or occasional use (%)
Vacancy status - For migrant workers (%)
Vacancy status - Other vacant (%)
Residents with income below the poverty level (%)
Residents with income below 50% of the poverty level (%)
Children below poverty level (%)
Poor families by family type - Married-couple family (%)
Poor families by family type - Male, no wife present (%)
Poor families by family type - Female, no husband present (%)
Poverty status for native-born residents (%)
Poverty status for foreign-born residents (%)
Poverty among high school graduates not in families (%)
Poverty among people who did not graduate high school not in families (%)
Residents with income below the poverty level (%) - White
Residents with income below the poverty level (%) - Black or African American
Residents with income below the poverty level (%) - Asian
Residents with income below the poverty level (%) - Hispanic or Latino
Residents with income below the poverty level (%) - American Indian and Alaska Native
Residents with income below the poverty level (%) - Multirace
Residents with income below the poverty level (%) - Other Race
Air pollution - Air Quality Index (AQI)
Air pollution - CO
Air pollution - NO2
Air pollution - SO2
Air pollution - Ozone
Air pollution - PM10
Air pollution - PM25
Air pollution - Pb
Crime - Murders per 100,000 population
Crime - Rapes per 100,000 population
Crime - Robberies per 100,000 population
Crime - Assaults per 100,000 population
Crime - Burglaries per 100,000 population
Crime - Thefts per 100,000 population
Crime - Auto thefts per 100,000 population
Crime - Arson per 100,000 population
Crime - City-data.com crime index
Crime - Violent crime index
Crime - Property crime index
Crime - Murders per 100,000 population (5 year average)
Crime - Rapes per 100,000 population (5 year average)
Crime - Robberies per 100,000 population (5 year average)
Crime - Assaults per 100,000 population (5 year average)
Crime - Burglaries per 100,000 population (5 year average)
Crime - Thefts per 100,000 population (5 year average)
Crime - Auto thefts per 100,000 population (5 year average)
Crime - Arson per 100,000 population (5 year average)
Crime - City-data.com crime index (5 year average)
Crime - Violent crime index (5 year average)
Crime - Property crime index (5 year average)
1996 Presidential Elections Results (%) - Democratic Party (Clinton)
1996 Presidential Elections Results (%) - Republican Party (Dole)
1996 Presidential Elections Results (%) - Other
2000 Presidential Elections Results (%) - Democratic Party (Gore)
2000 Presidential Elections Results (%) - Republican Party (Bush)
2000 Presidential Elections Results (%) - Other
2004 Presidential Elections Results (%) - Democratic Party (Kerry)
2004 Presidential Elections Results (%) - Republican Party (Bush)
2004 Presidential Elections Results (%) - Other
2008 Presidential Elections Results (%) - Democratic Party (Obama)
2008 Presidential Elections Results (%) - Republican Party (McCain)
2008 Presidential Elections Results (%) - Other
2012 Presidential Elections Results (%) - Democratic Party (Obama)
2012 Presidential Elections Results (%) - Republican Party (Romney)
2012 Presidential Elections Results (%) - Other
2016 Presidential Elections Results (%) - Democratic Party (Clinton)
2016 Presidential Elections Results (%) - Republican Party (Trump)
2016 Presidential Elections Results (%) - Other
2020 Presidential Elections Results (%) - Democratic Party (Biden)
2020 Presidential Elections Results (%) - Republican Party (Trump)
2020 Presidential Elections Results (%) - Other
Ancestries Reported - Arab (%)
Ancestries Reported - Czech (%)
Ancestries Reported - Danish (%)
Ancestries Reported - Dutch (%)
Ancestries Reported - English (%)
Ancestries Reported - French (%)
Ancestries Reported - French Canadian (%)
Ancestries Reported - German (%)
Ancestries Reported - Greek (%)
Ancestries Reported - Hungarian (%)
Ancestries Reported - Irish (%)
Ancestries Reported - Italian (%)
Ancestries Reported - Lithuanian (%)
Ancestries Reported - Norwegian (%)
Ancestries Reported - Polish (%)
Ancestries Reported - Portuguese (%)
Ancestries Reported - Russian (%)
Ancestries Reported - Scotch-Irish (%)
Ancestries Reported - Scottish (%)
Ancestries Reported - Slovak (%)
Ancestries Reported - Subsaharan African (%)
Ancestries Reported - Swedish (%)
Ancestries Reported - Swiss (%)
Ancestries Reported - Ukrainian (%)
Ancestries Reported - United States (%)
Ancestries Reported - Welsh (%)
Ancestries Reported - West Indian (%)
Ancestries Reported - Other (%)
Educational Attainment - No schooling completed (%)
Educational Attainment - Less than high school (%)
Educational Attainment - High school or equivalent (%)
Educational Attainment - Less than 1 year of college (%)
Educational Attainment - 1 or more years of college (%)
Educational Attainment - Associate degree (%)
Educational Attainment - Bachelor's degree (%)
Educational Attainment - Master's degree (%)
Educational Attainment - Professional school degree (%)
Educational Attainment - Doctorate degree (%)
School Enrollment - Nursery, preschool (%)
School Enrollment - Kindergarten (%)
School Enrollment - Grade 1 to 4 (%)
School Enrollment - Grade 5 to 8 (%)
School Enrollment - Grade 9 to 12 (%)
School Enrollment - College undergrad (%)
School Enrollment - Graduate or professional (%)
School Enrollment - Not enrolled in school (%)
School enrollment - Public schools (%)
School enrollment - Private schools (%)
School enrollment - Not enrolled (%)
Median number of rooms in houses and condos
Median number of rooms in apartments
Housing units lacking complete plumbing facilities (%)
Housing units lacking complete kitchen facilities (%)
Density of houses
Urban houses (%)
Rural houses (%)
Households with people 60 years and over (%)
Households with people 65 years and over (%)
Households with people 75 years and over (%)
Households with one or more nonrelatives (%)
Households with no nonrelatives (%)
Population in households (%)
Family households (%)
Nonfamily households (%)
Population in families (%)
Family households with own children (%)
Median number of bedrooms in owner occupied houses
Mean number of bedrooms in owner occupied houses
Median number of bedrooms in renter occupied houses
Mean number of bedrooms in renter occupied houses
Median number of vehichles in owner occupied houses
Mean number of vehichles in owner occupied houses
Median number of vehichles in renter occupied houses
Mean number of vehichles in renter occupied houses
Mortgage status - with mortgage (%)
Mortgage status - with second mortgage (%)
Mortgage status - with home equity loan (%)
Mortgage status - with both second mortgage and home equity loan (%)
Mortgage status - without a mortgage (%)
Average family size
Average family size - White
Average family size - Black or African American
Average family size - Asian
Average family size - Hispanic or Latino
Average family size - American Indian and Alaska Native
Average family size - Multirace
Average family size - Other Race
Geographical mobility - Same house 1 year ago (%)
Geographical mobility - Moved within same county (%)
Geographical mobility - Moved from different county within same state (%)
Geographical mobility - Moved from different state (%)
Geographical mobility - Moved from abroad (%)
Place of birth - Born in state of residence (%)
Place of birth - Born in other state (%)
Place of birth - Native, outside of US (%)
Place of birth - Foreign born (%)
Housing units in structures - 1, detached (%)
Housing units in structures - 1, attached (%)
Housing units in structures - 2 (%)
Housing units in structures - 3 or 4 (%)
Housing units in structures - 5 to 9 (%)
Housing units in structures - 10 to 19 (%)
Housing units in structures - 20 to 49 (%)
Housing units in structures - 50 or more (%)
Housing units in structures - Mobile home (%)
Housing units in structures - Boat, RV, van, etc. (%)
House/condo owner moved in on average (years ago)
Renter moved in on average (years ago)
Year householder moved into unit - Moved in 1999 to March 2000 (%)
Year householder moved into unit - Moved in 1995 to 1998 (%)
Year householder moved into unit - Moved in 1990 to 1994 (%)
Year householder moved into unit - Moved in 1980 to 1989 (%)
Year householder moved into unit - Moved in 1970 to 1979 (%)
Year householder moved into unit - Moved in 1969 or earlier (%)
Means of transportation to work - Drove car alone (%)
Means of transportation to work - Carpooled (%)
Means of transportation to work - Public transportation (%)
Means of transportation to work - Bus or trolley bus (%)
Means of transportation to work - Streetcar or trolley car (%)
Means of transportation to work - Subway or elevated (%)
Means of transportation to work - Railroad (%)
Means of transportation to work - Ferryboat (%)
Means of transportation to work - Taxicab (%)
Means of transportation to work - Motorcycle (%)
Means of transportation to work - Bicycle (%)
Means of transportation to work - Walked (%)
Means of transportation to work - Other means (%)
Working at home (%)
Industry diversity
Most Common Industries - Agriculture, forestry, fishing and hunting, and mining (%)
Most Common Industries - Agriculture, forestry, fishing and hunting (%)
Most Common Industries - Mining, quarrying, and oil and gas extraction (%)
Most Common Industries - Construction (%)
Most Common Industries - Manufacturing (%)
Most Common Industries - Wholesale trade (%)
Most Common Industries - Retail trade (%)
Most Common Industries - Transportation and warehousing, and utilities (%)
Most Common Industries - Transportation and warehousing (%)
Most Common Industries - Utilities (%)
Most Common Industries - Information (%)
Most Common Industries - Finance and insurance, and real estate and rental and leasing (%)
Most Common Industries - Finance and insurance (%)
Most Common Industries - Real estate and rental and leasing (%)
Most Common Industries - Professional, scientific, and management, and administrative and waste management services (%)
Most Common Industries - Professional, scientific, and technical services (%)
Most Common Industries - Management of companies and enterprises (%)
Most Common Industries - Administrative and support and waste management services (%)
Most Common Industries - Educational services, and health care and social assistance (%)
Most Common Industries - Educational services (%)
Most Common Industries - Health care and social assistance (%)
Most Common Industries - Arts, entertainment, and recreation, and accommodation and food services (%)
Most Common Industries - Arts, entertainment, and recreation (%)
Most Common Industries - Accommodation and food services (%)
Most Common Industries - Other services, except public administration (%)
Most Common Industries - Public administration (%)
Occupation diversity
Most Common Occupations - Management, business, science, and arts occupations (%)
Most Common Occupations - Management, business, and financial occupations (%)
Most Common Occupations - Management occupations (%)
Most Common Occupations - Business and financial operations occupations (%)
Most Common Occupations - Computer, engineering, and science occupations (%)
Most Common Occupations - Computer and mathematical occupations (%)
Most Common Occupations - Architecture and engineering occupations (%)
Most Common Occupations - Life, physical, and social science occupations (%)
Most Common Occupations - Education, legal, community service, arts, and media occupations (%)
Most Common Occupations - Community and social service occupations (%)
Most Common Occupations - Legal occupations (%)
Most Common Occupations - Education, training, and library occupations (%)
Most Common Occupations - Arts, design, entertainment, sports, and media occupations (%)
Most Common Occupations - Healthcare practitioners and technical occupations (%)
Most Common Occupations - Health diagnosing and treating practitioners and other technical occupations (%)
Most Common Occupations - Health technologists and technicians (%)
Most Common Occupations - Service occupations (%)
Most Common Occupations - Healthcare support occupations (%)
Most Common Occupations - Protective service occupations (%)
Most Common Occupations - Fire fighting and prevention, and other protective service workers including supervisors (%)
Most Common Occupations - Law enforcement workers including supervisors (%)
Most Common Occupations - Food preparation and serving related occupations (%)
Most Common Occupations - Building and grounds cleaning and maintenance occupations (%)
Most Common Occupations - Personal care and service occupations (%)
Most Common Occupations - Sales and office occupations (%)
Most Common Occupations - Sales and related occupations (%)
Most Common Occupations - Office and administrative support occupations (%)
Most Common Occupations - Natural resources, construction, and maintenance occupations (%)
Most Common Occupations - Farming, fishing, and forestry occupations (%)
Most Common Occupations - Construction and extraction occupations (%)
Most Common Occupations - Installation, maintenance, and repair occupations (%)
Most Common Occupations - Production, transportation, and material moving occupations (%)
Most Common Occupations - Production occupations (%)
Most Common Occupations - Transportation occupations (%)
Most Common Occupations - Material moving occupations (%)
People in Group quarters - Institutionalized population (%)
People in Group quarters - Correctional institutions (%)
People in Group quarters - Federal prisons and detention centers (%)
People in Group quarters - Halfway houses (%)
People in Group quarters - Local jails and other confinement facilities (including police lockups) (%)
People in Group quarters - Military disciplinary barracks (%)
People in Group quarters - State prisons (%)
People in Group quarters - Other types of correctional institutions (%)
People in Group quarters - Nursing homes (%)
People in Group quarters - Hospitals/wards, hospices, and schools for the handicapped (%)
People in Group quarters - Hospitals/wards and hospices for chronically ill (%)
People in Group quarters - Hospices or homes for chronically ill (%)
People in Group quarters - Military hospitals or wards for chronically ill (%)
People in Group quarters - Other hospitals or wards for chronically ill (%)
People in Group quarters - Hospitals or wards for drug/alcohol abuse (%)
People in Group quarters - Mental (Psychiatric) hospitals or wards (%)
People in Group quarters - Schools, hospitals, or wards for the mentally retarded (%)
People in Group quarters - Schools, hospitals, or wards for the physically handicapped (%)
People in Group quarters - Institutions for the deaf (%)
People in Group quarters - Institutions for the blind (%)
People in Group quarters - Orthopedic wards and institutions for the physically handicapped (%)
People in Group quarters - Wards in general hospitals for patients who have no usual home elsewhere (%)
People in Group quarters - Wards in military hospitals for patients who have no usual home elsewhere (%)
People in Group quarters - Juvenile institutions (%)
People in Group quarters - Long-term care (%)
People in Group quarters - Homes for abused, dependent, and neglected children (%)
People in Group quarters - Residential treatment centers for emotionally disturbed children (%)
People in Group quarters - Training schools for juvenile delinquents (%)
People in Group quarters - Short-term care, detention or diagnostic centers for delinquent children (%)
People in Group quarters - Type of juvenile institution unknown (%)
People in Group quarters - Noninstitutionalized population (%)
People in Group quarters - College dormitories (includes college quarters off campus) (%)
People in Group quarters - Military quarters (%)
People in Group quarters - On base (%)
People in Group quarters - Barracks, unaccompanied personnel housing (UPH), (Enlisted/Officer), ;and similar group living quarters for military personnel (%)
People in Group quarters - Transient quarters for temporary residents (%)
People in Group quarters - Military ships (%)
People in Group quarters - Group homes (%)
People in Group quarters - Homes or halfway houses for drug/alcohol abuse (%)
People in Group quarters - Homes for the mentally ill (%)
People in Group quarters - Homes for the mentally retarded (%)
People in Group quarters - Homes for the physically handicapped (%)
People in Group quarters - Other group homes (%)
People in Group quarters - Religious group quarters (%)
People in Group quarters - Dormitories (%)
People in Group quarters - Agriculture workers' dormitories on farms (%)
People in Group quarters - Job Corps and vocational training facilities (%)
People in Group quarters - Other workers' dormitories (%)
People in Group quarters - Crews of maritime vessels (%)
People in Group quarters - Other nonhousehold living situations (%)
People in Group quarters - Other noninstitutional group quarters (%)
Residents speaking English at home (%)
Residents speaking English at home - Born in the United States (%)
Residents speaking English at home - Native, born elsewhere (%)
Residents speaking English at home - Foreign born (%)
Residents speaking Spanish at home (%)
Residents speaking Spanish at home - Born in the United States (%)
Residents speaking Spanish at home - Native, born elsewhere (%)
Residents speaking Spanish at home - Foreign born (%)
Residents speaking other language at home (%)
Residents speaking other language at home - Born in the United States (%)
Residents speaking other language at home - Native, born elsewhere (%)
Residents speaking other language at home - Foreign born (%)
Class of Workers - Employee of private company (%)
Class of Workers - Self-employed in own incorporated business (%)
Class of Workers - Private not-for-profit wage and salary workers (%)
Class of Workers - Local government workers (%)
Class of Workers - State government workers (%)
Class of Workers - Federal government workers (%)
Class of Workers - Self-employed workers in own not incorporated business and Unpaid family workers (%)
House heating fuel used in houses and condos - Utility gas (%)
House heating fuel used in houses and condos - Bottled, tank, or LP gas (%)
House heating fuel used in houses and condos - Electricity (%)
House heating fuel used in houses and condos - Fuel oil, kerosene, etc. (%)
House heating fuel used in houses and condos - Coal or coke (%)
House heating fuel used in houses and condos - Wood (%)
House heating fuel used in houses and condos - Solar energy (%)
House heating fuel used in houses and condos - Other fuel (%)
House heating fuel used in houses and condos - No fuel used (%)
House heating fuel used in apartments - Utility gas (%)
House heating fuel used in apartments - Bottled, tank, or LP gas (%)
House heating fuel used in apartments - Electricity (%)
House heating fuel used in apartments - Fuel oil, kerosene, etc. (%)
House heating fuel used in apartments - Coal or coke (%)
House heating fuel used in apartments - Wood (%)
House heating fuel used in apartments - Solar energy (%)
House heating fuel used in apartments - Other fuel (%)
House heating fuel used in apartments - No fuel used (%)
Armed forces status - In Armed Forces (%)
Armed forces status - Civilian (%)
Armed forces status - Civilian - Veteran (%)
Armed forces status - Civilian - Nonveteran (%)
Fatal accidents locations in years 2005-2021
Fatal accidents locations in 2005
Fatal accidents locations in 2006
Fatal accidents locations in 2007
Fatal accidents locations in 2008
Fatal accidents locations in 2009
Fatal accidents locations in 2010
Fatal accidents locations in 2011
Fatal accidents locations in 2012
Fatal accidents locations in 2013
Fatal accidents locations in 2014
Fatal accidents locations in 2015
Fatal accidents locations in 2016
Fatal accidents locations in 2017
Fatal accidents locations in 2018
Fatal accidents locations in 2019
Fatal accidents locations in 2020
Fatal accidents locations in 2021
Alcohol use - People drinking some alcohol every month (%)
Alcohol use - People not drinking at all (%)
Alcohol use - Average days/month drinking alcohol
Alcohol use - Average drinks/week
Alcohol use - Average days/year people drink much
Audiometry - Average condition of hearing (%)
Audiometry - People that can hear a whisper from across a quiet room (%)
Audiometry - People that can hear normal voice from across a quiet room (%)
Audiometry - Ears ringing, roaring, buzzing (%)
Audiometry - Had a job exposure to loud noise (%)
Audiometry - Had off-work exposure to loud noise (%)
Blood Pressure & Cholesterol - Has high blood pressure (%)
Blood Pressure & Cholesterol - Checking blood pressure at home (%)
Blood Pressure & Cholesterol - Frequently checking blood cholesterol (%)
Blood Pressure & Cholesterol - Has high cholesterol level (%)
Consumer Behavior - Money monthly spent on food at supermarket/grocery store
Consumer Behavior - Money monthly spent on food at other stores
Consumer Behavior - Money monthly spent on eating out
Consumer Behavior - Money monthly spent on carryout/delivered foods
Consumer Behavior - Income spent on food at supermarket/grocery store (%)
Consumer Behavior - Income spent on food at other stores (%)
Consumer Behavior - Income spent on eating out (%)
Consumer Behavior - Income spent on carryout/delivered foods (%)
Current Health Status - General health condition (%)
Current Health Status - Blood donors (%)
Current Health Status - Has blood ever tested for HIV virus (%)
Current Health Status - Left-handed people (%)
Dermatology - People using sunscreen (%)
Diabetes - Diabetics (%)
Diabetes - Had a blood test for high blood sugar (%)
Diabetes - People taking insulin (%)
Diet Behavior & Nutrition - Diet health (%)
Diet Behavior & Nutrition - Milk product consumption (# of products/month)
Diet Behavior & Nutrition - Meals not home prepared (#/week)
Diet Behavior & Nutrition - Meals from fast food or pizza place (#/week)
Diet Behavior & Nutrition - Ready-to-eat foods (#/month)
Diet Behavior & Nutrition - Frozen meals/pizza (#/month)
Drug Use - People that ever used marijuana or hashish (%)
Drug Use - Ever used hard drugs (%)
Drug Use - Ever used any form of cocaine (%)
Drug Use - Ever used heroin (%)
Drug Use - Ever used methamphetamine (%)
Health Insurance - People covered by health insurance (%)
Kidney Conditions-Urology - Avg. # of times urinating at night
Medical Conditions - People with asthma (%)
Medical Conditions - People with anemia (%)
Medical Conditions - People with psoriasis (%)
Medical Conditions - People with overweight (%)
Medical Conditions - Elderly people having difficulties in thinking or remembering (%)
Medical Conditions - People who ever received blood transfusion (%)
Medical Conditions - People having trouble seeing even with glass/contacts (%)
Medical Conditions - People with arthritis (%)
Medical Conditions - People with gout (%)
Medical Conditions - People with congestive heart failure (%)
Medical Conditions - People with coronary heart disease (%)
Medical Conditions - People with angina pectoris (%)
Medical Conditions - People who ever had heart attack (%)
Medical Conditions - People who ever had stroke (%)
Medical Conditions - People with emphysema (%)
Medical Conditions - People with thyroid problem (%)
Medical Conditions - People with chronic bronchitis (%)
Medical Conditions - People with any liver condition (%)
Medical Conditions - People who ever had cancer or malignancy (%)
Mental Health - People who have little interest in doing things (%)
Mental Health - People feeling down, depressed, or hopeless (%)
Mental Health - People who have trouble sleeping or sleeping too much (%)
Mental Health - People feeling tired or having little energy (%)
Mental Health - People with poor appetite or overeating (%)
Mental Health - People feeling bad about themself (%)
Mental Health - People who have trouble concentrating on things (%)
Mental Health - People moving or speaking slowly or too fast (%)
Mental Health - People having thoughts they would be better off dead (%)
Oral Health - Average years since last visit a dentist
Oral Health - People embarrassed because of mouth (%)
Oral Health - People with gum disease (%)
Oral Health - General health of teeth and gums (%)
Oral Health - Average days a week using dental floss/device
Oral Health - Average days a week using mouthwash for dental problem
Oral Health - Average number of teeth
Pesticide Use - Households using pesticides to control insects (%)
Pesticide Use - Households using pesticides to kill weeds (%)
Physical Activity - People doing vigorous-intensity work activities (%)
Physical Activity - People doing moderate-intensity work activities (%)
Physical Activity - People walking or bicycling (%)
Physical Activity - People doing vigorous-intensity recreational activities (%)
Physical Activity - People doing moderate-intensity recreational activities (%)
Physical Activity - Average hours a day doing sedentary activities
Physical Activity - Average hours a day watching TV or videos
Physical Activity - Average hours a day using computer
Physical Functioning - People having limitations keeping them from working (%)
Physical Functioning - People limited in amount of work they can do (%)
Physical Functioning - People that need special equipment to walk (%)
Physical Functioning - People experiencing confusion/memory problems (%)
Physical Functioning - People requiring special healthcare equipment (%)
Prescription Medications - Average number of prescription medicines taking
Preventive Aspirin Use - Adults 40+ taking low-dose aspirin (%)
Reproductive Health - Vaginal deliveries (%)
Reproductive Health - Cesarean deliveries (%)
Reproductive Health - Deliveries resulted in a live birth (%)
Reproductive Health - Pregnancies resulted in a delivery (%)
Reproductive Health - Women breastfeeding newborns (%)
Reproductive Health - Women that had a hysterectomy (%)
Reproductive Health - Women that had both ovaries removed (%)
Reproductive Health - Women that have ever taken birth control pills (%)
Reproductive Health - Women taking birth control pills (%)
Reproductive Health - Women that have ever used Depo-Provera or injectables (%)
Reproductive Health - Women that have ever used female hormones (%)
Sexual Behavior - People 18+ that ever had sex (vaginal, anal, or oral) (%)
Sexual Behavior - Males 18+ that ever had vaginal sex with a woman (%)
Sexual Behavior - Males 18+ that ever performed oral sex on a woman (%)
Sexual Behavior - Males 18+ that ever had anal sex with a woman (%)
Sexual Behavior - Males 18+ that ever had any sex with a man (%)
Sexual Behavior - Females 18+ that ever had vaginal sex with a man (%)
Sexual Behavior - Females 18+ that ever performed oral sex on a man (%)
Sexual Behavior - Females 18+ that ever had anal sex with a man (%)
Sexual Behavior - Females 18+ that ever had any kind of sex with a woman (%)
Sexual Behavior - Average age people first had sex
Sexual Behavior - Average number of female sex partners in lifetime (males 18+)
Sexual Behavior - Average number of female vaginal sex partners in lifetime (males 18+)
Sexual Behavior - Average age people first performed oral sex on a woman (18+)
Sexual Behavior - Average number of woman performed oral sex on in lifetime (18+)
Sexual Behavior - Average number of male sex partners in lifetime (males 18+)
Sexual Behavior - Average number of male anal sex partners in lifetime (males 18+)
Sexual Behavior - Average age people first performed oral sex on a man (18+)
Sexual Behavior - Average number of male oral sex partners in lifetime (18+)
Sexual Behavior - People using protection when performing oral sex (%)
Sexual Behavior - Average number of times people have vaginal or anal sex a year
Sexual Behavior - People having sex without condom (%)
Sexual Behavior - Average number of male sex partners in lifetime (females 18+)
Sexual Behavior - Average number of male vaginal sex partners in lifetime (females 18+)
Sexual Behavior - Average number of female sex partners in lifetime (females 18+)
Sexual Behavior - Circumcised males 18+ (%)
Sleep Disorders - Average hours sleeping at night
Sleep Disorders - People that has trouble sleeping (%)
Smoking-Cigarette Use - People smoking cigarettes (%)
Taste & Smell - People 40+ having problems with smell (%)
Taste & Smell - People 40+ having problems with taste (%)
Taste & Smell - People 40+ that ever had wisdom teeth removed (%)
Taste & Smell - People 40+ that ever had tonsils teeth removed (%)
Taste & Smell - People 40+ that ever had a loss of consciousness because of a head injury (%)
Taste & Smell - People 40+ that ever had a broken nose or other serious injury to face or skull (%)
Taste & Smell - People 40+ that ever had two or more sinus infections (%)
Weight - Average height (inches)
Weight - Average weight (pounds)
Weight - Average BMI
Weight - People that are obese (%)
Weight - People that ever were obese (%)
Weight - People trying to lose weight (%)
Urban population: 20,797
Rural population: 3,938
Estimated median house/condo value in 2022: $250,290
75146:
$250,290Texas:
$275,400
Median resident age: This zip code:
33.8 yearsTexas median age:
35.6 years
Average household size: This zip code:
2.7 peopleTexas:
2.6 people
Averages for the 2020 tax year for zip code 75146, filed in 2021:
Average Adjusted Gross Income (AGI) in 2020: $44,349 (Individual Income Tax Returns) Here:
$44,349State:
$77,054
Salary/wage: $42,151 (reported on 88.2% of returns )Here:
$42,151State:
$62,766
(% of AGI for various income ranges: 1447.6% for AGIs below $25k , 3921.9% for AGIs $25k-50k , 7136.8% for AGIs $50k-75k , 10038.8% for AGIs $75k-100k , 16889.8% for AGIs $100k-200k , 62220.0% for AGIs over 200k ) Taxable interest for individuals: $758 (reported on 10.0% of returns )This zip code:
$758Texas:
$2,665
(% of AGI for various income ranges: 2.6% for AGIs below $25k , 5.5% for AGIs $25k-50k , 11.5% for AGIs $50k-75k , 18.8% for AGIs $75k-100k , 26.2% for AGIs $100k-200k , 1030.0% for AGIs over 200k ) Ordinary dividends: $3,253 (reported on 4.5% of returns )(% of AGI for various income ranges: 2.1% for AGIs below $25k , 4.0% for AGIs $25k-50k , 12.2% for AGIs $50k-75k , 52.0% for AGIs $75k-100k , 76.0% for AGIs $100k-200k , 3205.0% for AGIs over 200k ) Net capital gain/loss in AGI: +$6,210 (reported on 4.3% of returns )Here:
+$6,210State:
+$39,590
(% of AGI for various income ranges: 0.5% for AGIs below $25k , 5.5% for AGIs $25k-50k , 18.6% for AGIs $50k-75k , 72.2% for AGIs $75k-100k , 160.9% for AGIs $100k-200k , 7195.0% for AGIs over 200k ) Taxable individual retirement arrangement distribution: $15,022 (reported on 3.5% of returns )75146:
$15,022Texas:
$24,740
(% of AGI for various income ranges: 19.5% for AGIs below $25k , 20.9% for AGIs $25k-50k , 71.2% for AGIs $50k-75k , 179.2% for AGIs $75k-100k , 582.9% for AGIs $100k-200k ) Total itemized deductions: $27,391 (reported on 9.9% of returns )Here:
$27,391State:
$40,428
(% of AGI for various income ranges: 38.2% for AGIs below $25k , 218.9% for AGIs $25k-50k , 637.9% for AGIs $50k-75k , 876.9% for AGIs $75k-100k , 1580.9% for AGIs $100k-200k , 6175.0% for AGIs over 200k ) Charity contributions: $10,573 (reported on 8.5% of returns )Here:
$10,573State:
$18,201
(% of AGI for various income ranges: 6.0% for AGIs below $25k , 59.0% for AGIs $25k-50k , 192.3% for AGIs $50k-75k , 332.0% for AGIs $75k-100k , 612.9% for AGIs $100k-200k , 3330.0% for AGIs over 200k ) Taxes paid: $6,028 (reported on 9.5% of returns )(% of AGI for various income ranges: 7.9% for AGIs below $25k , 44.0% for AGIs $25k-50k , 147.0% for AGIs $50k-75k , 189.3% for AGIs $75k-100k , 311.3% for AGIs $100k-200k , 1050.0% for AGIs over 200k ) Earned income credit: $2,547 (reported on 27.9% of returns )(% of AGI for various income ranges: 144.1% for AGIs below $25k , 98.9% for AGIs $25k-50k , 0.9% for AGIs $50k-75k ) Percentage of individuals using paid preparers for their 2020 taxes: 91.4%(% for various income ranges: 91.5% for AGIs below $25k , 91.8% for AGIs $25k-50k , 90.3% for AGIs $50k-75k , 90.4% for AGIs $75k-100k , 93.2% for AGIs $100k-200k , 87.5% for AGIs over 200k )
Averages for the 2012 tax year for zip code 75146, filed in 2013:
Average Adjusted Gross Income (AGI) in 2012: $39,705 (Individual Income Tax Returns) Here:
$39,705State:
$65,384
Salary/wage: $37,748 (reported on 90.0% of returns )Here:
$37,748State:
$52,524
(% of AGI for various income ranges: 89.3% for AGIs below $25k , 93.2% for AGIs $25k-50k , 87.3% for AGIs $50k-75k , 83.0% for AGIs $75k-100k , 77.6% for AGIs $100k-200k , 60.4% for AGIs over 200k ) Taxable interest for individuals: $1,191 (reported on 12.6% of returns )This zip code:
$1,191Texas:
$2,372
(% of AGI for various income ranges: 0.2% for AGIs below $25k , 0.2% for AGIs $25k-50k , 0.3% for AGIs $50k-75k , 0.4% for AGIs $75k-100k , 0.6% for AGIs $100k-200k , 1.1% for AGIs over 200k ) Ordinary dividends: $4,187 (reported on 6.1% of returns )(% of AGI for various income ranges: 0.5% for AGIs below $25k , 0.4% for AGIs $25k-50k , 0.3% for AGIs $50k-75k , 0.5% for AGIs $75k-100k , 1.4% for AGIs $100k-200k , 2.0% for AGIs over 200k ) Net capital gain/loss in AGI: +$4,318 (reported on 4.3% of returns )Here:
+$4,318State:
+$35,319
(% of AGI for various income ranges: 0.4% for AGIs $75k-100k , 0.9% for AGIs $100k-200k , 4.5% for AGIs over 200k ) Profit/loss from business: +$476 (reported on 21.5% of returns )(% of AGI for various income ranges: 1.0% for AGIs below $25k , 0.3% for AGIs $50k-75k , 1.6% for AGIs $75k-100k , 1.3% for AGIs $100k-200k ) Taxable individual retirement arrangement distribution: $15,018 (reported on 5.4% of returns )75146:
$15,018Texas:
$19,511
(% of AGI for various income ranges: 1.3% for AGIs below $25k , 1.3% for AGIs $25k-50k , 1.8% for AGIs $50k-75k , 3.1% for AGIs $75k-100k , 4.2% for AGIs $100k-200k ) Total itemized deductions: $18,517 (29% of AGI, reported on 28.8% of returns )Here:
$18,517State:
$24,724
Here:
28.7% of AGIState:
15.9% of AGI
(% of AGI for various income ranges: 8.5% for AGIs below $25k , 13.8% for AGIs $25k-50k , 16.8% for AGIs $50k-75k , 15.3% for AGIs $75k-100k , 13.6% for AGIs $100k-200k , 5.3% for AGIs over 200k ) Charity contributions: $5,555 (reported on 24.3% of returns )(% of AGI for various income ranges: 1.3% for AGIs below $25k , 3.1% for AGIs $25k-50k , 4.1% for AGIs $50k-75k , 4.3% for AGIs $75k-100k , 4.5% for AGIs $100k-200k , 1.9% for AGIs over 200k ) Taxes paid: $3,841 (reported on 27.9% of returns )(% of AGI for various income ranges: 1.4% for AGIs below $25k , 2.7% for AGIs $25k-50k , 3.4% for AGIs $50k-75k , 3.1% for AGIs $75k-100k , 2.9% for AGIs $100k-200k , 1.5% for AGIs over 200k ) Earned income credit: $2,580 (reported on 32.9% of returns )(% of AGI for various income ranges: 11.7% for AGIs below $25k , 1.7% for AGIs $25k-50k ) Percentage of individuals using paid preparers for their 2012 taxes: 53.8%(% for various income ranges: 55.2% for AGIs below $25k , 52.7% for AGIs $25k-50k , 51.5% for AGIs $50k-75k , 50.9% for AGIs $75k-100k , 56.5% for AGIs $100k-200k , 75.0% for AGIs over 200k )
Averages for the 2004 tax year for zip code 75146, filed in 2005:
Average Adjusted Gross Income (AGI) in 2004: $38,171 (Individual Income Tax Returns) Here:
$38,171State:
$47,881
Salary/wage: $36,522 (reported on 90.0% of returns )Here:
$36,522State:
$41,947
(% of AGI for various income ranges: 108.7% for AGIs below $10k , 90.5% for AGIs $10k-25k , 92.7% for AGIs $25k-50k , 88.9% for AGIs $50k-75k , 86.0% for AGIs $75k-100k , 68.3% for AGIs over 100k ) Taxable interest for individuals: $1,285 (reported on 22.1% of returns )This zip code:
$1,285Texas:
$2,255
(% of AGI for various income ranges: 2.4% for AGIs below $10k , 0.9% for AGIs $10k-25k , 0.5% for AGIs $25k-50k , 0.6% for AGIs $50k-75k , 0.8% for AGIs $75k-100k , 1.0% for AGIs over 100k ) Taxable dividends: $1,909 (reported on 9.8% of returns )(% of AGI for various income ranges: 1.7% for AGIs below $10k , 0.4% for AGIs $10k-25k , 0.2% for AGIs $25k-50k , 0.2% for AGIs $50k-75k , 0.5% for AGIs $75k-100k , 1.1% for AGIs over 100k ) Net capital gain/loss: +$9,645 (reported on 7.5% of returns )Here:
+$9,645State:
+$16,110
(% of AGI for various income ranges: -0.8% for AGIs below $10k , -0.1% for AGIs $10k-25k , 0.3% for AGIs $25k-50k , 0.2% for AGIs $50k-75k , 0.8% for AGIs $75k-100k , 8.4% for AGIs over 100k ) Profit/loss from business: +$2,223 (reported on 14.7% of returns )Here:
+$2,223State:
+$11,013
(% of AGI for various income ranges: 9.1% for AGIs below $10k , -3.7% for AGIs $10k-25k , -1.6% for AGIs $25k-50k , 1.4% for AGIs $50k-75k , 1.4% for AGIs $75k-100k , 5.8% for AGIs over 100k ) IRA payment deduction: $2,284 (reported on 1.3% of returns )(% of AGI for various income ranges: 0.1% for AGIs $10k-25k , 0.1% for AGIs $25k-50k , 0.1% for AGIs $50k-75k , 0.1% for AGIs over 100k ) Self-employed pension: $20,333 (reported on 0.2% of returns )Here:
$20,333Texas:
$16,401
Total itemized deductions: $16,878 (28% of AGI, reported on 34.3% of returns )Here:
$16,878State:
$19,631
Here:
27.8% of AGIState:
18.9% of AGI
(% of AGI for various income ranges: 18.4% for AGIs below $10k , 10.5% for AGIs $10k-25k , 17.1% for AGIs $25k-50k , 18.1% for AGIs $50k-75k , 15.7% for AGIs $75k-100k , 11.2% for AGIs over 100k ) Charity contributions deductions: $4,586 (7% of AGI, reported on 29.7% of returns )Here:
7.2% of AGIState:
4.2% of AGI
(% of AGI for various income ranges: 1.4% for AGIs below $10k , 1.7% for AGIs $10k-25k , 3.4% for AGIs $25k-50k , 4.3% for AGIs $50k-75k , 4.1% for AGIs $75k-100k , 4.0% for AGIs over 100k ) Total tax: $5,162 (reported on 67.0% of returns )(% of AGI for various income ranges: 3.1% for AGIs below $10k , 3.0% for AGIs $10k-25k , 5.5% for AGIs $25k-50k , 8.6% for AGIs $50k-75k , 10.5% for AGIs $75k-100k , 18.2% for AGIs over 100k ) Earned income credit: $1,877 (reported on 26.4% of returns )Percentage of individuals using paid preparers for their 2004 taxes: 57.3%(% for various income ranges: 48.7% for AGIs below $10k , 66.0% for AGIs $10k-25k , 57.2% for AGIs $25k-50k , 55.6% for AGIs $50k-75k , 49.6% for AGIs $75k-100k , 55.7% for AGIs over 100k )
Estimated median household income in 2022: This zip code:
$67,302Texas:
$72,284
Nearest zip codes: 75134 ,
75154 ,
75172 ,
75141 ,
75241 ,
75115 .
Wilmer Zip Code Map
Percentage of family households: This zip code:
59.4%Texas:
50.5%
Percentage of households with unmarried partners: This zip code:
2.9%Texas:
48.7%
Likely homosexual households (counted as self-reported same-sex unmarried-partner households)
Lesbian couples: 0.3% of all households Gay men: 0.0% of all households
Household received Food Stamps/SNAP in the past 12 months: 1,168Household did not receive Food Stamps/SNAP in the past 12 months: 7,811
Women who had a birth in the past 12 months: 760 (604 now married , 160 unmarried) Women who did not have a birth in the past 12 months: 6,070 (2,057 now married , 4,031 unmarried)
Housing units in zip code 75146 with a mortgage: 3,591 (217
second mortgage , 115
both second mortgage and home equity loan )
Houses without a mortgage: 27
Median monthly owner costs for units with a mortgage: $1,824
Median monthly owner costs for units without a mortgage: $688
Residents with income below the poverty level in 2022:
This zip code:
19.3%Whole state:
14.0%
Residents with income below 50% of the poverty level in 2022:
This zip code:
8.7%Whole state:
7.4%
Median number of rooms in houses and condos: Median number of rooms in apartments: Notable locations in this zip code not listed on our city pages
Click to draw/clear zip code borders Notable locations in zip code 75146: (A) , Lancaster Fire Department Station 3 (B) , Captain R A Rawlins House (C) , Randlett House (D) , W A Strain House (E) . Display/hide their locations on the map
Churches in zip code 75146 include: (A) , First Pentecostal Church (B) , First Presbyterian Church of Lancaster (C) , Miracle Temple Fellowship Church (D) , Saint Paul Free Will Baptist Church (E) , Dallas Avenue Church of Christ (F) , Church of Christ Cold Springs (G) , Miracle Valley Church of God in Christ (H) , Temple of Truth Church of God in Christ (I) . Display/hide their locations on the map
Cemeteries: (1) , Rawlins Cemetery (2) . Display/hide their locations on the map
Reservoir: (A) . Display/hide its location on the map
Streams, rivers, and creeks: (A) , Halls Branch (B) , Keller Branch (C) , Deep Branch (D) . Display/hide their locations on the map
Parks in zip code 75146 include: (1) , Tiger Field (2) . Display/hide their locations on the map
Year house built (houses)
99 2020 or later1,026 2010 to 20192,016 2000 to 20091,631 1990 to 19991,968 1980 to 1989944 1970 to 1979650 1960 to 1969388 1950 to 1959288 1940 to 194984 1939 or earlier
Zip code 75146 household income distribution in 2022 658 Less than $10,000397 $10,000 to $14,999245 $15,000 to $19,999285 $20,000 to $24,999269 $25,000 to $29,999409 $30,000 to $34,999436 $35,000 to $39,999218 $40,000 to $44,999565 $45,000 to $49,999689 $50,000 to $59,999878 $60,000 to $74,9991,286 $75,000 to $99,9991,270 $100,000 to $124,999406 $125,000 to $149,999669 $150,000 to $199,999300 $200,000 or moreEstimate of home value of owner-occupied houses/condos in 2022 in zip code 75146 182 Less than $10,00083 $10,000 to $14,999118 $15,000 to $19,99960 $20,000 to $24,99915 $35,000 to $39,99932 $50,000 to $59,99930 $60,000 to $69,99917 $70,000 to $79,99915 $80,000 to $89,99971 $90,000 to $99,999129 $100,000 to $124,999151 $125,000 to $149,999412 $150,000 to $174,999478 $175,000 to $199,9991,405 $200,000 to $249,999783 $250,000 to $299,999702 $300,000 to $399,999121 $400,000 to $499,99969 $500,000 to $749,99924 $1,500,000 to $1,999,999Rent paid by renters in 2022 in zip code 75146 11 $150 to $19971 $400 to $44972 $500 to $54911 $550 to $59963 $600 to $649114 $700 to $74965 $750 to $799352 $800 to $899144 $900 to $999796 $1,000 to $1,249511 $1,250 to $1,4991,252 $1,500 to $1,999115 $2,000 to $2,49937 $2,500 to $2,999213 No cash rent
Median gross rent in 2022: $1,549.
Median price asked for vacant for-sale houses and condos in 2022: $358,815.
Estimated median house (or condo) value in 2022 for: White Non-Hispanic householders: $238,029Black or African American householders: $262,849American Indian or Alaska Native householders: $934,475Some other race householders: $222,180Two or more races householders: $295,742Hispanic or Latino householders: $236,235Estimated median house or condo value in 2022: $250,290
75146:
$250,290Texas:
$275,400
Lower value quartile - upper value quartile: $191,815 - $301,749
Mean price in 2022: Detached houses: $210,951Here:
$210,951State:
$369,058
Townhouses or other attached units: $51,607Here:
$51,607State:
$327,631
Mobile homes: $74,548Here:
$74,548State:
$124,413
Housing units in structures:
One, detached: 6,701One, attached: 228Two: 413 or 4: 4515 to 9: 32610 to 19: 48720 to 49: 28450 or more: 581Mobile homes: 393Unemployment : 7.6%
Means of transportation to work in zip code 75146 76.0% 8,314 Drove a car alone10.4% 1,135 Carpooled0.3% 37 Bus or trolley bus0.1% 6 Motorcycle0.4% 42 Bicycle0.5% 51 Walked2.4% 267 Other means8.3% 908 Worked at homeTravel time to work (commute) in zip code 75146 72 Less than 5 minutes285 5 to 9 minutes1,051 10 to 14 minutes1,362 15 to 19 minutes797 20 to 24 minutes756 25 to 29 minutes2,627 30 to 34 minutes308 35 to 39 minutes645 40 to 44 minutes1,294 45 to 59 minutes495 60 to 89 minutes144 90 or more minutes
Percentage of zip code residents living and working in this county: 84.1%
Household type by relationship:
Households: 24,736
Male householders: 3,406 (547 living alone ), Female householders: 5,588 (1,730 living alone )3,626 spouses (3,599 opposite-sex spouses ), 444 unmarried partners , (429 opposite-sex unmarried partners ), 9,073 children (8,744 natural , 15 adopted , 310 stepchildren ), 794 grandchildren , 187 brothers or sisters , 197 parents , 43 foster children , 381 other relatives , 523 non-relatives In group quarters: 446 (-1 institutionalized population )
Size of family households: 2,614 2-persons , 1,584 3-persons , 1,021 4-persons , 749 5-persons , 207 6-persons , 136 7-or-more-persons
Size of nonfamily households: 2,274 1-person , 237 2-persons , 85 3-persons , 43 5-persons
3,356 married couples with children. single-parent households (174 men , 3,013 women ).
84.0% of residents of 75146 zip code speak English at home. of residents speak Spanish at home (70% very well, 16% well, 11% not well, 3% not at all ).of residents speak other Indo-European language at home (42% very well, 10% well, 48% not well ).
Foreign born population: 1,148 (4.6%)
(48.1%
of them are naturalized citizens )
This zip code:
4.6%Whole state:
17.2%
75% Honduras 10% Bhutan 4% Liberia 4% Costa Rica 1% Nepal 1% Ghana 1% Guatemala 5% American 2% English 2% German 1% Irish 1% African 0% European 0% West Indian
Year of entry for the foreign-born population
311 2010 or later 380 2000 to 2009 325 1990 to 1999 331 Before 1990
Facilities with environmental interests located in this zip code:
AIR SALVAGE OF DALLAS, INC. (1361 FERRIS RD. in LANCASTER, TX)
(Integrated Compliance Information System) - ICIS-06-2005-2250, FORMAL ENFORCEMENT ACTION, ENFORCEMENT/COMPLIANCE ACTIVITY National Pollutant Discharge Elimination System NON-MAJOR (Tracking pollutant discharge elimination systems) - permit Alternative names: AIR SALVAGE OF DALLAS INC(TXU010519)
AMREP INC (945 E. PLEASANT RUN RD. in LANCASTER, TX)
COMPLIANCE ACTIVITY (Tracking inspections of insecticide, fungicide, and rodenticide, and toxic substances) CRITERIA AND HAZARDOUS AIR POLLUTANT INVENTORY (Inventory of air pollution sources) HAZARDOUS WASTE BIENNIAL REPORTER (Resource Conservation and Recovery Act (tracking hazardous waste)) Large Quantity Generators, more that 1000 kg of hazardous waste/month (Resource Conservation and Recovery Act (tracking hazardous waste)) - notification TRI REPORTER (Tracking of toxic chemicals releasing facilities) Business SIC classification: SOAP AND OTHER DETERGENTS, EXCEPT SPECIALTY CLEANERS; SPECIALTY CLEANING, POLISHING, AND SANITATION PREPARATIONS; PESTICIDES AND AGRICULTURAL CHEMICALS; LUBRICATING OILS AND GREASESBusiness NAICS classification: SOAP AND OTHER DETERGENT MANUFACTURING.; SOAP AND OTHER DETERGENT MANUFACTURING.
A+ ACADEMY (630 W PLEASANT RUN RD in LANCASTER, TX)
(National Center for Education Statistics) - STATE ID-057829001
BACCUS CLEANERS (1017 WEST PLEASANT RUN ROAD in LANCASTER, TX)
AIR MINOR (AIRS/AFS) Business SIC classification: DRYCLEANING PLANTS, EXCEPT RUG CLEANING
AMERICAN HOMESTAR OF LANCASTER INC (800 N BECKLEY STREET in LANCASTER, TX)
COMPLIANCE ACTIVITY (Tracking inspections of insecticide, fungicide, and rodenticide, and toxic substances) Business SIC classification: MOBILE HOMES
Housing units lacking complete plumbing facilities: 1.1%
Housing units lacking complete kitchen facilities: 1.7%
69.4% Electricity 28.2% Utility gas 0.7% Wood 0.6% Other fuel 0.5% No fuel used
Population in 1990: 11,762. Population change in the 1990s: +3,674 (+31.2%).
Place of birth for U.S.-born residents:
This state: 16,540Northeast: 597Midwest: 1,752South: 3,925West: 420
48% of the 75146 zip code residents lived in the same house 5 years ago.
Out of people who lived in different houses, 67% lived in this county.
Out of people who lived in different counties, 50% lived in Texas.
82% of the 75146 zip code residents lived in the same house 1 year ago.
Out of people who lived in different houses, 74% moved from this county.
Out of people who lived in different houses, 7% moved from different county within same state.
Out of people who lived in different houses, 8% moved from different state.
Out of people who lived in different houses, 7% moved from abroad.
Private vs. public school enrollment:
Students in private schools in grades 1 to 8 (elementary and middle school): 545
Students in private schools in grades 9 to 12 (high school):
Students in private undergraduate colleges: 299
Occupation by median earnings in the past 12 months ($)
132,868 Computer and mathematical occupations 102,422 Community and social service occupations 81,590 Health diagnosing and treating practitioners and other technical occupations 81,446 Law enforcement workers including supervisors 80,369 Management occupations 54,521 Education, training, and library occupations
Top industries in this zip code by the number of employees in 2005:
Health Care and Social Assistance: General Medical and Surgical Hospitals (250-499 employees: 1 establishment)Health Care and Social Assistance: Nursing Care Facilities (100-249: 1, 50-99: 1)Accommodation and Food Services: Limited-Service Restaurants (20-49: 5, 10-19: 3, 1-4: 5)Construction: Water and Sewer Line and Related Structures Construction (100-249: 1, 20-49: 1)Administrative and Support and Waste Management and Remediation Services: Temporary Help Services (100-249: 1)Health Care and Social Assistance: Offices of Physicians (except Mental Health Specialists) (50-99: 1, 10-19: 2, 5-9: 3, 1-4: 12)
People in group quarters in 2010:
149 people in nursing facilities/skilled-nursing facilities
People in group quarters in 2000:
247 people in nursing homes
100 people in schools, hospitals, or wards for the intellectually disabled
Fatal accident statistics in 2014:
Fatal accident count: 3Vehicles involved in fatal accidents: 3Fatal accidents caused by drunken drivers: 0Fatalities: 3Persons involved in fatal accidents: 5Pedestrians involved in fatal accidents: 1
Fatal accident statistics in 2012:
Fatal accident count: 2Vehicles involved in fatal accidents: 2Fatal accidents caused by drunken drivers: 1Fatalities: 2Persons involved in fatal accidents: 3Pedestrians involved in fatal accidents: 0
Home Mortgage Disclosure Act Aggregated Statistics For Year 2009(Based on 5 full and 2 partial tracts) A) FHA, FSA/RHS & VA B) Conventional C) Refinancings D) Home Improvement Loans F) Non-occupant Loans on G) Loans On Manufactured Number Average Value Number Average Value Number Average Value Number Average Value Number Average Value Number Average Value
LOANS ORIGINATED 232 $108,527 70 $79,734 172 $116,092 13 $17,002 39 $61,279 0 $0 APPLICATIONS APPROVED, NOT ACCEPTED 14 $98,874 12 $46,188 54 $96,375 5 $40,200 8 $54,282 4 $45,758 APPLICATIONS DENIED 71 $114,374 18 $98,543 164 $114,021 56 $24,241 20 $58,671 7 $120,006 APPLICATIONS WITHDRAWN 30 $110,715 16 $95,238 78 $116,622 13 $26,582 9 $64,446 2 $96,000 FILES CLOSED FOR INCOMPLETENESS 6 $108,500 1 $35,570 22 $125,370 1 $20,000 1 $35,570 0 $0
Aggregated Statistics For Year 2008(Based on 5 full and 2 partial tracts) A) FHA, FSA/RHS & VA B) Conventional C) Refinancings D) Home Improvement Loans F) Non-occupant Loans on G) Loans On Manufactured Number Average Value Number Average Value Number Average Value Number Average Value Number Average Value Number Average Value
LOANS ORIGINATED 272 $123,203 138 $83,521 174 $105,898 26 $28,498 87 $72,433 1 $62,090 APPLICATIONS APPROVED, NOT ACCEPTED 26 $119,588 20 $100,264 24 $113,295 6 $11,882 3 $55,247 5 $42,314 APPLICATIONS DENIED 102 $127,951 65 $101,391 278 $109,673 98 $21,389 43 $84,108 6 $30,083 APPLICATIONS WITHDRAWN 40 $121,016 26 $108,950 85 $128,863 11 $33,344 20 $107,158 0 $0 FILES CLOSED FOR INCOMPLETENESS 13 $121,523 15 $122,371 26 $126,791 2 $19,955 2 $89,795 1 $17,480
Aggregated Statistics For Year 2007(Based on 5 full and 2 partial tracts) A) FHA, FSA/RHS & VA B) Conventional C) Refinancings D) Home Improvement Loans E) Loans on Dwellings For 5+ Families F) Non-occupant Loans on G) Loans On Manufactured Number Average Value Number Average Value Number Average Value Number Average Value Number Average Value Number Average Value Number Average Value
LOANS ORIGINATED 249 $132,383 420 $93,840 259 $108,095 55 $31,737 1 $7,000 146 $81,718 3 $51,327 APPLICATIONS APPROVED, NOT ACCEPTED 24 $115,519 73 $97,705 83 $112,090 13 $22,625 0 $0 25 $81,321 6 $56,323 APPLICATIONS DENIED 72 $130,750 258 $106,248 550 $127,277 154 $28,821 0 $0 73 $88,075 12 $58,482 APPLICATIONS WITHDRAWN 26 $108,384 91 $103,845 162 $119,413 10 $24,980 0 $0 8 $135,219 1 $48,220 FILES CLOSED FOR INCOMPLETENESS 5 $111,888 26 $139,468 64 $129,695 3 $111,537 0 $0 6 $111,333 0 $0
Aggregated Statistics For Year 2006(Based on 5 full and 2 partial tracts) A) FHA, FSA/RHS & VA B) Conventional C) Refinancings D) Home Improvement Loans E) Loans on Dwellings For 5+ Families F) Non-occupant Loans on G) Loans On Manufactured Number Average Value Number Average Value Number Average Value Number Average Value Number Average Value Number Average Value Number Average Value
LOANS ORIGINATED 183 $128,846 1,136 $79,054 249 $100,866 59 $37,706 1 $14,720,000 243 $71,304 3 $73,817 APPLICATIONS APPROVED, NOT ACCEPTED 7 $81,567 217 $78,487 82 $105,153 17 $33,826 0 $0 54 $72,236 11 $32,603 APPLICATIONS DENIED 55 $131,985 515 $86,645 494 $104,166 152 $35,241 0 $0 120 $81,212 10 $48,775 APPLICATIONS WITHDRAWN 49 $135,986 185 $87,412 265 $108,284 10 $56,149 0 $0 36 $73,168 1 $110,000 FILES CLOSED FOR INCOMPLETENESS 6 $105,032 51 $91,259 99 $116,313 1 $81,380 0 $0 17 $85,829 0 $0
Aggregated Statistics For Year 2005(Based on 5 full and 2 partial tracts) A) FHA, FSA/RHS & VA B) Conventional C) Refinancings D) Home Improvement Loans E) Loans on Dwellings For 5+ Families F) Non-occupant Loans on G) Loans On Manufactured Number Average Value Number Average Value Number Average Value Number Average Value Number Average Value Number Average Value Number Average Value
LOANS ORIGINATED 93 $119,219 774 $79,943 447 $105,097 52 $84,178 2 $778,205 150 $80,327 1 $56,660 APPLICATIONS APPROVED, NOT ACCEPTED 9 $91,203 232 $86,595 117 $112,195 6 $38,222 0 $0 29 $94,496 7 $53,006 APPLICATIONS DENIED 33 $120,030 432 $85,499 558 $114,907 127 $30,571 2 $34,920 93 $97,532 21 $53,965 APPLICATIONS WITHDRAWN 26 $118,257 149 $103,997 297 $129,109 39 $196,706 0 $0 29 $105,437 1 $21,000 FILES CLOSED FOR INCOMPLETENESS 4 $88,855 46 $90,793 208 $107,610 3 $21,300 0 $0 10 $104,857 0 $0
Aggregated Statistics For Year 2004(Based on 5 full and 2 partial tracts) A) FHA, FSA/RHS & VA B) Conventional C) Refinancings D) Home Improvement Loans F) Non-occupant Loans on G) Loans On Manufactured Number Average Value Number Average Value Number Average Value Number Average Value Number Average Value Number Average Value
LOANS ORIGINATED 190 $117,025 562 $92,982 542 $95,733 42 $35,204 116 $72,836 5 $89,456 APPLICATIONS APPROVED, NOT ACCEPTED 12 $111,108 182 $99,989 141 $102,416 11 $34,973 32 $115,291 1 $59,680 APPLICATIONS DENIED 47 $123,116 283 $104,013 557 $97,676 106 $38,063 65 $71,250 9 $45,567 APPLICATIONS WITHDRAWN 26 $129,039 113 $107,954 310 $104,288 13 $56,099 29 $85,842 1 $127,190 FILES CLOSED FOR INCOMPLETENESS 10 $77,123 32 $118,469 179 $98,391 2 $104,760 8 $73,594 1 $56,660
Aggregated Statistics For Year 2003(Based on 5 full and 2 partial tracts) A) FHA, FSA/RHS & VA B) Conventional C) Refinancings D) Home Improvement Loans F) Non-occupant Loans on Number Average Value Number Average Value Number Average Value Number Average Value Number Average Value
LOANS ORIGINATED 202 $116,495 347 $98,652 874 $92,592 51 $27,848 87 $68,591 APPLICATIONS APPROVED, NOT ACCEPTED 8 $97,270 110 $108,190 137 $82,824 15 $56,293 16 $95,108 APPLICATIONS DENIED 71 $118,453 187 $93,054 561 $92,962 74 $15,887 53 $89,971 APPLICATIONS WITHDRAWN 50 $129,146 66 $100,179 387 $100,050 14 $26,340 23 $70,916 FILES CLOSED FOR INCOMPLETENESS 1 $101,000 43 $125,934 62 $95,619 2 $9,975 6 $72,565
Aggregated Statistics For Year 2002(Based on 2 full and 2 partial tracts) A) FHA, FSA/RHS & VA B) Conventional C) Refinancings D) Home Improvement Loans F) Non-occupant Loans on Number Average Value Number Average Value Number Average Value Number Average Value Number Average Value
LOANS ORIGINATED 79 $117,838 107 $114,911 145 $105,379 11 $23,467 18 $62,897 APPLICATIONS APPROVED, NOT ACCEPTED 1 $86,200 32 $81,278 26 $109,668 8 $15,238 15 $58,324 APPLICATIONS DENIED 35 $131,059 91 $117,442 95 $113,500 30 $21,517 6 $38,652 APPLICATIONS WITHDRAWN 13 $144,753 29 $132,924 45 $94,599 5 $25,446 5 $92,582 FILES CLOSED FOR INCOMPLETENESS 1 $101,270 14 $115,347 17 $91,980 2 $12,000 0 $0
Aggregated Statistics For Year 2001(Based on 2 full and 2 partial tracts) A) FHA, FSA/RHS & VA B) Conventional C) Refinancings D) Home Improvement Loans F) Non-occupant Loans on Number Average Value Number Average Value Number Average Value Number Average Value Number Average Value
LOANS ORIGINATED 52 $113,458 130 $85,266 119 $105,989 31 $21,211 9 $58,211 APPLICATIONS APPROVED, NOT ACCEPTED 2 $130,000 24 $70,284 37 $87,850 9 $8,116 1 $22,300 APPLICATIONS DENIED 7 $107,446 143 $54,266 90 $98,450 36 $29,781 9 $48,610 APPLICATIONS WITHDRAWN 3 $86,203 11 $82,162 45 $122,974 2 $95,000 1 $5,430 FILES CLOSED FOR INCOMPLETENESS 2 $97,000 19 $80,763 15 $135,057 2 $80,000 2 $80,000
Aggregated Statistics For Year 2000(Based on 2 full and 2 partial tracts) A) FHA, FSA/RHS & VA B) Conventional C) Refinancings D) Home Improvement Loans F) Non-occupant Loans on Number Average Value Number Average Value Number Average Value Number Average Value Number Average Value
LOANS ORIGINATED 42 $95,837 114 $74,836 54 $104,519 19 $21,478 16 $98,085 APPLICATIONS APPROVED, NOT ACCEPTED 11 $110,464 32 $54,150 15 $66,749 12 $25,690 4 $39,482 APPLICATIONS DENIED 5 $93,224 197 $55,224 60 $124,229 43 $19,770 9 $68,103 APPLICATIONS WITHDRAWN 3 $73,033 27 $66,593 31 $73,865 5 $228,444 8 $40,161 FILES CLOSED FOR INCOMPLETENESS 0 $0 7 $116,279 17 $160,767 2 $25,000 0 $0
Aggregated Statistics For Year 1999(Based on 2 full and 2 partial tracts) A) FHA, FSA/RHS & VA B) Conventional C) Refinancings D) Home Improvement Loans F) Non-occupant Loans on Number Average Value Number Average Value Number Average Value Number Average Value Number Average Value
LOANS ORIGINATED 117 $79,233 149 $73,240 110 $78,691 29 $18,599 9 $61,246 APPLICATIONS APPROVED, NOT ACCEPTED 4 $71,000 81 $75,982 38 $79,175 27 $16,514 4 $78,175 APPLICATIONS DENIED 24 $77,172 202 $64,932 73 $75,711 62 $15,917 11 $72,625 APPLICATIONS WITHDRAWN 20 $86,588 26 $93,473 74 $70,171 4 $7,432 2 $51,865 FILES CLOSED FOR INCOMPLETENESS 7 $90,680 9 $98,212 20 $78,573 2 $15,990 0 $0
Detailed HMDA statistics for the following Tracts:
0168.02
,
0168.03 ,
0168.04 ,
0169.03
Private Mortgage Insurance Companies Aggregated Statistics For Year 2009(Based on 5 full tracts) A) Conventional B) Refinancings C) Non-occupant Loans on Number Average Value Number Average Value Number Average Value
LOANS ORIGINATED 18 $108,002 2 $124,000 0 $0 APPLICATIONS APPROVED, NOT ACCEPTED 7 $69,713 4 $104,758 1 $51,000 APPLICATIONS DENIED 0 $0 2 $121,000 0 $0 APPLICATIONS WITHDRAWN 0 $0 0 $0 0 $0 FILES CLOSED FOR INCOMPLETENESS 0 $0 0 $0 0 $0
Aggregated Statistics For Year 2008(Based on 5 full and 2 partial tracts) A) Conventional B) Refinancings C) Non-occupant Loans on Number Average Value Number Average Value Number Average Value
LOANS ORIGINATED 70 $102,057 21 $150,021 19 $81,549 APPLICATIONS APPROVED, NOT ACCEPTED 58 $112,315 11 $141,373 3 $75,917 APPLICATIONS DENIED 14 $116,995 0 $0 6 $129,442 APPLICATIONS WITHDRAWN 3 $116,713 0 $0 0 $0 FILES CLOSED FOR INCOMPLETENESS 5 $87,952 4 $144,838 1 $56,660
Aggregated Statistics For Year 2007(Based on 5 full and 2 partial tracts) A) Conventional B) Refinancings C) Non-occupant Loans on D) Loans On Manufactured Number Average Value Number Average Value Number Average Value Number Average Value
LOANS ORIGINATED 177 $115,122 17 $119,869 21 $91,054 2 $129,000 APPLICATIONS APPROVED, NOT ACCEPTED 28 $143,054 6 $217,998 0 $0 0 $0 APPLICATIONS DENIED 11 $92,679 1 $109,000 2 $130,000 0 $0 APPLICATIONS WITHDRAWN 12 $134,579 3 $80,563 3 $80,563 0 $0 FILES CLOSED FOR INCOMPLETENESS 0 $0 0 $0 0 $0 0 $0
Aggregated Statistics For Year 2006(Based on 5 full and 2 partial tracts) A) Conventional B) Refinancings C) Non-occupant Loans on Number Average Value Number Average Value Number Average Value
LOANS ORIGINATED 68 $112,741 14 $121,693 13 $91,350 APPLICATIONS APPROVED, NOT ACCEPTED 6 $102,623 3 $110,873 2 $128,000 APPLICATIONS DENIED 0 $0 1 $92,000 1 $92,000 APPLICATIONS WITHDRAWN 6 $99,535 0 $0 4 $86,448 FILES CLOSED FOR INCOMPLETENESS 0 $0 0 $0 0 $0
Aggregated Statistics For Year 2005(Based on 5 full and 2 partial tracts) A) Conventional B) Refinancings C) Non-occupant Loans on Number Average Value Number Average Value Number Average Value
LOANS ORIGINATED 52 $88,983 21 $122,540 11 $82,073 APPLICATIONS APPROVED, NOT ACCEPTED 12 $113,357 3 $105,807 0 $0 APPLICATIONS DENIED 0 $0 0 $0 0 $0 APPLICATIONS WITHDRAWN 2 $86,000 1 $100,000 2 $86,000 FILES CLOSED FOR INCOMPLETENESS 0 $0 2 $488,000 2 $488,000
Aggregated Statistics For Year 2004(Based on 5 full and 2 partial tracts) A) Conventional B) Refinancings C) Non-occupant Loans on Number Average Value Number Average Value Number Average Value
LOANS ORIGINATED 102 $111,985 38 $110,657 24 $93,903 APPLICATIONS APPROVED, NOT ACCEPTED 24 $114,882 15 $122,987 8 $94,611 APPLICATIONS DENIED 4 $84,580 0 $0 3 $80,107 APPLICATIONS WITHDRAWN 13 $132,809 6 $128,118 6 $82,262 FILES CLOSED FOR INCOMPLETENESS 2 $128,305 0 $0 0 $0
Aggregated Statistics For Year 2003(Based on 5 full and 2 partial tracts) A) Conventional B) Refinancings C) Non-occupant Loans on Number Average Value Number Average Value Number Average Value
LOANS ORIGINATED 90 $108,572 57 $115,630 7 $71,779 APPLICATIONS APPROVED, NOT ACCEPTED 18 $125,748 20 $120,861 6 $96,942 APPLICATIONS DENIED 1 $105,000 0 $0 1 $105,000 APPLICATIONS WITHDRAWN 4 $69,108 2 $175,500 1 $47,000 FILES CLOSED FOR INCOMPLETENESS 0 $0 0 $0 0 $0
Aggregated Statistics For Year 2002(Based on 2 full and 2 partial tracts) A) Conventional B) Refinancings C) Non-occupant Loans on Number Average Value Number Average Value Number Average Value
LOANS ORIGINATED 46 $130,303 7 $133,431 6 $116,333 APPLICATIONS APPROVED, NOT ACCEPTED 2 $78,000 7 $124,499 4 $91,000 APPLICATIONS DENIED 2 $71,000 0 $0 0 $0 APPLICATIONS WITHDRAWN 0 $0 0 $0 0 $0 FILES CLOSED FOR INCOMPLETENESS 0 $0 0 $0 0 $0
Aggregated Statistics For Year 2001(Based on 2 full and 2 partial tracts) A) Conventional B) Refinancings C) Non-occupant Loans on Number Average Value Number Average Value Number Average Value
LOANS ORIGINATED 21 $93,765 6 $140,000 2 $75,000 APPLICATIONS APPROVED, NOT ACCEPTED 3 $107,517 3 $92,357 1 $91,630 APPLICATIONS DENIED 4 $122,000 1 $59,070 1 $59,070 APPLICATIONS WITHDRAWN 0 $0 6 $161,000 0 $0 FILES CLOSED FOR INCOMPLETENESS 0 $0 0 $0 0 $0
Aggregated Statistics For Year 2000(Based on 2 full and 2 partial tracts) A) Conventional B) Refinancings C) Non-occupant Loans on Number Average Value Number Average Value Number Average Value
LOANS ORIGINATED 16 $91,176 7 $117,304 2 $44,605 APPLICATIONS APPROVED, NOT ACCEPTED 10 $76,130 4 $122,000 4 $37,825 APPLICATIONS DENIED 2 $50,635 2 $162,000 2 $50,635 APPLICATIONS WITHDRAWN 2 $105,000 0 $0 0 $0 FILES CLOSED FOR INCOMPLETENESS 2 $54,555 0 $0 2 $54,555
Aggregated Statistics For Year 1999(Based on 2 full and 2 partial tracts) A) Conventional B) Refinancings C) Non-occupant Loans on Number Average Value Number Average Value Number Average Value
LOANS ORIGINATED 39 $88,367 13 $85,907 2 $104,265 APPLICATIONS APPROVED, NOT ACCEPTED 3 $160,743 5 $100,916 0 $0 APPLICATIONS DENIED 2 $91,935 2 $88,930 0 $0 APPLICATIONS WITHDRAWN 3 $53,000 1 $72,000 0 $0 FILES CLOSED FOR INCOMPLETENESS 0 $0 0 $0 0 $0
Detailed PMIC statistics for the following Tracts:
0168.02
,
0168.03 ,
0168.04 ,
0169.03
2002 - 2018 National Fire Incident Reporting System (NFIRS) incidents See full 2006 National Fire Incident Reporting System statistics for zip code 75146, Texas
Most common first names in zip code 75146 among deceased individuals Name Count Lived (average)
James 105 72.9 years Mary 83 79.4 years William 82 75.4 years John 72 78.0 years Robert 59 71.0 years George 48 76.1 years Charles 39 69.4 years Willie 33 77.0 years Dorothy 29 76.8 years Ruby 28 82.2 years
Most common last names in zip code 75146 among deceased individuals Last name Count Lived (average)
Smith 66 73.4 years Williams 45 74.4 years Jones 41 75.4 years Johnson 34 75.4 years Moore 29 75.0 years Davis 27 76.1 years Scott 21 77.8 years Thompson 21 73.3 years Clark 20 76.0 years Brown 20 76.1 years
Businesses in zip code 75146
Name Count Name Count
7-Eleven 1 Pizza Hut 1 AutoZone 1 RadioShack 1 CVS 1 SONIC Drive-In 1 Church's Chicken 1 Super 8 1 Curves 1 T-Mobile 2 FedEx 4 Taco Bell 1 GameStop 1 U-Haul 1 H&R Block 1 UPS 2 Home Depot 1 Waffle House 1 IHOP 1 Walgreens 1 Jack In The Box 1 Walmart 1 McDonald's 2
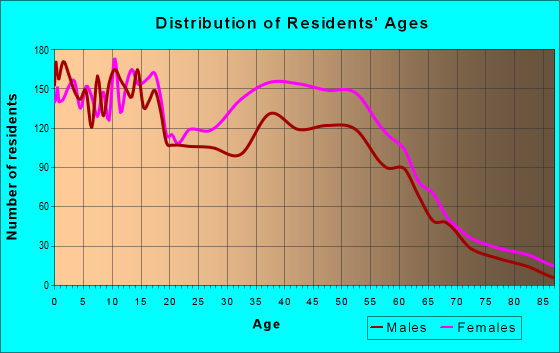
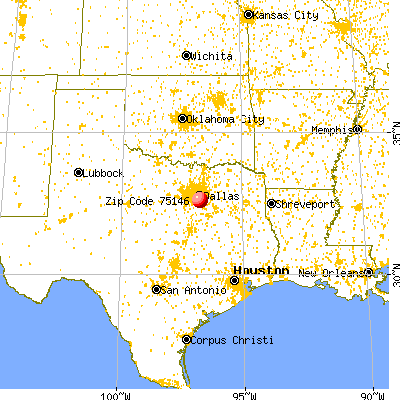


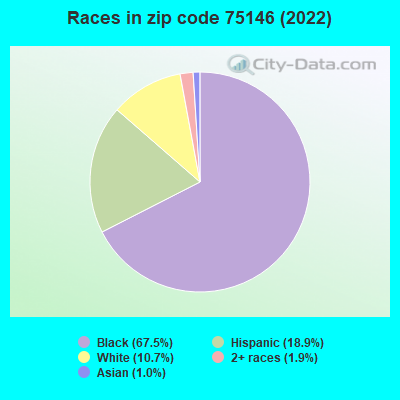


 Nearest zip codes: 75134, 75154, 75172, 75141, 75241, 75115.
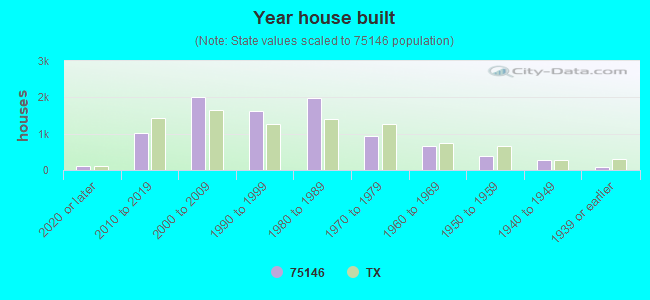
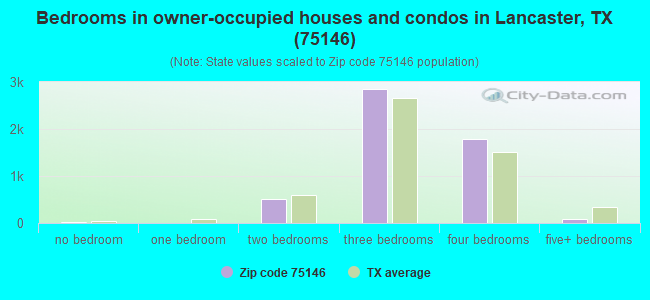
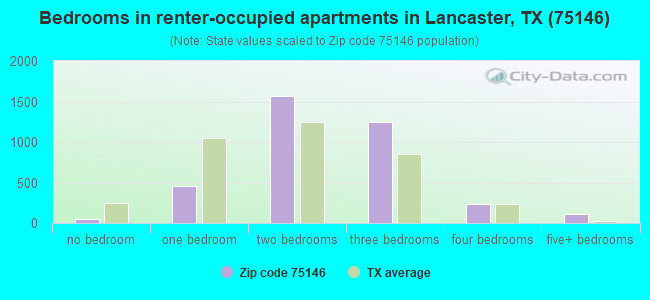
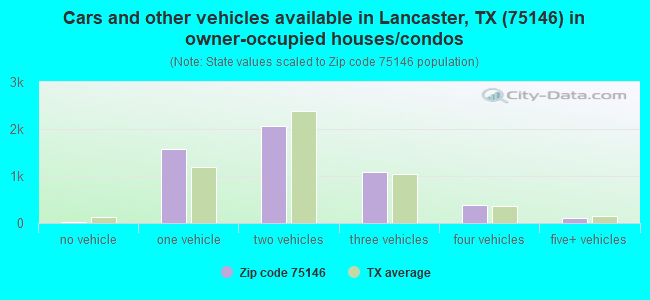
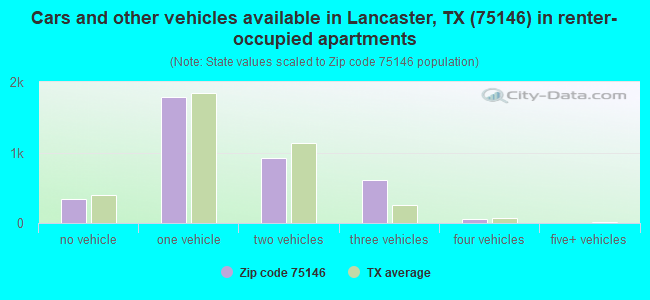


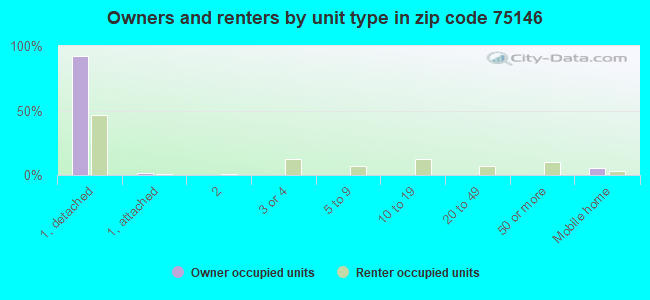
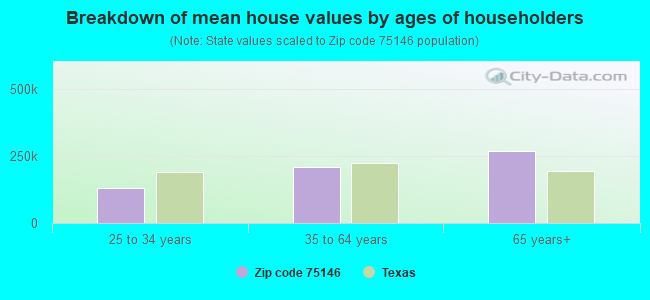


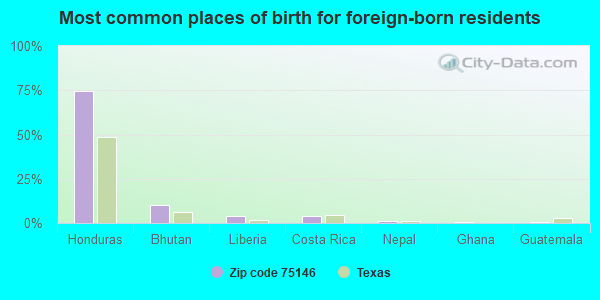
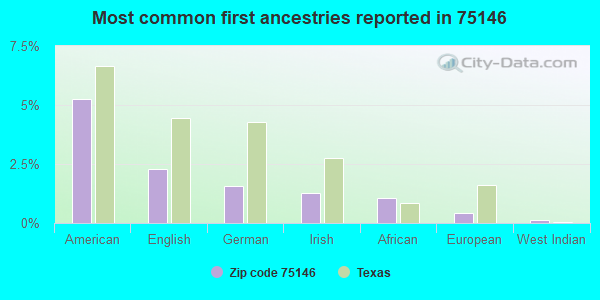
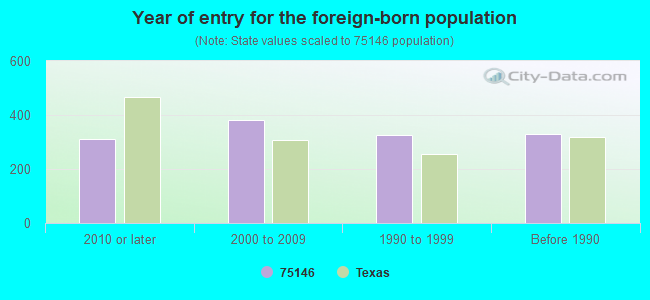


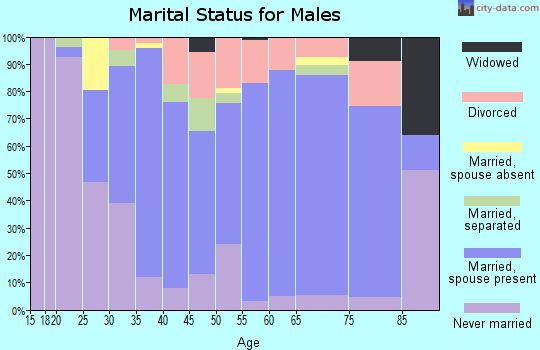
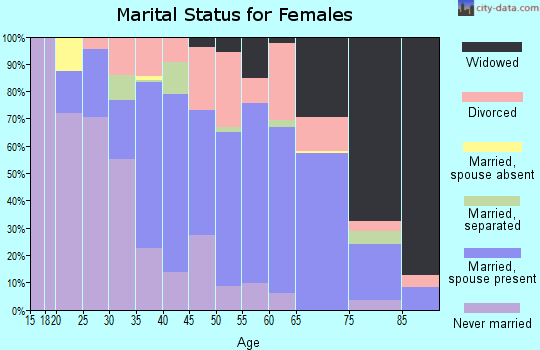
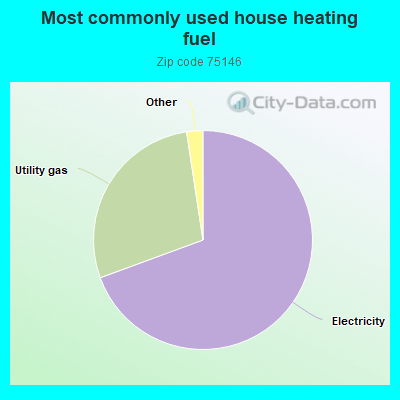
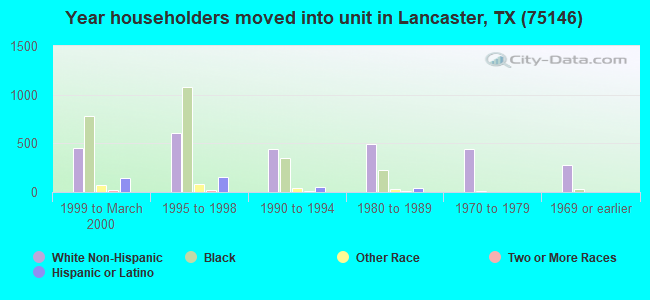
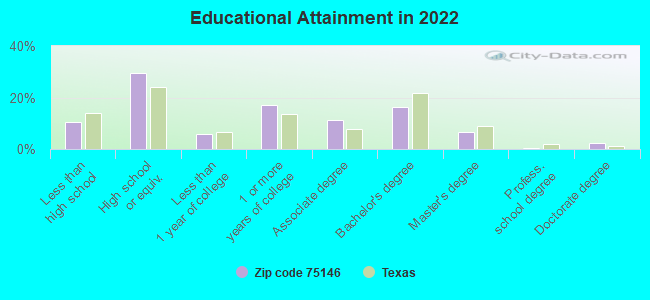
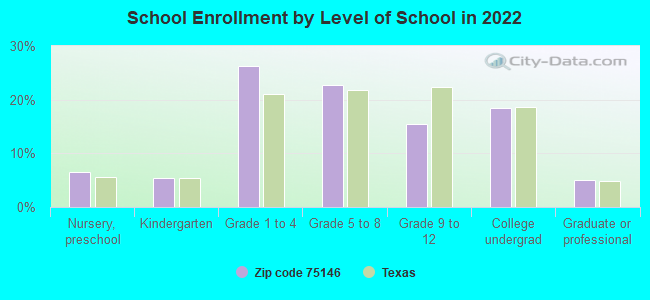
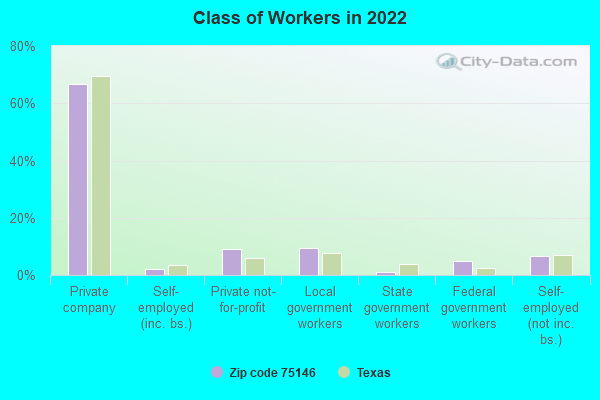
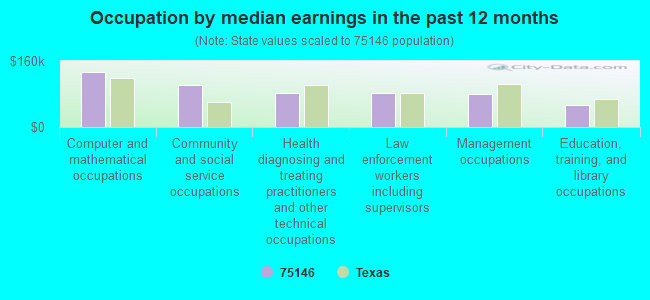
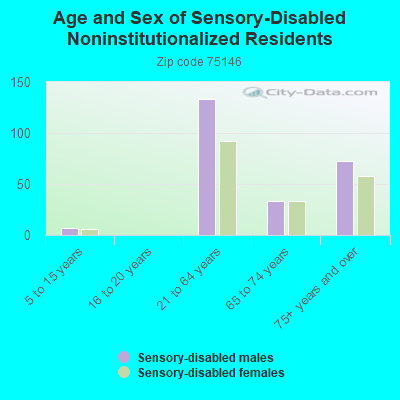
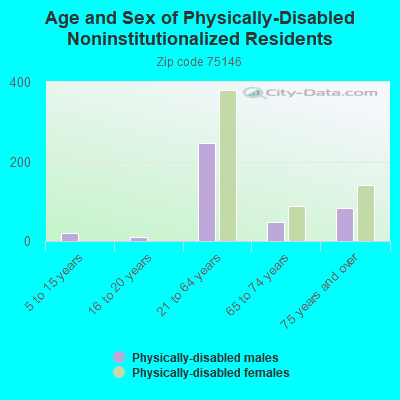
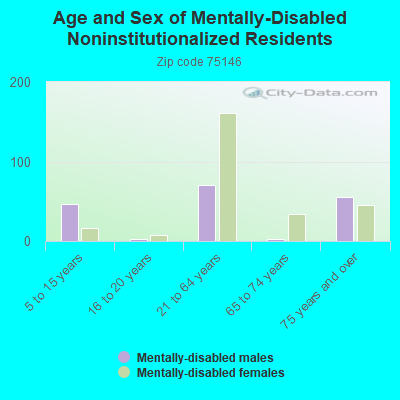
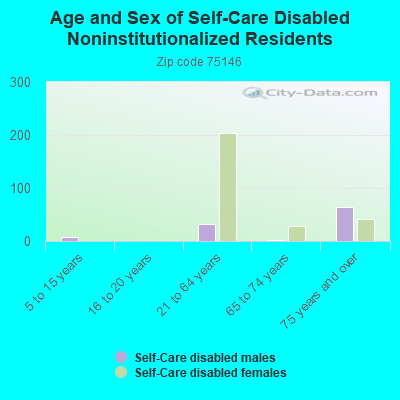
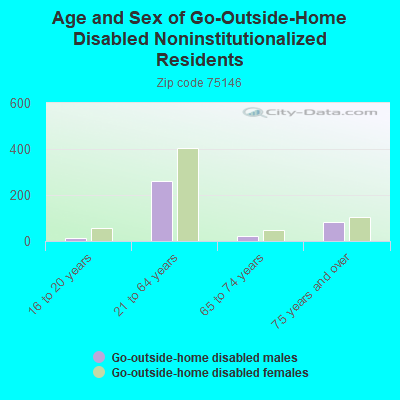
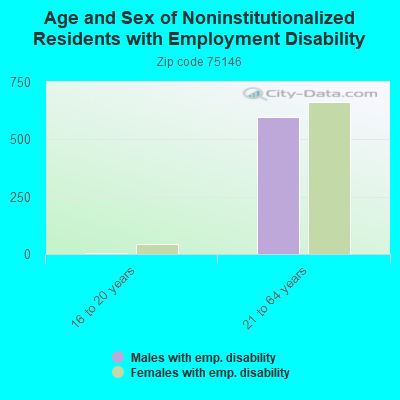
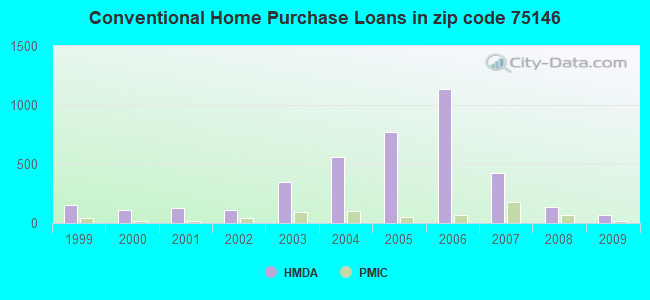
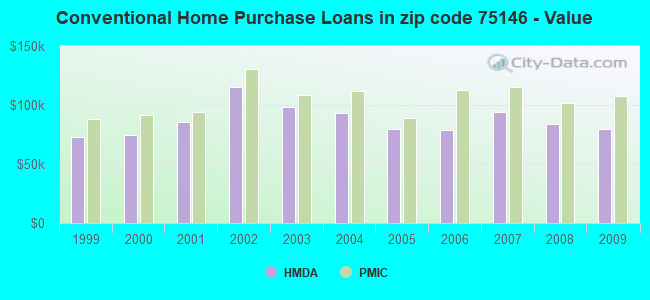
 According to the data from the years 2002 - 2018 the average number of fires per year is 71. The highest number of reported fire incidents - 131 took place in 2006, and the least - 12 in 2009. The data has a dropping trend.
 When looking into fire subcategories, the most reports belonged to: Structure Fires (39.8%), and Outside Fires (39.4%).