Estimated zip code population in 2022: 4,733 Zip code population in 2010: 3,320 Zip code population in 2000: 2,932
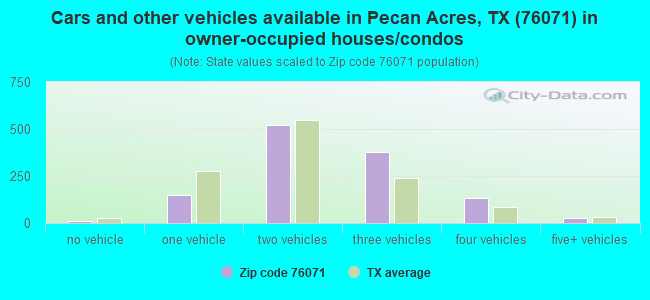
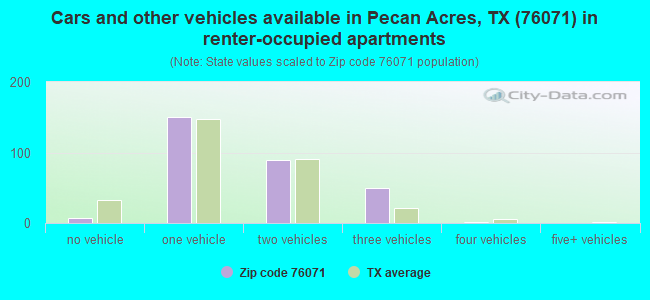
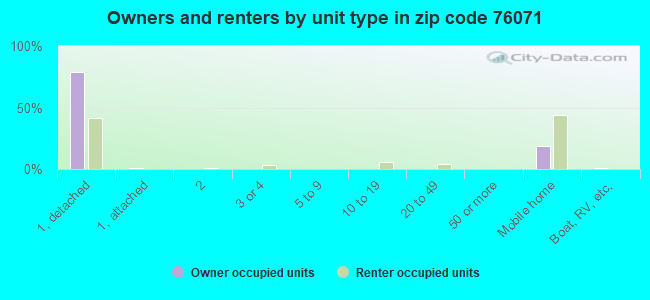
Houses and condos: 1,677 Renter-occupied apartments: 300
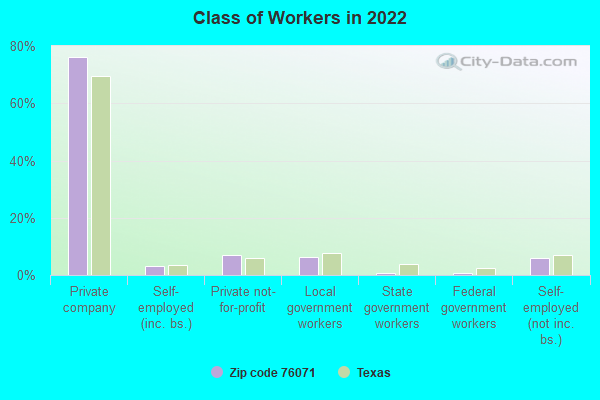
% of renters here:
20%
State:
38%
March 2022 cost of living index in zip code 76071: 89.3 (less than average, U.S. average is 100)
Land area: 7.5 sq. mi. Water area: 0.4 sq. mi.
Population density: 627 people per square mile
(low).
OSM Map
General Map
Google Map
MSN Map
OSM Map
General Map
Google Map
MSN Map
OSM Map
General Map
Google Map
MSN Map
OSM Map
General Map
Google Map
MSN Map
Please wait while loading the map...
Real estate property taxes paid for housing units in 2022:
This zip code:
1.4% ($3,980)
Texas:
1.5% ($4,050)
Median real estate property taxes paid for housing units with mortgages in 2022: $4,897 (1.4%) Median real estate property taxes paid for housing units with no mortgage in 2022: $2,485 (1.7%)
Business Search- 14 Million verified businesses
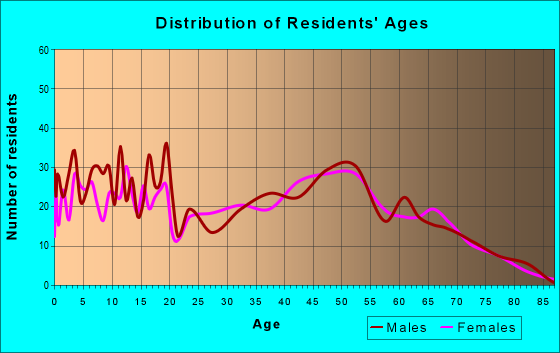
Males: 2,419
(51.1%)
Females: 2,314
(48.9%)
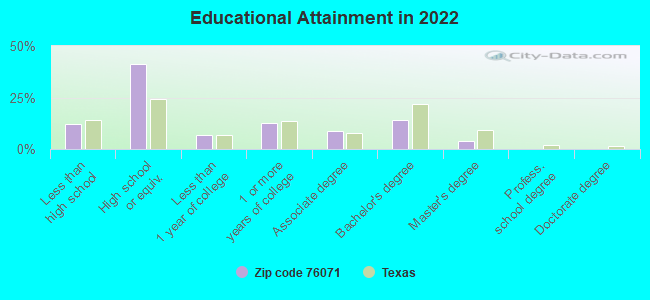
For population 25 years and over in 76071:
High school or higher: 86.6%
Bachelor's degree or higher: 17.7%
Graduate or professional degree: 3.9%
Unemployed: 10.5%
Mean travel time to work (commute): 33.7 minutes
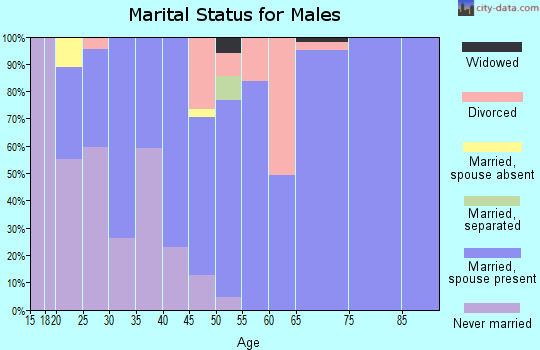
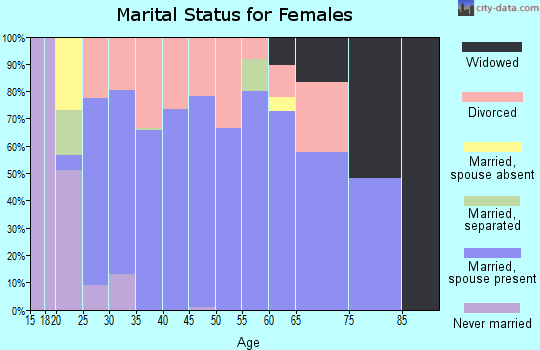
For population 15 years and over in 76071:
Never married: 32.4%
Now married: 52.3%
Separated: 3.0%
Widowed: 2.7%
Divorced: 9.6%
Zip code 76071 compared to state average:
Unemployed percentage above state average.
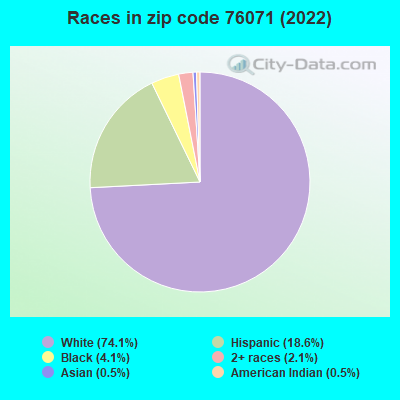
Black race population percentage below state average.
Hispanic race population percentage below state average.
Foreign-born population percentage significantly below state average.
Renting percentage below state average.
Length of stay since moving in significantly above state average.
Percentage of population with a bachelor's degree or higher below state average.
Averages for the 2020 tax year for zip code 76071, filed in 2021:
Average Adjusted Gross Income (AGI) in 2020: $64,684 (Individual Income Tax Returns)
Here:
$64,684
State:
$77,054
Salary/wage: $60,910 (reported on 86.3% of returns)
Here:
$60,910
State:
$62,766
(% of AGI for various income ranges: 1130.4% for AGIs below $25k, 3618.8% for AGIs $25k-50k, 6463.2% for AGIs $50k-75k, 9896.0% for AGIs $75k-100k, 17915.0% for AGIs $100k-200k, 67093.3% for AGIs over 200k)
Taxable interest for individuals: $770 (reported on 16.1% of returns)
This zip code:
$770
Texas:
$2,665
(% of AGI for various income ranges: 3.0% for AGIs below $25k, 7.4% for AGIs $25k-50k, 51.6% for AGIs $50k-75k, 10.7% for AGIs $75k-100k, 27.0% for AGIs $100k-200k, 30.0% for AGIs over 200k)
Ordinary dividends: $1,950 (reported on 9.8% of returns)
Here:
$1,950
State:
$10,044
(% of AGI for various income ranges: 5.2% for AGIs below $25k, 6.0% for AGIs $25k-50k, 20.4% for AGIs $50k-75k, 76.7% for AGIs $75k-100k, 77.0% for AGIs $100k-200k, 63.3% for AGIs over 200k)
Net capital gain/loss in AGI: +$5,171 (reported on 10.2% of returns)
Here:
+$5,171
State:
+$39,590
(% of AGI for various income ranges: 1.4% for AGIs below $25k, 7.1% for AGIs $25k-50k, 15.6% for AGIs $50k-75k, 55.3% for AGIs $75k-100k, 381.5% for AGIs $100k-200k, 546.7% for AGIs over 200k)
Profit/loss from business: +$10,568 (reported on 20.0% of returns)
Here:
+$10,568
State:
+$10,888
(% of AGI for various income ranges: 140.6% for AGIs below $25k, 130.0% for AGIs $25k-50k, 211.6% for AGIs $50k-75k, 172.7% for AGIs $75k-100k, 545.0% for AGIs $100k-200k, 4020.0% for AGIs over 200k)
Taxable individual retirement arrangement distribution: $13,030 (reported on 4.9% of returns)
76071:
$13,030
Texas:
$24,740
(% of AGI for various income ranges: 62.8% for AGIs below $25k, 176.4% for AGIs $50k-75k, 274.0% for AGIs $100k-200k)
Total itemized deductions: $31,713 (reported on 7.3% of returns)
Here:
$31,713
State:
$40,428
(% of AGI for various income ranges: 731.6% for AGIs $50k-75k, 891.0% for AGIs $100k-200k, 3820.0% for AGIs over 200k)
Charity contributions: $11,550 (reported on 5.9% of returns)
Here:
$11,550
State:
$18,201
(% of AGI for various income ranges: 137.6% for AGIs $50k-75k, 293.5% for AGIs $100k-200k, 1516.7% for AGIs over 200k)
Taxes paid: $8,079 (reported on 6.8% of returns)
76071:
$8,079
State:
$7,821
(% of AGI for various income ranges: 147.2% for AGIs $50k-75k, 226.0% for AGIs $100k-200k, 1036.7% for AGIs over 200k)
Earned income credit: $2,376 (reported on 18.5% of returns)
Here:
$2,376
State:
$2,584
(% of AGI for various income ranges: 99.2% for AGIs below $25k, 96.9% for AGIs $25k-50k)
Percentage of individuals using paid preparers for their 2020 taxes: 94.1%
Here:
94%
State:
92%
(% for various income ranges: 93.5% for AGIs below $25k, 96.0% for AGIs $25k-50k, 90.9% for AGIs $50k-75k, 100.0% for AGIs $75k-100k, 93.8% for AGIs $100k-200k, 87.5% for AGIs over 200k)
Averages for the 2012 tax year for zip code 76071, filed in 2013:
Average Adjusted Gross Income (AGI) in 2012: $56,810 (Individual Income Tax Returns)
Here:
$56,810
State:
$65,384
Salary/wage: $51,723 (reported on 89.2% of returns)
Here:
$51,723
State:
$52,524
(% of AGI for various income ranges: 75.5% for AGIs below $25k, 86.9% for AGIs $25k-50k, 85.7% for AGIs $50k-75k, 82.5% for AGIs $75k-100k, 85.7% for AGIs $100k-200k, 60.7% for AGIs over 200k)
Taxable interest for individuals: $500 (reported on 22.2% of returns)
This zip code:
$500
Texas:
$2,372
(% of AGI for various income ranges: 0.4% for AGIs below $25k, 0.2% for AGIs $25k-50k, 0.3% for AGIs $50k-75k, 0.2% for AGIs $75k-100k, 0.1% for AGIs $100k-200k, 0.2% for AGIs over 200k)
Ordinary dividends: $1,500 (reported on 8.9% of returns)
Here:
$1,500
State:
$9,721
(% of AGI for various income ranges: 0.5% for AGIs $25k-50k, 0.1% for AGIs $50k-75k, 0.4% for AGIs $100k-200k)
Net capital gain/loss in AGI: +$1,942 (reported on 7.6% of returns)
Here:
+$1,942
State:
+$35,319
(% of AGI for various income ranges: 1.0% for AGIs $100k-200k)
Profit/loss from business: +$8,200 (reported on 18.4% of returns)
Here:
+$8,200
State:
+$13,732
(% of AGI for various income ranges: 10.5% for AGIs below $25k, 2.1% for AGIs $25k-50k, 2.3% for AGIs $50k-75k, 3.4% for AGIs $75k-100k, 2.1% for AGIs $100k-200k)
Taxable individual retirement arrangement distribution: $16,667 (reported on 7.6% of returns)
76071:
$16,667
Texas:
$19,511
(% of AGI for various income ranges: 2.2% for AGIs below $25k, 1.9% for AGIs $25k-50k, 4.0% for AGIs $50k-75k, 3.5% for AGIs $100k-200k)
Total itemized deductions: $19,973 (19% of AGI, reported on 28.5% of returns)
Here:
$19,973
State:
$24,724
Here:
18.8% of AGI
State:
15.9% of AGI
(% of AGI for various income ranges: 6.6% for AGIs below $25k, 7.7% for AGIs $25k-50k, 10.2% for AGIs $50k-75k, 11.0% for AGIs $75k-100k, 13.1% for AGIs $100k-200k, 6.8% for AGIs over 200k)
Charity contributions: $4,461 (reported on 19.6% of returns)
Here:
$4,461
State:
$6,808
(% of AGI for various income ranges: 0.7% for AGIs $25k-50k, 1.1% for AGIs $50k-75k, 1.6% for AGIs $75k-100k, 2.4% for AGIs $100k-200k, 2.0% for AGIs over 200k)
Taxes paid: $5,589 (reported on 27.8% of returns)
76071:
$5,589
State:
$6,921
(% of AGI for various income ranges: 0.8% for AGIs below $25k, 2.1% for AGIs $25k-50k, 2.1% for AGIs $50k-75k, 2.8% for AGIs $75k-100k, 4.3% for AGIs $100k-200k, 2.0% for AGIs over 200k)
Earned income credit: $2,415 (reported on 21.5% of returns)
Here:
$2,415
State:
$2,570
(% of AGI for various income ranges: 8.8% for AGIs below $25k, 1.5% for AGIs $25k-50k)
Percentage of individuals using paid preparers for their 2012 taxes: 50.6%
Here:
51%
State:
51%
(% for various income ranges: 46.3% for AGIs below $25k, 51.2% for AGIs $25k-50k, 52.0% for AGIs $50k-75k, 53.3% for AGIs $75k-100k, 55.0% for AGIs $100k-200k, 66.7% for AGIs over 200k)
Averages for the 2004 tax year for zip code 76071, filed in 2005:
Average Adjusted Gross Income (AGI) in 2004: $38,776 (Individual Income Tax Returns)
Here:
$38,776
State:
$47,881
Salary/wage: $38,534 (reported on 87.5% of returns)
Here:
$38,534
State:
$41,947
(% of AGI for various income ranges: 89.1% for AGIs below $10k, 78.6% for AGIs $10k-25k, 88.0% for AGIs $25k-50k, 88.0% for AGIs $50k-75k, 87.8% for AGIs $75k-100k, 88.0% for AGIs over 100k)
Taxable interest for individuals: $701 (reported on 29.0% of returns)
This zip code:
$701
Texas:
$2,255
(% of AGI for various income ranges: 2.2% for AGIs below $10k, 1.3% for AGIs $10k-25k, 0.5% for AGIs $25k-50k, 0.4% for AGIs $50k-75k, 0.2% for AGIs $75k-100k, 0.3% for AGIs over 100k)
Taxable dividends: $506 (reported on 12.6% of returns)
Here:
$506
State:
$4,261
(% of AGI for various income ranges: 0.3% for AGIs below $10k, 0.1% for AGIs $10k-25k, 0.2% for AGIs $25k-50k, 0.1% for AGIs $50k-75k, 0.1% for AGIs $75k-100k, 0.2% for AGIs over 100k)
Net capital gain/loss: +$2,059 (reported on 11.1% of returns)
Here:
+$2,059
State:
+$16,110
(% of AGI for various income ranges: -2.1% for AGIs below $10k, -0.2% for AGIs $10k-25k, 0.2% for AGIs $25k-50k, -0.2% for AGIs $50k-75k, 0.4% for AGIs $75k-100k, 2.3% for AGIs over 100k)
Profit/loss from business: +$4,995 (reported on 16.5% of returns)
Here:
+$4,995
State:
+$11,013
(% of AGI for various income ranges: 7.2% for AGIs below $10k, 7.0% for AGIs $10k-25k, 3.1% for AGIs $25k-50k, 0.0% for AGIs $50k-75k, 0.5% for AGIs $75k-100k, 1.3% for AGIs over 100k)
IRA payment deduction: $2,933 (reported on 1.2% of returns)
76071:
$2,933
Texas:
$3,120
Total itemized deductions: $17,426 (22% of AGI, reported on 23.1% of returns)
Here:
$17,426
State:
$19,631
Here:
22.3% of AGI
State:
18.9% of AGI
(% of AGI for various income ranges: 6.8% for AGIs $10k-25k, 7.5% for AGIs $25k-50k, 9.0% for AGIs $50k-75k, 13.4% for AGIs $75k-100k, 14.7% for AGIs over 100k)
Charity contributions deductions: $4,166 (5% of AGI, reported on 18.3% of returns)
Here:
$4,166
State:
$4,753
Here:
5.3% of AGI
State:
4.2% of AGI
(% of AGI for various income ranges: 1.0% for AGIs $10k-25k, 1.1% for AGIs $25k-50k, 1.9% for AGIs $50k-75k, 3.1% for AGIs $75k-100k, 2.8% for AGIs over 100k)
Total tax: $5,412 (reported on 71.6% of returns)
76071:
$5,412
State:
$9,058
(% of AGI for various income ranges: 3.2% for AGIs below $10k, 4.0% for AGIs $10k-25k, 6.8% for AGIs $25k-50k, 8.4% for AGIs $50k-75k, 11.1% for AGIs $75k-100k, 16.4% for AGIs over 100k)
Earned income credit: $2,000 (reported on 20.9% of returns)
Here:
$2,000
State:
$2,024
Percentage of individuals using paid preparers for their 2004 taxes: 58.4%
Here:
58%
State:
57%
(% for various income ranges: 52.8% for AGIs below $10k, 61.3% for AGIs $10k-25k, 61.6% for AGIs $25k-50k, 55.7% for AGIs $50k-75k, 58.8% for AGIs $75k-100k, 58.7% for AGIs over 100k)
Household received Food Stamps/SNAP in the past 12 months: 243 Household did not receive Food Stamps/SNAP in the past 12 months: 1,283
Women who had a birth in the past 12 months: 64 (33 now married, 29 unmarried) Women who did not have a birth in the past 12 months: 1,089 (519 now married, 568 unmarried)
Housing units in zip code 76071 with a mortgage: 833 Houses without a mortgage: 60
Median monthly owner costs for units with a mortgage: $1,998 Median monthly owner costs for units without a mortgage: $538
Residents with income below the poverty level in 2022:
This zip code:
20.2%
Whole state:
14.0%
Residents with income below 50% of the poverty level in 2022:
This zip code:
10.9%
Whole state:
7.4%
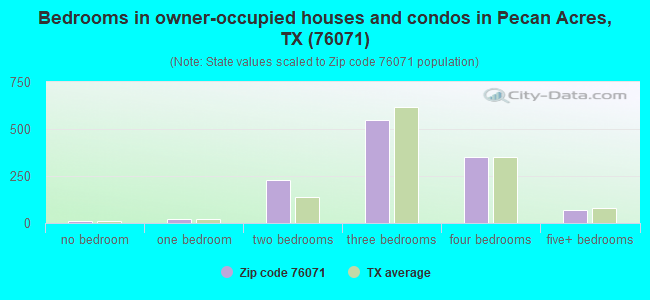
Median number of rooms in houses and condos:
Here:
6.3
State:
6.3
Median number of rooms in apartments:
Here:
4.5
State:
4.0
Notable locations in this zip code not listed on our city pages
873 married couples with children.
303 single-parent households (85 men, 218 women).
85.8% of residents of 76071 zip code speak English at home.
12.3% of residents speak Spanish at home (62% very well, 15% well, 19% not well, 4% not at all).
0.9% of residents speak Asian or Pacific Island language at home (95% very well, 5% well).
0.4% of residents speak other language at home (69% very well, 31% well).
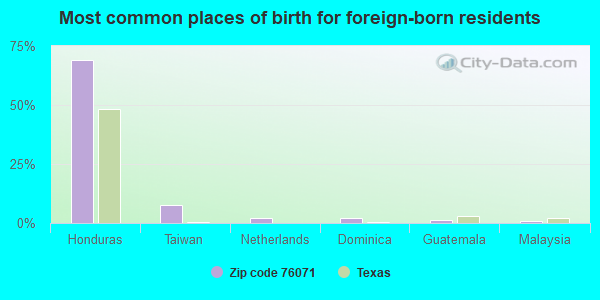
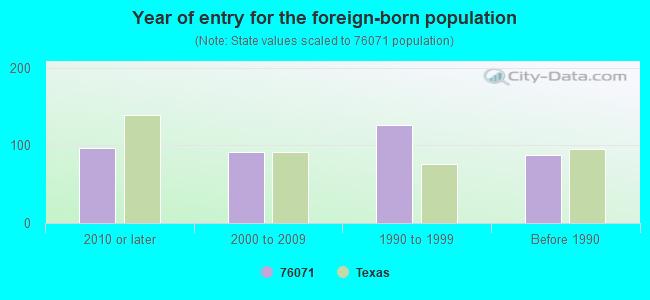
Foreign born population: 251 (5.3%) (24.5% of them are naturalized citizens)
This zip code:
5.3%
Whole state:
17.2%
69%Honduras
8%Taiwan
2%Netherlands
2%Dominica
1%Guatemala
1%Malaysia
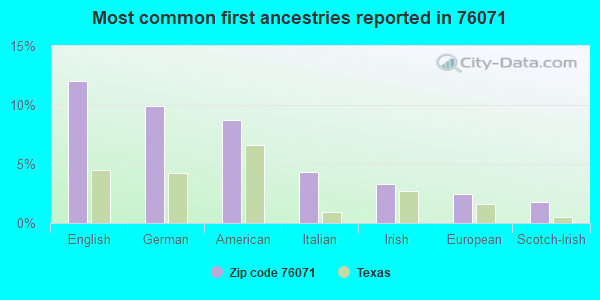
12%English
10%German
9%American
4%Italian
3%Irish
2%European
2%Scotch-Irish
Year of entry for the foreign-born population
962010 or later
912000 to 2009
1261990 to 1999
88Before 1990
Housing units lacking complete plumbing facilities: 6.0% Housing units lacking complete kitchen facilities: 1.7%
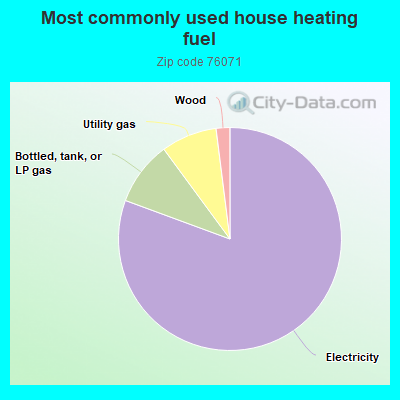
80.7%Electricity
9.3%Bottled, tank, or LP gas
8.1%Utility gas
2.0%Wood
Population in 1990: 2,670. Population change in the 1990s: +262 (+9.8%).
Place of birth for U.S.-born residents:
This state: 2,923
Northeast: 184
Midwest: 320
South: 449
West: 448
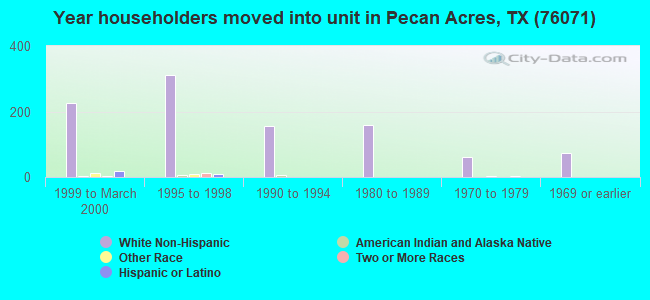
49% of the 76071 zip code residents lived in the same house 5 years ago. Out of people who lived in different houses, 29% lived in this county. Out of people who lived in different counties, 50% lived in Texas.
91% of the 76071 zip code residents lived in the same house 1 year ago. Out of people who lived in different houses, 18% moved from this county. Out of people who lived in different houses, 79% moved from different county within same state. Out of people who lived in different houses, 7% moved from different state.
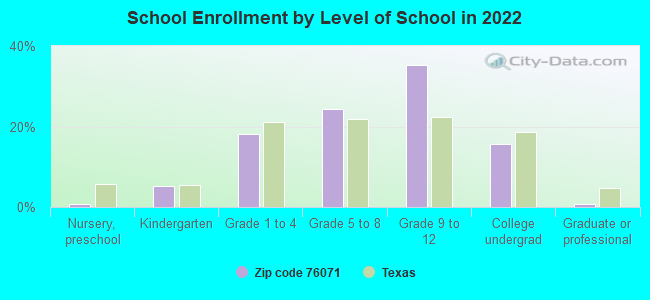
Private vs. public school enrollment:
Students in private schools in grades 1 to 8 (elementary and middle school): 66
Here:
11.2%
Texas:
8.8%
Students in private schools in grades 9 to 12 (high school): 42
Here:
8.5%
Texas:
8.0%
Students in private undergraduate colleges: 36
Here:
16.3%
Texas:
16.2%
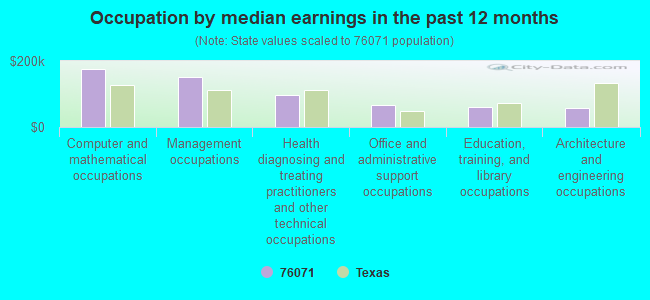
Occupation by median earnings in the past 12 months ($)
176,828Computer and mathematical occupations
151,302Management occupations
97,203Health diagnosing and treating practitioners and other technical occupations
66,487Office and administrative support occupations
59,745Education, training, and library occupations
56,833Architecture and engineering occupations
Companies with federal contracts located in this zip code:
LEONA ZUBER (COUNTY ROAD 4874 in NEWARK, TX; small business) : $27,074 in 4 contractsfrom 2002 to 2004
$6,882 with Army for Custodial Janitorial Services. Taking place in IA. Signed on 2004-01-30. Completion date: 2003-03-31.
$6,882 with U.S. Army Corps of Engineers - civil program financing only for Custodial Janitorial Services. Taking place in IA. Signed on 2004-01-30. Completion date: 2003-03-31.
$6,710, same as above.Signed on 2003-01-21. Completion date: 2003-03-31.
$6,600, same as above.Signed on 2002-01-02. Completion date: 2003-03-31.
Top industries in this zip code by the number of employees in 2005:
Other Services (except Public Administration): Religious Organizations (500-999 employees: 1 establishment, 1-4 employees: 3 establishments)
Administrative and Support and Waste Management and Remediation Services: Janitorial Services (20-49: 1)
Construction: Masonry Contractors (10-19: 1)
Construction: Framing Contractors (5-9: 1)
Construction: Electrical Contractors (1-4: 2)
Home Mortgage Disclosure Act Aggregated Statistics For Year 2009 (Based on 2 partial tracts)
A) FHA, FSA/RHS & VA Home Purchase Loans
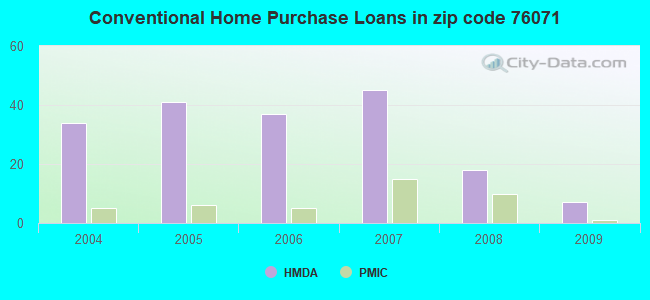
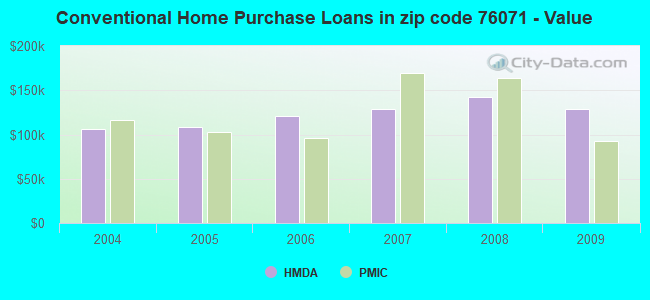
B) Conventional Home Purchase Loans
C) Refinancings
D) Home Improvement Loans
F) Non-occupant Loans on < 5 Family Dwellings (A B C & D)
G) Loans On Manufactured Home Dwelling (A B C & D)
Number
Average Value
Number
Average Value
Number
Average Value
Number
Average Value
Number
Average Value
Number
Average Value
LOANS ORIGINATED
10
$160,254
7
$128,263
29
$169,448
4
$30,790
3
$170,050
2
$45,135
APPLICATIONS APPROVED, NOT ACCEPTED
1
$201,540
1
$209,940
1
$168,650
3
$20,060
0
$0
1
$3,500
APPLICATIONS DENIED
1
$240,730
1
$62,980
21
$399,752
6
$24,027
1
$224,640
1
$15,400
APPLICATIONS WITHDRAWN
0
$0
1
$121,070
15
$153,023
3
$28,227
1
$55,280
1
$32,190
FILES CLOSED FOR INCOMPLETENESS
0
$0
1
$24,490
3
$156,523
1
$109,870
1
$79,780
0
$0
Aggregated Statistics For Year 2008 (Based on 2 partial tracts)
A) FHA, FSA/RHS & VA Home Purchase Loans
B) Conventional Home Purchase Loans
C) Refinancings
D) Home Improvement Loans
F) Non-occupant Loans on < 5 Family Dwellings (A B C & D)
G) Loans On Manufactured Home Dwelling (A B C & D)
Number
Average Value
Number
Average Value
Number
Average Value
Number
Average Value
Number
Average Value
Number
Average Value
LOANS ORIGINATED
22
$168,620
18
$142,759
22
$159,618
8
$48,111
2
$214,140
4
$76,628
APPLICATIONS APPROVED, NOT ACCEPTED
1
$74,180
3
$117,100
3
$164,687
1
$20,290
0
$0
1
$90,270
APPLICATIONS DENIED
2
$135,760
5
$100,772
20
$99,826
10
$27,432
4
$74,180
8
$55,809
APPLICATIONS WITHDRAWN
3
$162,120
3
$198,510
8
$191,570
1
$25,890
1
$314,910
0
$0
FILES CLOSED FOR INCOMPLETENESS
0
$0
0
$0
4
$64,382
0
$0
0
$0
0
$0
Aggregated Statistics For Year 2007 (Based on 2 partial tracts)
A) FHA, FSA/RHS & VA Home Purchase Loans
B) Conventional Home Purchase Loans
C) Refinancings
D) Home Improvement Loans
F) Non-occupant Loans on < 5 Family Dwellings (A B C & D)
G) Loans On Manufactured Home Dwelling (A B C & D)
Number
Average Value
Number
Average Value
Number
Average Value
Number
Average Value
Number
Average Value
Number
Average Value
LOANS ORIGINATED
15
$151,390
45
$129,090
20
$135,971
15
$57,057
6
$73,012
5
$53,044
APPLICATIONS APPROVED, NOT ACCEPTED
1
$254,730
6
$108,585
8
$117,829
3
$66,713
1
$138,560
2
$55,985
APPLICATIONS DENIED
0
$0
10
$90,274
23
$113,854
14
$40,139
5
$62,282
8
$56,946
APPLICATIONS WITHDRAWN
3
$152,323
6
$118,383
10
$135,201
3
$26,127
1
$68,580
0
$0
FILES CLOSED FOR INCOMPLETENESS
0
$0
3
$67,180
7
$140,460
0
$0
0
$0
0
$0
Aggregated Statistics For Year 2006 (Based on 2 partial tracts)
A) FHA, FSA/RHS & VA Home Purchase Loans
B) Conventional Home Purchase Loans
C) Refinancings
D) Home Improvement Loans
F) Non-occupant Loans on < 5 Family Dwellings (A B C & D)
G) Loans On Manufactured Home Dwelling (A B C & D)
Number
Average Value
Number
Average Value
Number
Average Value
Number
Average Value
Number
Average Value
Number
Average Value
LOANS ORIGINATED
6
$70,680
37
$120,971
19
$144,085
11
$37,280
3
$52,950
4
$56,685
APPLICATIONS APPROVED, NOT ACCEPTED
0
$0
8
$142,846
5
$139,540
3
$43,620
1
$34,990
4
$65,257
APPLICATIONS DENIED
2
$78,380
17
$123,988
30
$98,182
15
$27,245
5
$97,552
10
$48,636
APPLICATIONS WITHDRAWN
0
$0
6
$94,473
11
$124,755
1
$20,990
1
$51,790
1
$80,480
FILES CLOSED FOR INCOMPLETENESS
0
$0
0
$0
5
$111,548
1
$17,500
0
$0
0
$0
Aggregated Statistics For Year 2005 (Based on 2 partial tracts)
A) FHA, FSA/RHS & VA Home Purchase Loans
B) Conventional Home Purchase Loans
C) Refinancings
D) Home Improvement Loans
F) Non-occupant Loans on < 5 Family Dwellings (A B C & D)
G) Loans On Manufactured Home Dwelling (A B C & D)
Number
Average Value
Number
Average Value
Number
Average Value
Number
Average Value
Number
Average Value
Number
Average Value
LOANS ORIGINATED
3
$115,000
41
$108,503
30
$126,594
10
$81,457
6
$80,360
6
$51,318
APPLICATIONS APPROVED, NOT ACCEPTED
1
$82,580
8
$71,030
10
$129,813
1
$14,700
0
$0
5
$56,124
APPLICATIONS DENIED
0
$0
22
$88,970
27
$94,240
10
$50,875
2
$32,540
15
$53,045
APPLICATIONS WITHDRAWN
1
$102,870
8
$83,626
14
$162,754
2
$120,715
0
$0
1
$83,280
FILES CLOSED FOR INCOMPLETENESS
0
$0
1
$235,830
6
$148,592
0
$0
0
$0
0
$0
Aggregated Statistics For Year 2004 (Based on 2 partial tracts)
A) FHA, FSA/RHS & VA Home Purchase Loans
B) Conventional Home Purchase Loans
C) Refinancings
D) Home Improvement Loans
F) Non-occupant Loans on < 5 Family Dwellings (A B C & D)
G) Loans On Manufactured Home Dwelling (A B C & D)
Detailed PMIC statistics for the following Tracts:1506.03
2002 - 2018 National Fire Incident Reporting System (NFIRS) incidents
According to the data from the years 2002 - 2018 the average number of fire incidents per year is 39. The highest number of reported fires - 110 took place in 2018, and the least - 0 in 2003. The data has a rising trend.
When looking into fire subcategories, the most reports belonged to: Outside Fires (54.6%), and Structure Fires (34.3%).
Fire incident types reported to NFIRS in Zip Code 76071


 Nearest zip codes: 76052, 76179, 76078, 76177, 76247, 76020.


 : $27,074 in 4 contracts from 2002 to 2004
 According to the data from the years 2002 - 2018 the average number of fire incidents per year is 39. The highest number of reported fires - 110 took place in 2018, and the least - 0 in 2003. The data has a rising trend.
 When looking into fire subcategories, the most reports belonged to: Outside Fires (54.6%), and Structure Fires (34.3%).