Cities: Briar, TX (17.74%) ,
Azle, TX (12.42%) ,
Sanctuary, TX (1.20%) ,
Pelican Bay, TX (0.94%) ,
Pecan Acres, TX (0.28%) ,
Weatherford, TX (0.12%) ,
Fort Worth, TX (0.01%) Counties: Parker County, TX (63.01%) ,
Tarrant County, TX (33.56%) ,
Wise County, TX (3.43%) Estimated zip code population in 2022: 33,822
Zip code population in 2010: 27,270
Zip code population in 2000: 23,303
Houses and condos: 14,169
Renter-occupied apartments: 2,522
% of renters here:
20%State:
38%
March 2022 cost of living index in zip code 76020: 94.1
(less than average, U.S. average is 100)
Land area: 66.0
sq. mi.
Water area: 5.2
sq. mi.
Population density: 512 people per square mile (low).
OSM Map
General Map
Google Map
MSN Map
OSM Map
General Map
Google Map
MSN Map
OSM Map
General Map
Google Map
MSN Map
OSM Map
General Map
Google Map
MSN Map
Please wait while loading the map...
Real estate property taxes paid for housing units in 2022:
This zip code:
1.3% ($3,612)Texas:
1.5% ($4,050)
Median real estate property taxes paid for housing units with mortgages in 2022: $4,148 (1.5%)
Median real estate property taxes paid for housing units with no mortgage in 2022: $2,842 (1.1%)
Profiles of local businesses
Business Search - 14 Million verified businesses
Males: 16,709 Females: 17,113
For population 25 years and over in 76020:
High school or higher: 89.2%Bachelor's degree or higher: 21.7%Graduate or professional degree: 5.6%Unemployed: 3.1%Mean travel time to work (commute): 33.5 minutes
For population 15 years and over in 76020:
Never married: 22.8%Now married: 59.4%Separated: 1.1%Widowed: 7.0%Divorced: 9.7%
Zip code 76020 compared to state average:
Black race population percentage significantly below state average. Hispanic race population percentage below state average. Median age above state average. Foreign-born population percentage significantly below state average. Renting percentage below state average. 26,609 78.7% White 5,702 16.9% Hispanic or Latino 754 2.2% Two or more races 341 1.0% Black 163 0.5% Asian 146 0.4% Some other race 103 0.3% American Indian
Data:
Median household income ($)
Median household income (% change since 2000)
Household income diversity
Ratio of average income to average house value (%)
Ratio of average income to average rent
Median household income ($) - White
Median household income ($) - Black or African American
Median household income ($) - Asian
Median household income ($) - Hispanic or Latino
Median household income ($) - American Indian and Alaska Native
Median household income ($) - Multirace
Median household income ($) - Other Race
Median household income for houses/condos with a mortgage ($)
Median household income for apartments without a mortgage ($)
Races - White alone (%)
Races - White alone (% change since 2000)
Races - Black alone (%)
Races - Black alone (% change since 2000)
Races - American Indian alone (%)
Races - American Indian alone (% change since 2000)
Races - Asian alone (%)
Races - Asian alone (% change since 2000)
Races - Hispanic (%)
Races - Hispanic (% change since 2000)
Races - Native Hawaiian and Other Pacific Islander alone (%)
Races - Native Hawaiian and Other Pacific Islander alone (% change since 2000)
Races - Two or more races (%)
Races - Two or more races (% change since 2000)
Races - Other race alone (%)
Races - Other race alone (% change since 2000)
Racial diversity
Unemployment (%)
Unemployment (% change since 2000)
Unemployment (%) - White
Unemployment (%) - Black or African American
Unemployment (%) - Asian
Unemployment (%) - Hispanic or Latino
Unemployment (%) - American Indian and Alaska Native
Unemployment (%) - Multirace
Unemployment (%) - Other Race
Population density (people per square mile)
Population - Males (%)
Population - Females (%)
Population - Males (%) - White
Population - Males (%) - Black or African American
Population - Males (%) - Asian
Population - Males (%) - Hispanic or Latino
Population - Males (%) - American Indian and Alaska Native
Population - Males (%) - Multirace
Population - Males (%) - Other Race
Population - Females (%) - White
Population - Females (%) - Black or African American
Population - Females (%) - Asian
Population - Females (%) - Hispanic or Latino
Population - Females (%) - American Indian and Alaska Native
Population - Females (%) - Multirace
Population - Females (%) - Other Race
Coronavirus confirmed cases (Apr 27, 2024)
Deaths caused by coronavirus (Apr 27, 2024)
Coronavirus confirmed cases (per 100k population) (Apr 27, 2024)
Deaths caused by coronavirus (per 100k population) (Apr 27, 2024)
Daily increase in number of cases (Apr 27, 2024)
Weekly increase in number of cases (Apr 27, 2024)
Cases doubled (in days) (Apr 27, 2024)
Hospitalized patients (Apr 18, 2022)
Negative test results (Apr 18, 2022)
Total test results (Apr 18, 2022)
COVID Vaccine doses distributed (per 100k population) (Sep 19, 2023)
COVID Vaccine doses administered (per 100k population) (Sep 19, 2023)
COVID Vaccine doses distributed (Sep 19, 2023)
COVID Vaccine doses administered (Sep 19, 2023)
Likely homosexual households (%)
Likely homosexual households (% change since 2000)
Likely homosexual households - Lesbian couples (%)
Likely homosexual households - Lesbian couples (% change since 2000)
Likely homosexual households - Gay men (%)
Likely homosexual households - Gay men (% change since 2000)
Cost of living index
Median gross rent ($)
Median contract rent ($)
Median monthly housing costs ($)
Median house or condo value ($)
Median house or condo value ($ change since 2000)
Mean house or condo value by units in structure - 1, detached ($)
Mean house or condo value by units in structure - 1, attached ($)
Mean house or condo value by units in structure - 2 ($)
Mean house or condo value by units in structure by units in structure - 3 or 4 ($)
Mean house or condo value by units in structure - 5 or more ($)
Mean house or condo value by units in structure - Boat, RV, van, etc. ($)
Mean house or condo value by units in structure - Mobile home ($)
Median house or condo value ($) - White
Median house or condo value ($) - Black or African American
Median house or condo value ($) - Asian
Median house or condo value ($) - Hispanic or Latino
Median house or condo value ($) - American Indian and Alaska Native
Median house or condo value ($) - Multirace
Median house or condo value ($) - Other Race
Median resident age
Resident age diversity
Median resident age - Males
Median resident age - Females
Median resident age - White
Median resident age - Black or African American
Median resident age - Asian
Median resident age - Hispanic or Latino
Median resident age - American Indian and Alaska Native
Median resident age - Multirace
Median resident age - Other Race
Median resident age - Males - White
Median resident age - Males - Black or African American
Median resident age - Males - Asian
Median resident age - Males - Hispanic or Latino
Median resident age - Males - American Indian and Alaska Native
Median resident age - Males - Multirace
Median resident age - Males - Other Race
Median resident age - Females - White
Median resident age - Females - Black or African American
Median resident age - Females - Asian
Median resident age - Females - Hispanic or Latino
Median resident age - Females - American Indian and Alaska Native
Median resident age - Females - Multirace
Median resident age - Females - Other Race
Commute - mean travel time to work (minutes)
Travel time to work - Less than 5 minutes (%)
Travel time to work - Less than 5 minutes (% change since 2000)
Travel time to work - 5 to 9 minutes (%)
Travel time to work - 5 to 9 minutes (% change since 2000)
Travel time to work - 10 to 19 minutes (%)
Travel time to work - 10 to 19 minutes (% change since 2000)
Travel time to work - 20 to 29 minutes (%)
Travel time to work - 20 to 29 minutes (% change since 2000)
Travel time to work - 30 to 39 minutes (%)
Travel time to work - 30 to 39 minutes (% change since 2000)
Travel time to work - 40 to 59 minutes (%)
Travel time to work - 40 to 59 minutes (% change since 2000)
Travel time to work - 60 to 89 minutes (%)
Travel time to work - 60 to 89 minutes (% change since 2000)
Travel time to work - 90 or more minutes (%)
Travel time to work - 90 or more minutes (% change since 2000)
Marital status - Never married (%)
Marital status - Now married (%)
Marital status - Separated (%)
Marital status - Widowed (%)
Marital status - Divorced (%)
Median family income ($)
Median family income (% change since 2000)
Median non-family income ($)
Median non-family income (% change since 2000)
Median per capita income ($)
Median per capita income (% change since 2000)
Median family income ($) - White
Median family income ($) - Black or African American
Median family income ($) - Asian
Median family income ($) - Hispanic or Latino
Median family income ($) - American Indian and Alaska Native
Median family income ($) - Multirace
Median family income ($) - Other Race
Median year house/condo built
Median year apartment built
Year house built - Built 2005 or later (%)
Year house built - Built 2000 to 2004 (%)
Year house built - Built 1990 to 1999 (%)
Year house built - Built 1980 to 1989 (%)
Year house built - Built 1970 to 1979 (%)
Year house built - Built 1960 to 1969 (%)
Year house built - Built 1950 to 1959 (%)
Year house built - Built 1940 to 1949 (%)
Year house built - Built 1939 or earlier (%)
Average household size
Household density (households per square mile)
Average household size - White
Average household size - Black or African American
Average household size - Asian
Average household size - Hispanic or Latino
Average household size - American Indian and Alaska Native
Average household size - Multirace
Average household size - Other Race
Occupied housing units (%)
Vacant housing units (%)
Owner occupied housing units (%)
Renter occupied housing units (%)
Vacancy status - For rent (%)
Vacancy status - For sale only (%)
Vacancy status - Rented or sold, not occupied (%)
Vacancy status - For seasonal, recreational, or occasional use (%)
Vacancy status - For migrant workers (%)
Vacancy status - Other vacant (%)
Residents with income below the poverty level (%)
Residents with income below 50% of the poverty level (%)
Children below poverty level (%)
Poor families by family type - Married-couple family (%)
Poor families by family type - Male, no wife present (%)
Poor families by family type - Female, no husband present (%)
Poverty status for native-born residents (%)
Poverty status for foreign-born residents (%)
Poverty among high school graduates not in families (%)
Poverty among people who did not graduate high school not in families (%)
Residents with income below the poverty level (%) - White
Residents with income below the poverty level (%) - Black or African American
Residents with income below the poverty level (%) - Asian
Residents with income below the poverty level (%) - Hispanic or Latino
Residents with income below the poverty level (%) - American Indian and Alaska Native
Residents with income below the poverty level (%) - Multirace
Residents with income below the poverty level (%) - Other Race
Air pollution - Air Quality Index (AQI)
Air pollution - CO
Air pollution - NO2
Air pollution - SO2
Air pollution - Ozone
Air pollution - PM10
Air pollution - PM25
Air pollution - Pb
Crime - Murders per 100,000 population
Crime - Rapes per 100,000 population
Crime - Robberies per 100,000 population
Crime - Assaults per 100,000 population
Crime - Burglaries per 100,000 population
Crime - Thefts per 100,000 population
Crime - Auto thefts per 100,000 population
Crime - Arson per 100,000 population
Crime - City-data.com crime index
Crime - Violent crime index
Crime - Property crime index
Crime - Murders per 100,000 population (5 year average)
Crime - Rapes per 100,000 population (5 year average)
Crime - Robberies per 100,000 population (5 year average)
Crime - Assaults per 100,000 population (5 year average)
Crime - Burglaries per 100,000 population (5 year average)
Crime - Thefts per 100,000 population (5 year average)
Crime - Auto thefts per 100,000 population (5 year average)
Crime - Arson per 100,000 population (5 year average)
Crime - City-data.com crime index (5 year average)
Crime - Violent crime index (5 year average)
Crime - Property crime index (5 year average)
1996 Presidential Elections Results (%) - Democratic Party (Clinton)
1996 Presidential Elections Results (%) - Republican Party (Dole)
1996 Presidential Elections Results (%) - Other
2000 Presidential Elections Results (%) - Democratic Party (Gore)
2000 Presidential Elections Results (%) - Republican Party (Bush)
2000 Presidential Elections Results (%) - Other
2004 Presidential Elections Results (%) - Democratic Party (Kerry)
2004 Presidential Elections Results (%) - Republican Party (Bush)
2004 Presidential Elections Results (%) - Other
2008 Presidential Elections Results (%) - Democratic Party (Obama)
2008 Presidential Elections Results (%) - Republican Party (McCain)
2008 Presidential Elections Results (%) - Other
2012 Presidential Elections Results (%) - Democratic Party (Obama)
2012 Presidential Elections Results (%) - Republican Party (Romney)
2012 Presidential Elections Results (%) - Other
2016 Presidential Elections Results (%) - Democratic Party (Clinton)
2016 Presidential Elections Results (%) - Republican Party (Trump)
2016 Presidential Elections Results (%) - Other
2020 Presidential Elections Results (%) - Democratic Party (Biden)
2020 Presidential Elections Results (%) - Republican Party (Trump)
2020 Presidential Elections Results (%) - Other
Ancestries Reported - Arab (%)
Ancestries Reported - Czech (%)
Ancestries Reported - Danish (%)
Ancestries Reported - Dutch (%)
Ancestries Reported - English (%)
Ancestries Reported - French (%)
Ancestries Reported - French Canadian (%)
Ancestries Reported - German (%)
Ancestries Reported - Greek (%)
Ancestries Reported - Hungarian (%)
Ancestries Reported - Irish (%)
Ancestries Reported - Italian (%)
Ancestries Reported - Lithuanian (%)
Ancestries Reported - Norwegian (%)
Ancestries Reported - Polish (%)
Ancestries Reported - Portuguese (%)
Ancestries Reported - Russian (%)
Ancestries Reported - Scotch-Irish (%)
Ancestries Reported - Scottish (%)
Ancestries Reported - Slovak (%)
Ancestries Reported - Subsaharan African (%)
Ancestries Reported - Swedish (%)
Ancestries Reported - Swiss (%)
Ancestries Reported - Ukrainian (%)
Ancestries Reported - United States (%)
Ancestries Reported - Welsh (%)
Ancestries Reported - West Indian (%)
Ancestries Reported - Other (%)
Educational Attainment - No schooling completed (%)
Educational Attainment - Less than high school (%)
Educational Attainment - High school or equivalent (%)
Educational Attainment - Less than 1 year of college (%)
Educational Attainment - 1 or more years of college (%)
Educational Attainment - Associate degree (%)
Educational Attainment - Bachelor's degree (%)
Educational Attainment - Master's degree (%)
Educational Attainment - Professional school degree (%)
Educational Attainment - Doctorate degree (%)
School Enrollment - Nursery, preschool (%)
School Enrollment - Kindergarten (%)
School Enrollment - Grade 1 to 4 (%)
School Enrollment - Grade 5 to 8 (%)
School Enrollment - Grade 9 to 12 (%)
School Enrollment - College undergrad (%)
School Enrollment - Graduate or professional (%)
School Enrollment - Not enrolled in school (%)
School enrollment - Public schools (%)
School enrollment - Private schools (%)
School enrollment - Not enrolled (%)
Median number of rooms in houses and condos
Median number of rooms in apartments
Housing units lacking complete plumbing facilities (%)
Housing units lacking complete kitchen facilities (%)
Density of houses
Urban houses (%)
Rural houses (%)
Households with people 60 years and over (%)
Households with people 65 years and over (%)
Households with people 75 years and over (%)
Households with one or more nonrelatives (%)
Households with no nonrelatives (%)
Population in households (%)
Family households (%)
Nonfamily households (%)
Population in families (%)
Family households with own children (%)
Median number of bedrooms in owner occupied houses
Mean number of bedrooms in owner occupied houses
Median number of bedrooms in renter occupied houses
Mean number of bedrooms in renter occupied houses
Median number of vehichles in owner occupied houses
Mean number of vehichles in owner occupied houses
Median number of vehichles in renter occupied houses
Mean number of vehichles in renter occupied houses
Mortgage status - with mortgage (%)
Mortgage status - with second mortgage (%)
Mortgage status - with home equity loan (%)
Mortgage status - with both second mortgage and home equity loan (%)
Mortgage status - without a mortgage (%)
Average family size
Average family size - White
Average family size - Black or African American
Average family size - Asian
Average family size - Hispanic or Latino
Average family size - American Indian and Alaska Native
Average family size - Multirace
Average family size - Other Race
Geographical mobility - Same house 1 year ago (%)
Geographical mobility - Moved within same county (%)
Geographical mobility - Moved from different county within same state (%)
Geographical mobility - Moved from different state (%)
Geographical mobility - Moved from abroad (%)
Place of birth - Born in state of residence (%)
Place of birth - Born in other state (%)
Place of birth - Native, outside of US (%)
Place of birth - Foreign born (%)
Housing units in structures - 1, detached (%)
Housing units in structures - 1, attached (%)
Housing units in structures - 2 (%)
Housing units in structures - 3 or 4 (%)
Housing units in structures - 5 to 9 (%)
Housing units in structures - 10 to 19 (%)
Housing units in structures - 20 to 49 (%)
Housing units in structures - 50 or more (%)
Housing units in structures - Mobile home (%)
Housing units in structures - Boat, RV, van, etc. (%)
House/condo owner moved in on average (years ago)
Renter moved in on average (years ago)
Year householder moved into unit - Moved in 1999 to March 2000 (%)
Year householder moved into unit - Moved in 1995 to 1998 (%)
Year householder moved into unit - Moved in 1990 to 1994 (%)
Year householder moved into unit - Moved in 1980 to 1989 (%)
Year householder moved into unit - Moved in 1970 to 1979 (%)
Year householder moved into unit - Moved in 1969 or earlier (%)
Means of transportation to work - Drove car alone (%)
Means of transportation to work - Carpooled (%)
Means of transportation to work - Public transportation (%)
Means of transportation to work - Bus or trolley bus (%)
Means of transportation to work - Streetcar or trolley car (%)
Means of transportation to work - Subway or elevated (%)
Means of transportation to work - Railroad (%)
Means of transportation to work - Ferryboat (%)
Means of transportation to work - Taxicab (%)
Means of transportation to work - Motorcycle (%)
Means of transportation to work - Bicycle (%)
Means of transportation to work - Walked (%)
Means of transportation to work - Other means (%)
Working at home (%)
Industry diversity
Most Common Industries - Agriculture, forestry, fishing and hunting, and mining (%)
Most Common Industries - Agriculture, forestry, fishing and hunting (%)
Most Common Industries - Mining, quarrying, and oil and gas extraction (%)
Most Common Industries - Construction (%)
Most Common Industries - Manufacturing (%)
Most Common Industries - Wholesale trade (%)
Most Common Industries - Retail trade (%)
Most Common Industries - Transportation and warehousing, and utilities (%)
Most Common Industries - Transportation and warehousing (%)
Most Common Industries - Utilities (%)
Most Common Industries - Information (%)
Most Common Industries - Finance and insurance, and real estate and rental and leasing (%)
Most Common Industries - Finance and insurance (%)
Most Common Industries - Real estate and rental and leasing (%)
Most Common Industries - Professional, scientific, and management, and administrative and waste management services (%)
Most Common Industries - Professional, scientific, and technical services (%)
Most Common Industries - Management of companies and enterprises (%)
Most Common Industries - Administrative and support and waste management services (%)
Most Common Industries - Educational services, and health care and social assistance (%)
Most Common Industries - Educational services (%)
Most Common Industries - Health care and social assistance (%)
Most Common Industries - Arts, entertainment, and recreation, and accommodation and food services (%)
Most Common Industries - Arts, entertainment, and recreation (%)
Most Common Industries - Accommodation and food services (%)
Most Common Industries - Other services, except public administration (%)
Most Common Industries - Public administration (%)
Occupation diversity
Most Common Occupations - Management, business, science, and arts occupations (%)
Most Common Occupations - Management, business, and financial occupations (%)
Most Common Occupations - Management occupations (%)
Most Common Occupations - Business and financial operations occupations (%)
Most Common Occupations - Computer, engineering, and science occupations (%)
Most Common Occupations - Computer and mathematical occupations (%)
Most Common Occupations - Architecture and engineering occupations (%)
Most Common Occupations - Life, physical, and social science occupations (%)
Most Common Occupations - Education, legal, community service, arts, and media occupations (%)
Most Common Occupations - Community and social service occupations (%)
Most Common Occupations - Legal occupations (%)
Most Common Occupations - Education, training, and library occupations (%)
Most Common Occupations - Arts, design, entertainment, sports, and media occupations (%)
Most Common Occupations - Healthcare practitioners and technical occupations (%)
Most Common Occupations - Health diagnosing and treating practitioners and other technical occupations (%)
Most Common Occupations - Health technologists and technicians (%)
Most Common Occupations - Service occupations (%)
Most Common Occupations - Healthcare support occupations (%)
Most Common Occupations - Protective service occupations (%)
Most Common Occupations - Fire fighting and prevention, and other protective service workers including supervisors (%)
Most Common Occupations - Law enforcement workers including supervisors (%)
Most Common Occupations - Food preparation and serving related occupations (%)
Most Common Occupations - Building and grounds cleaning and maintenance occupations (%)
Most Common Occupations - Personal care and service occupations (%)
Most Common Occupations - Sales and office occupations (%)
Most Common Occupations - Sales and related occupations (%)
Most Common Occupations - Office and administrative support occupations (%)
Most Common Occupations - Natural resources, construction, and maintenance occupations (%)
Most Common Occupations - Farming, fishing, and forestry occupations (%)
Most Common Occupations - Construction and extraction occupations (%)
Most Common Occupations - Installation, maintenance, and repair occupations (%)
Most Common Occupations - Production, transportation, and material moving occupations (%)
Most Common Occupations - Production occupations (%)
Most Common Occupations - Transportation occupations (%)
Most Common Occupations - Material moving occupations (%)
People in Group quarters - Institutionalized population (%)
People in Group quarters - Correctional institutions (%)
People in Group quarters - Federal prisons and detention centers (%)
People in Group quarters - Halfway houses (%)
People in Group quarters - Local jails and other confinement facilities (including police lockups) (%)
People in Group quarters - Military disciplinary barracks (%)
People in Group quarters - State prisons (%)
People in Group quarters - Other types of correctional institutions (%)
People in Group quarters - Nursing homes (%)
People in Group quarters - Hospitals/wards, hospices, and schools for the handicapped (%)
People in Group quarters - Hospitals/wards and hospices for chronically ill (%)
People in Group quarters - Hospices or homes for chronically ill (%)
People in Group quarters - Military hospitals or wards for chronically ill (%)
People in Group quarters - Other hospitals or wards for chronically ill (%)
People in Group quarters - Hospitals or wards for drug/alcohol abuse (%)
People in Group quarters - Mental (Psychiatric) hospitals or wards (%)
People in Group quarters - Schools, hospitals, or wards for the mentally retarded (%)
People in Group quarters - Schools, hospitals, or wards for the physically handicapped (%)
People in Group quarters - Institutions for the deaf (%)
People in Group quarters - Institutions for the blind (%)
People in Group quarters - Orthopedic wards and institutions for the physically handicapped (%)
People in Group quarters - Wards in general hospitals for patients who have no usual home elsewhere (%)
People in Group quarters - Wards in military hospitals for patients who have no usual home elsewhere (%)
People in Group quarters - Juvenile institutions (%)
People in Group quarters - Long-term care (%)
People in Group quarters - Homes for abused, dependent, and neglected children (%)
People in Group quarters - Residential treatment centers for emotionally disturbed children (%)
People in Group quarters - Training schools for juvenile delinquents (%)
People in Group quarters - Short-term care, detention or diagnostic centers for delinquent children (%)
People in Group quarters - Type of juvenile institution unknown (%)
People in Group quarters - Noninstitutionalized population (%)
People in Group quarters - College dormitories (includes college quarters off campus) (%)
People in Group quarters - Military quarters (%)
People in Group quarters - On base (%)
People in Group quarters - Barracks, unaccompanied personnel housing (UPH), (Enlisted/Officer), ;and similar group living quarters for military personnel (%)
People in Group quarters - Transient quarters for temporary residents (%)
People in Group quarters - Military ships (%)
People in Group quarters - Group homes (%)
People in Group quarters - Homes or halfway houses for drug/alcohol abuse (%)
People in Group quarters - Homes for the mentally ill (%)
People in Group quarters - Homes for the mentally retarded (%)
People in Group quarters - Homes for the physically handicapped (%)
People in Group quarters - Other group homes (%)
People in Group quarters - Religious group quarters (%)
People in Group quarters - Dormitories (%)
People in Group quarters - Agriculture workers' dormitories on farms (%)
People in Group quarters - Job Corps and vocational training facilities (%)
People in Group quarters - Other workers' dormitories (%)
People in Group quarters - Crews of maritime vessels (%)
People in Group quarters - Other nonhousehold living situations (%)
People in Group quarters - Other noninstitutional group quarters (%)
Residents speaking English at home (%)
Residents speaking English at home - Born in the United States (%)
Residents speaking English at home - Native, born elsewhere (%)
Residents speaking English at home - Foreign born (%)
Residents speaking Spanish at home (%)
Residents speaking Spanish at home - Born in the United States (%)
Residents speaking Spanish at home - Native, born elsewhere (%)
Residents speaking Spanish at home - Foreign born (%)
Residents speaking other language at home (%)
Residents speaking other language at home - Born in the United States (%)
Residents speaking other language at home - Native, born elsewhere (%)
Residents speaking other language at home - Foreign born (%)
Class of Workers - Employee of private company (%)
Class of Workers - Self-employed in own incorporated business (%)
Class of Workers - Private not-for-profit wage and salary workers (%)
Class of Workers - Local government workers (%)
Class of Workers - State government workers (%)
Class of Workers - Federal government workers (%)
Class of Workers - Self-employed workers in own not incorporated business and Unpaid family workers (%)
House heating fuel used in houses and condos - Utility gas (%)
House heating fuel used in houses and condos - Bottled, tank, or LP gas (%)
House heating fuel used in houses and condos - Electricity (%)
House heating fuel used in houses and condos - Fuel oil, kerosene, etc. (%)
House heating fuel used in houses and condos - Coal or coke (%)
House heating fuel used in houses and condos - Wood (%)
House heating fuel used in houses and condos - Solar energy (%)
House heating fuel used in houses and condos - Other fuel (%)
House heating fuel used in houses and condos - No fuel used (%)
House heating fuel used in apartments - Utility gas (%)
House heating fuel used in apartments - Bottled, tank, or LP gas (%)
House heating fuel used in apartments - Electricity (%)
House heating fuel used in apartments - Fuel oil, kerosene, etc. (%)
House heating fuel used in apartments - Coal or coke (%)
House heating fuel used in apartments - Wood (%)
House heating fuel used in apartments - Solar energy (%)
House heating fuel used in apartments - Other fuel (%)
House heating fuel used in apartments - No fuel used (%)
Armed forces status - In Armed Forces (%)
Armed forces status - Civilian (%)
Armed forces status - Civilian - Veteran (%)
Armed forces status - Civilian - Nonveteran (%)
Fatal accidents locations in years 2005-2021
Fatal accidents locations in 2005
Fatal accidents locations in 2006
Fatal accidents locations in 2007
Fatal accidents locations in 2008
Fatal accidents locations in 2009
Fatal accidents locations in 2010
Fatal accidents locations in 2011
Fatal accidents locations in 2012
Fatal accidents locations in 2013
Fatal accidents locations in 2014
Fatal accidents locations in 2015
Fatal accidents locations in 2016
Fatal accidents locations in 2017
Fatal accidents locations in 2018
Fatal accidents locations in 2019
Fatal accidents locations in 2020
Fatal accidents locations in 2021
Alcohol use - People drinking some alcohol every month (%)
Alcohol use - People not drinking at all (%)
Alcohol use - Average days/month drinking alcohol
Alcohol use - Average drinks/week
Alcohol use - Average days/year people drink much
Audiometry - Average condition of hearing (%)
Audiometry - People that can hear a whisper from across a quiet room (%)
Audiometry - People that can hear normal voice from across a quiet room (%)
Audiometry - Ears ringing, roaring, buzzing (%)
Audiometry - Had a job exposure to loud noise (%)
Audiometry - Had off-work exposure to loud noise (%)
Blood Pressure & Cholesterol - Has high blood pressure (%)
Blood Pressure & Cholesterol - Checking blood pressure at home (%)
Blood Pressure & Cholesterol - Frequently checking blood cholesterol (%)
Blood Pressure & Cholesterol - Has high cholesterol level (%)
Consumer Behavior - Money monthly spent on food at supermarket/grocery store
Consumer Behavior - Money monthly spent on food at other stores
Consumer Behavior - Money monthly spent on eating out
Consumer Behavior - Money monthly spent on carryout/delivered foods
Consumer Behavior - Income spent on food at supermarket/grocery store (%)
Consumer Behavior - Income spent on food at other stores (%)
Consumer Behavior - Income spent on eating out (%)
Consumer Behavior - Income spent on carryout/delivered foods (%)
Current Health Status - General health condition (%)
Current Health Status - Blood donors (%)
Current Health Status - Has blood ever tested for HIV virus (%)
Current Health Status - Left-handed people (%)
Dermatology - People using sunscreen (%)
Diabetes - Diabetics (%)
Diabetes - Had a blood test for high blood sugar (%)
Diabetes - People taking insulin (%)
Diet Behavior & Nutrition - Diet health (%)
Diet Behavior & Nutrition - Milk product consumption (# of products/month)
Diet Behavior & Nutrition - Meals not home prepared (#/week)
Diet Behavior & Nutrition - Meals from fast food or pizza place (#/week)
Diet Behavior & Nutrition - Ready-to-eat foods (#/month)
Diet Behavior & Nutrition - Frozen meals/pizza (#/month)
Drug Use - People that ever used marijuana or hashish (%)
Drug Use - Ever used hard drugs (%)
Drug Use - Ever used any form of cocaine (%)
Drug Use - Ever used heroin (%)
Drug Use - Ever used methamphetamine (%)
Health Insurance - People covered by health insurance (%)
Kidney Conditions-Urology - Avg. # of times urinating at night
Medical Conditions - People with asthma (%)
Medical Conditions - People with anemia (%)
Medical Conditions - People with psoriasis (%)
Medical Conditions - People with overweight (%)
Medical Conditions - Elderly people having difficulties in thinking or remembering (%)
Medical Conditions - People who ever received blood transfusion (%)
Medical Conditions - People having trouble seeing even with glass/contacts (%)
Medical Conditions - People with arthritis (%)
Medical Conditions - People with gout (%)
Medical Conditions - People with congestive heart failure (%)
Medical Conditions - People with coronary heart disease (%)
Medical Conditions - People with angina pectoris (%)
Medical Conditions - People who ever had heart attack (%)
Medical Conditions - People who ever had stroke (%)
Medical Conditions - People with emphysema (%)
Medical Conditions - People with thyroid problem (%)
Medical Conditions - People with chronic bronchitis (%)
Medical Conditions - People with any liver condition (%)
Medical Conditions - People who ever had cancer or malignancy (%)
Mental Health - People who have little interest in doing things (%)
Mental Health - People feeling down, depressed, or hopeless (%)
Mental Health - People who have trouble sleeping or sleeping too much (%)
Mental Health - People feeling tired or having little energy (%)
Mental Health - People with poor appetite or overeating (%)
Mental Health - People feeling bad about themself (%)
Mental Health - People who have trouble concentrating on things (%)
Mental Health - People moving or speaking slowly or too fast (%)
Mental Health - People having thoughts they would be better off dead (%)
Oral Health - Average years since last visit a dentist
Oral Health - People embarrassed because of mouth (%)
Oral Health - People with gum disease (%)
Oral Health - General health of teeth and gums (%)
Oral Health - Average days a week using dental floss/device
Oral Health - Average days a week using mouthwash for dental problem
Oral Health - Average number of teeth
Pesticide Use - Households using pesticides to control insects (%)
Pesticide Use - Households using pesticides to kill weeds (%)
Physical Activity - People doing vigorous-intensity work activities (%)
Physical Activity - People doing moderate-intensity work activities (%)
Physical Activity - People walking or bicycling (%)
Physical Activity - People doing vigorous-intensity recreational activities (%)
Physical Activity - People doing moderate-intensity recreational activities (%)
Physical Activity - Average hours a day doing sedentary activities
Physical Activity - Average hours a day watching TV or videos
Physical Activity - Average hours a day using computer
Physical Functioning - People having limitations keeping them from working (%)
Physical Functioning - People limited in amount of work they can do (%)
Physical Functioning - People that need special equipment to walk (%)
Physical Functioning - People experiencing confusion/memory problems (%)
Physical Functioning - People requiring special healthcare equipment (%)
Prescription Medications - Average number of prescription medicines taking
Preventive Aspirin Use - Adults 40+ taking low-dose aspirin (%)
Reproductive Health - Vaginal deliveries (%)
Reproductive Health - Cesarean deliveries (%)
Reproductive Health - Deliveries resulted in a live birth (%)
Reproductive Health - Pregnancies resulted in a delivery (%)
Reproductive Health - Women breastfeeding newborns (%)
Reproductive Health - Women that had a hysterectomy (%)
Reproductive Health - Women that had both ovaries removed (%)
Reproductive Health - Women that have ever taken birth control pills (%)
Reproductive Health - Women taking birth control pills (%)
Reproductive Health - Women that have ever used Depo-Provera or injectables (%)
Reproductive Health - Women that have ever used female hormones (%)
Sexual Behavior - People 18+ that ever had sex (vaginal, anal, or oral) (%)
Sexual Behavior - Males 18+ that ever had vaginal sex with a woman (%)
Sexual Behavior - Males 18+ that ever performed oral sex on a woman (%)
Sexual Behavior - Males 18+ that ever had anal sex with a woman (%)
Sexual Behavior - Males 18+ that ever had any sex with a man (%)
Sexual Behavior - Females 18+ that ever had vaginal sex with a man (%)
Sexual Behavior - Females 18+ that ever performed oral sex on a man (%)
Sexual Behavior - Females 18+ that ever had anal sex with a man (%)
Sexual Behavior - Females 18+ that ever had any kind of sex with a woman (%)
Sexual Behavior - Average age people first had sex
Sexual Behavior - Average number of female sex partners in lifetime (males 18+)
Sexual Behavior - Average number of female vaginal sex partners in lifetime (males 18+)
Sexual Behavior - Average age people first performed oral sex on a woman (18+)
Sexual Behavior - Average number of woman performed oral sex on in lifetime (18+)
Sexual Behavior - Average number of male sex partners in lifetime (males 18+)
Sexual Behavior - Average number of male anal sex partners in lifetime (males 18+)
Sexual Behavior - Average age people first performed oral sex on a man (18+)
Sexual Behavior - Average number of male oral sex partners in lifetime (18+)
Sexual Behavior - People using protection when performing oral sex (%)
Sexual Behavior - Average number of times people have vaginal or anal sex a year
Sexual Behavior - People having sex without condom (%)
Sexual Behavior - Average number of male sex partners in lifetime (females 18+)
Sexual Behavior - Average number of male vaginal sex partners in lifetime (females 18+)
Sexual Behavior - Average number of female sex partners in lifetime (females 18+)
Sexual Behavior - Circumcised males 18+ (%)
Sleep Disorders - Average hours sleeping at night
Sleep Disorders - People that has trouble sleeping (%)
Smoking-Cigarette Use - People smoking cigarettes (%)
Taste & Smell - People 40+ having problems with smell (%)
Taste & Smell - People 40+ having problems with taste (%)
Taste & Smell - People 40+ that ever had wisdom teeth removed (%)
Taste & Smell - People 40+ that ever had tonsils teeth removed (%)
Taste & Smell - People 40+ that ever had a loss of consciousness because of a head injury (%)
Taste & Smell - People 40+ that ever had a broken nose or other serious injury to face or skull (%)
Taste & Smell - People 40+ that ever had two or more sinus infections (%)
Weight - Average height (inches)
Weight - Average weight (pounds)
Weight - Average BMI
Weight - People that are obese (%)
Weight - People that ever were obese (%)
Weight - People trying to lose weight (%)
Urban population: 21,653
Rural population: 12,168
Estimated median house/condo value in 2022: $271,929
76020:
$271,929Texas:
$275,400
Median resident age: This zip code:
40.5 yearsTexas median age:
35.6 years
Average household size: This zip code:
2.6 peopleTexas:
2.6 people
Averages for the 2020 tax year for zip code 76020, filed in 2021:
Average Adjusted Gross Income (AGI) in 2020: $71,857 (Individual Income Tax Returns) Here:
$71,857State:
$77,054
Salary/wage: $62,897 (reported on 82.1% of returns )Here:
$62,897State:
$62,766
(% of AGI for various income ranges: 1095.6% for AGIs below $25k , 3403.9% for AGIs $25k-50k , 6326.0% for AGIs $50k-75k , 8975.4% for AGIs $75k-100k , 16856.1% for AGIs $100k-200k , 60378.5% for AGIs over 200k ) Taxable interest for individuals: $1,664 (reported on 23.2% of returns )This zip code:
$1,664Texas:
$2,665
(% of AGI for various income ranges: 11.6% for AGIs below $25k , 20.1% for AGIs $25k-50k , 21.7% for AGIs $50k-75k , 53.0% for AGIs $75k-100k , 86.9% for AGIs $100k-200k , 954.1% for AGIs over 200k ) Ordinary dividends: $5,703 (reported on 13.1% of returns )(% of AGI for various income ranges: 15.1% for AGIs below $25k , 21.9% for AGIs $25k-50k , 44.8% for AGIs $50k-75k , 80.4% for AGIs $75k-100k , 126.6% for AGIs $100k-200k , 2456.7% for AGIs over 200k ) Net capital gain/loss in AGI: +$22,915 (reported on 12.8% of returns )Here:
+$22,915State:
+$39,590
(% of AGI for various income ranges: 6.4% for AGIs below $25k , 13.6% for AGIs $25k-50k , 36.3% for AGIs $50k-75k , 97.7% for AGIs $75k-100k , 373.3% for AGIs $100k-200k , 13901.9% for AGIs over 200k ) Profit/loss from business: +$9,869 (reported on 18.6% of returns )Here:
+$9,869State:
+$10,888
(% of AGI for various income ranges: 120.1% for AGIs below $25k , 122.4% for AGIs $25k-50k , 128.8% for AGIs $50k-75k , 108.2% for AGIs $75k-100k , 404.6% for AGIs $100k-200k , 3892.6% for AGIs over 200k ) Taxable individual retirement arrangement distribution: $23,379 (reported on 8.1% of returns )76020:
$23,379Texas:
$24,740
(% of AGI for various income ranges: 43.8% for AGIs below $25k , 79.6% for AGIs $25k-50k , 143.9% for AGIs $50k-75k , 285.8% for AGIs $75k-100k , 678.2% for AGIs $100k-200k , 3180.4% for AGIs over 200k ) Self-employed (Keogh) retirement plans: $32,200 (reported on 0.1% of returns )76020:
$32,200Texas:
$29,298
(% of AGI for various income ranges: 38.8% for AGIs $100k-200k ) Total itemized deductions: $36,391 (reported on 7.3% of returns )Here:
$36,391State:
$40,428
(% of AGI for various income ranges: 32.0% for AGIs below $25k , 93.4% for AGIs $25k-50k , 207.7% for AGIs $50k-75k , 379.0% for AGIs $75k-100k , 809.8% for AGIs $100k-200k , 5827.0% for AGIs over 200k ) Charity contributions: $12,621 (reported on 5.7% of returns )Here:
$12,621State:
$18,201
(% of AGI for various income ranges: 2.2% for AGIs below $25k , 16.0% for AGIs $25k-50k , 35.5% for AGIs $50k-75k , 85.3% for AGIs $75k-100k , 230.5% for AGIs $100k-200k , 1936.3% for AGIs over 200k ) Taxes paid: $7,361 (reported on 7.2% of returns )(% of AGI for various income ranges: 5.2% for AGIs below $25k , 16.9% for AGIs $25k-50k , 45.4% for AGIs $50k-75k , 87.4% for AGIs $75k-100k , 195.3% for AGIs $100k-200k , 922.2% for AGIs over 200k ) Earned income credit: $2,339 (reported on 16.4% of returns )(% of AGI for various income ranges: 100.2% for AGIs below $25k , 78.7% for AGIs $25k-50k , 1.7% for AGIs $50k-75k ) Percentage of individuals using paid preparers for their 2020 taxes: 93.6%(% for various income ranges: 93.2% for AGIs below $25k , 94.0% for AGIs $25k-50k , 94.3% for AGIs $50k-75k , 94.6% for AGIs $75k-100k , 92.9% for AGIs $100k-200k , 93.2% for AGIs over 200k )
Averages for the 2012 tax year for zip code 76020, filed in 2013:
Average Adjusted Gross Income (AGI) in 2012: $59,672 (Individual Income Tax Returns) Here:
$59,672State:
$65,384
Salary/wage: $53,472 (reported on 83.0% of returns )Here:
$53,472State:
$52,524
(% of AGI for various income ranges: 72.9% for AGIs below $25k , 79.5% for AGIs $25k-50k , 79.2% for AGIs $50k-75k , 79.4% for AGIs $75k-100k , 77.3% for AGIs $100k-200k , 59.8% for AGIs over 200k ) Taxable interest for individuals: $1,843 (reported on 27.3% of returns )This zip code:
$1,843Texas:
$2,372
(% of AGI for various income ranges: 1.2% for AGIs below $25k , 0.6% for AGIs $25k-50k , 0.4% for AGIs $50k-75k , 0.5% for AGIs $75k-100k , 0.6% for AGIs $100k-200k , 1.8% for AGIs over 200k ) Ordinary dividends: $3,923 (reported on 13.9% of returns )(% of AGI for various income ranges: 0.7% for AGIs below $25k , 0.6% for AGIs $25k-50k , 0.5% for AGIs $50k-75k , 0.5% for AGIs $75k-100k , 0.7% for AGIs $100k-200k , 2.2% for AGIs over 200k ) Net capital gain/loss in AGI: +$16,446 (reported on 11.4% of returns )Here:
+$16,446State:
+$35,319
(% of AGI for various income ranges: 0.2% for AGIs $25k-50k , 0.2% for AGIs $50k-75k , 0.4% for AGIs $75k-100k , 1.4% for AGIs $100k-200k , 13.4% for AGIs over 200k ) Profit/loss from business: +$10,659 (reported on 18.6% of returns )Here:
+$10,659State:
+$13,732
(% of AGI for various income ranges: 10.6% for AGIs below $25k , 4.1% for AGIs $25k-50k , 2.2% for AGIs $50k-75k , 1.4% for AGIs $75k-100k , 2.9% for AGIs $100k-200k , 2.9% for AGIs over 200k ) Taxable individual retirement arrangement distribution: $15,558 (reported on 9.2% of returns )76020:
$15,558Texas:
$19,511
(% of AGI for various income ranges: 2.3% for AGIs below $25k , 2.1% for AGIs $25k-50k , 2.4% for AGIs $50k-75k , 2.8% for AGIs $75k-100k , 2.8% for AGIs $100k-200k , 1.7% for AGIs over 200k ) Self-employment retirement plans: $25,667 (reported on 0.3% of returns )76020:
$25,667Texas:
$23,938
Total itemized deductions: $21,500 (19% of AGI, reported on 26.9% of returns )Here:
$21,500State:
$24,724
Here:
18.7% of AGIState:
15.9% of AGI
(% of AGI for various income ranges: 8.2% for AGIs below $25k , 8.5% for AGIs $25k-50k , 10.0% for AGIs $50k-75k , 10.3% for AGIs $75k-100k , 11.5% for AGIs $100k-200k , 7.9% for AGIs over 200k ) Charity contributions: $5,300 (reported on 20.5% of returns )(% of AGI for various income ranges: 0.7% for AGIs below $25k , 1.1% for AGIs $25k-50k , 1.3% for AGIs $50k-75k , 1.6% for AGIs $75k-100k , 2.3% for AGIs $100k-200k , 2.6% for AGIs over 200k ) Taxes paid: $5,745 (reported on 26.3% of returns )(% of AGI for various income ranges: 1.6% for AGIs below $25k , 1.7% for AGIs $25k-50k , 2.2% for AGIs $50k-75k , 2.6% for AGIs $75k-100k , 3.4% for AGIs $100k-200k , 2.3% for AGIs over 200k ) Earned income credit: $2,283 (reported on 19.4% of returns )(% of AGI for various income ranges: 7.5% for AGIs below $25k , 1.3% for AGIs $25k-50k ) Percentage of individuals using paid preparers for their 2012 taxes: 50.6%(% for various income ranges: 48.0% for AGIs below $25k , 49.0% for AGIs $25k-50k , 51.1% for AGIs $50k-75k , 54.2% for AGIs $75k-100k , 52.3% for AGIs $100k-200k , 71.9% for AGIs over 200k )
Averages for the 2004 tax year for zip code 76020, filed in 2005:
Average Adjusted Gross Income (AGI) in 2004: $45,435 (Individual Income Tax Returns) Here:
$45,435State:
$47,881
Salary/wage: $42,662 (reported on 85.8% of returns )Here:
$42,662State:
$41,947
(% of AGI for various income ranges: 147.7% for AGIs below $10k , 77.2% for AGIs $10k-25k , 85.7% for AGIs $25k-50k , 84.6% for AGIs $50k-75k , 84.8% for AGIs $75k-100k , 70.8% for AGIs over 100k ) Taxable interest for individuals: $1,567 (reported on 34.7% of returns )This zip code:
$1,567Texas:
$2,255
(% of AGI for various income ranges: 5.2% for AGIs below $10k , 1.7% for AGIs $10k-25k , 0.9% for AGIs $25k-50k , 0.7% for AGIs $50k-75k , 1.1% for AGIs $75k-100k , 1.5% for AGIs over 100k ) Taxable dividends: $2,545 (reported on 16.5% of returns )(% of AGI for various income ranges: 3.3% for AGIs below $10k , 0.7% for AGIs $10k-25k , 0.4% for AGIs $25k-50k , 0.4% for AGIs $50k-75k , 0.5% for AGIs $75k-100k , 1.8% for AGIs over 100k ) Net capital gain/loss: +$10,228 (reported on 14.5% of returns )Here:
+$10,228State:
+$16,110
(% of AGI for various income ranges: -1.9% for AGIs below $10k , 0.4% for AGIs $10k-25k , 0.4% for AGIs $25k-50k , 0.9% for AGIs $50k-75k , 1.5% for AGIs $75k-100k , 8.5% for AGIs over 100k ) Profit/loss from business: +$7,612 (reported on 19.3% of returns )Here:
+$7,612State:
+$11,013
(% of AGI for various income ranges: -0.3% for AGIs below $10k , 7.3% for AGIs $10k-25k , 2.2% for AGIs $25k-50k , 2.5% for AGIs $50k-75k , 1.4% for AGIs $75k-100k , 4.4% for AGIs over 100k ) IRA payment deduction: $3,005 (reported on 2.2% of returns )(% of AGI for various income ranges: 0.2% for AGIs $10k-25k , 0.1% for AGIs $25k-50k , 0.2% for AGIs $50k-75k , 0.2% for AGIs $75k-100k , 0.1% for AGIs over 100k ) Self-employed pension: $10,711 (reported on 0.4% of returns )Here:
$10,711Texas:
$16,401
Total itemized deductions: $17,242 (21% of AGI, reported on 26.9% of returns )Here:
$17,242State:
$19,631
Here:
20.9% of AGIState:
18.9% of AGI
(% of AGI for various income ranges: 15.8% for AGIs below $10k , 6.8% for AGIs $10k-25k , 8.9% for AGIs $25k-50k , 10.4% for AGIs $50k-75k , 12.0% for AGIs $75k-100k , 10.8% for AGIs over 100k ) Charity contributions deductions: $3,689 (4% of AGI, reported on 21.4% of returns )Here:
4.1% of AGIState:
4.2% of AGI
(% of AGI for various income ranges: 1.3% for AGIs below $10k , 0.8% for AGIs $10k-25k , 1.0% for AGIs $25k-50k , 1.5% for AGIs $50k-75k , 2.2% for AGIs $75k-100k , 2.4% for AGIs over 100k ) Total tax: $6,744 (reported on 75.7% of returns )(% of AGI for various income ranges: 5.2% for AGIs below $10k , 4.2% for AGIs $10k-25k , 6.4% for AGIs $25k-50k , 9.0% for AGIs $50k-75k , 10.6% for AGIs $75k-100k , 18.2% for AGIs over 100k ) Earned income credit: $1,813 (reported on 18.1% of returns )Percentage of individuals using paid preparers for their 2004 taxes: 55.4%(% for various income ranges: 48.5% for AGIs below $10k , 59.5% for AGIs $10k-25k , 57.3% for AGIs $25k-50k , 55.5% for AGIs $50k-75k , 52.1% for AGIs $75k-100k , 58.3% for AGIs over 100k )
Estimated median household income in 2022: This zip code:
$87,019Texas:
$72,284
Nearest zip codes: 76135 ,
76108 ,
76179 ,
76085 ,
76023 ,
76071 .
Weatherford Zip Code Map
Percentage of family households: This zip code:
57.6%Texas:
50.5%
Percentage of households with unmarried partners: This zip code:
3.3%Texas:
48.7%
Likely homosexual households (counted as self-reported same-sex unmarried-partner households)
Lesbian couples: 0.3% of all households Gay men: 0.1% of all households
Household received Food Stamps/SNAP in the past 12 months: 1,120Household did not receive Food Stamps/SNAP in the past 12 months: 11,682
Women who had a birth in the past 12 months: 540 (321 now married , 216 unmarried) Women who did not have a birth in the past 12 months: 7,216 (3,970 now married , 3,220 unmarried)
Housing units in zip code 76020 with a mortgage: 5,951 (196
second mortgage , 51
home equity loan , 130
both second mortgage and home equity loan )
Houses without a mortgage: 22
Median monthly owner costs for units with a mortgage: $1,751
Median monthly owner costs for units without a mortgage: $613
Residents with income below the poverty level in 2022:
This zip code:
9.7%Whole state:
14.0%
Residents with income below 50% of the poverty level in 2022:
This zip code:
6.1%Whole state:
7.4%
Median number of rooms in houses and condos: Median number of rooms in apartments: Notable locations in this zip code not listed on our city pages
Click to draw/clear zip code borders Notable locations in zip code 76020: (A) , City of Pelican Bay Volunteer Fire and Rescue (B) , Azle Fire Department (C) , Azle Historical Museum (D) , Reno Volunteer Fire Department (E) , Briar Volunteer Fire Department (F) , North Texas Emergency Medical Service (G) . Display/hide their locations on the map
Churches in zip code 76020 include: (A) , Silver Creek Church (B) , Wesley Chapel (C) , Ash Creek Church (D) , Bluff Springs Church (E) , Holy Trinity Catholic Church (F) , Trinity Baptist Church (G) , Azle Church of Christ (H) , West Parkway Baptist Church (I) . Display/hide their locations on the map
Cemeteries: (1) , Nelson Cemetery (2) , Reynolds Cemetery (3) . Display/hide their locations on the map
Reservoir: (A) . Display/hide its location on the map
Streams, rivers, and creeks: (A) , Walnut Creek (B) , Reynolds Branch (C) , Little Silver Creek (D) , Cottonwood Branch (E) , Briar Creek (F) , Ash Creek (G) . Display/hide their locations on the map
Parks in zip code 76020 include: (1) , Azle City Park (2) , Ash Creek Park (3) . Display/hide their locations on the map
Year house built (houses)
292 2020 or later2,575 2010 to 20191,911 2000 to 20091,625 1990 to 19992,831 1980 to 19892,082 1970 to 19791,373 1960 to 1969724 1950 to 1959136 1940 to 1949202 1939 or earlier
Zip code 76020 household income distribution in 2022 418 Less than $10,000404 $10,000 to $14,999449 $15,000 to $19,999349 $20,000 to $24,999501 $25,000 to $29,999440 $30,000 to $34,999277 $35,000 to $39,999406 $40,000 to $44,999295 $45,000 to $49,999767 $50,000 to $59,9991,069 $60,000 to $74,9992,014 $75,000 to $99,9991,994 $100,000 to $124,9991,059 $125,000 to $149,9991,086 $150,000 to $199,9991,226 $200,000 or moreEstimate of home value of owner-occupied houses/condos in 2022 in zip code 76020 204 Less than $10,00069 $10,000 to $14,99922 $15,000 to $19,999243 $20,000 to $24,99946 $25,000 to $29,99929 $30,000 to $34,99932 $35,000 to $39,99918 $40,000 to $49,999105 $50,000 to $59,99938 $60,000 to $69,99964 $70,000 to $79,999178 $80,000 to $89,999158 $90,000 to $99,999392 $100,000 to $124,999282 $125,000 to $149,999598 $150,000 to $174,999645 $175,000 to $199,9991,723 $200,000 to $249,9991,167 $250,000 to $299,9991,056 $300,000 to $399,9991,460 $400,000 to $499,9991,471 $500,000 to $749,99949 $750,000 to $999,99928 $1,000,000 to $1,499,9995 $1,500,000 to $1,999,999101 $2,000,000 or moreRent paid by renters in 2022 in zip code 76020 20 Less than $10036 $100 to $14958 $150 to $19982 $200 to $2499 $250 to $299186 $300 to $3491 $350 to $39938 $400 to $44944 $450 to $49986 $500 to $54959 $550 to $59917 $600 to $64970 $650 to $69997 $700 to $74957 $750 to $799273 $800 to $899254 $900 to $999344 $1,000 to $1,249203 $1,250 to $1,499280 $1,500 to $1,99911 $3,500 or more213 No cash rent
Median gross rent in 2022: $1,149.
Median price asked for vacant for-sale houses and condos in 2022: $335,460.
Estimated median house (or condo) value in 2022 for: White Non-Hispanic householders: $294,788American Indian or Alaska Native householders: $618,577Asian householders: $218,361Some other race householders: $316,624Two or more races householders: $236,103Hispanic or Latino householders: $293,423Estimated median house or condo value in 2022: $271,929
76020:
$271,929Texas:
$275,400
Lower value quartile - upper value quartile: $187,007 - $448,410
Mean price in 2022: Detached houses: $281,667Here:
$281,667State:
$369,058
Townhouses or other attached units: $347,027Here:
$347,027State:
$327,631
Mobile homes: $117,813Here:
$117,813State:
$124,413
Housing units in structures:
One, detached: 10,446One, attached: 201Two: 2493 or 4: 2805 to 9: 16610 to 19: 6920 to 49: 9550 or more: 121Mobile homes: 2,325Boats, RVs, vans, etc.: 91Unemployment : 3.1%
Means of transportation to work in zip code 76020 72.7% 12,138 Drove a car alone9.8% 1,643 Carpooled0.0% 6 Motorcycle0.1% 20 Bicycle1.0% 175 Walked1.4% 235 Other means14.9% 2,486 Worked at homeTravel time to work (commute) in zip code 76020 159 Less than 5 minutes891 5 to 9 minutes1,333 10 to 14 minutes516 15 to 19 minutes1,476 20 to 24 minutes802 25 to 29 minutes3,389 30 to 34 minutes970 35 to 39 minutes940 40 to 44 minutes2,150 45 to 59 minutes1,123 60 to 89 minutes460 90 or more minutes
Percentage of zip code residents living and working in this county: 59.1%
Household type by relationship:
Households: 33,822
Male householders: 6,152 (944 living alone ), Female householders: 6,675 (1,646 living alone )7,696 spouses (7,683 opposite-sex spouses ), 621 unmarried partners , (596 opposite-sex unmarried partners ), 9,627 children (8,687 natural , 169 adopted , 773 stepchildren ), 1,005 grandchildren , 293 brothers or sisters , 318 parents , 0 foster children , 434 other relatives , 834 non-relatives In group quarters: 226 (-1 institutionalized population )
Size of family households: 4,791 2-persons , 2,021 3-persons , 1,840 4-persons , 891 5-persons , 188 6-persons , 88 7-or-more-persons
Size of nonfamily households: 2,589 1-person , 371 2-persons , 17 3-persons
5,250 married couples with children. single-parent households (593 men , 1,118 women ).
89.3% of residents of 76020 zip code speak English at home. of residents speak Spanish at home (69% very well, 16% well, 5% not well, 10% not at all ).of residents speak other Indo-European language at home (56% very well, 44% well ).of residents speak Asian or Pacific Island language at home (34% very well, 66% well ).
Foreign born population: 1,717 (5.1%)
(50.8%
of them are naturalized citizens )
This zip code:
5.1%Whole state:
17.2%
65% Honduras 12% Guatemala 5% Singapore 5% Costa Rica 3% North Macedonia (Macedonia) 2% Barbados 1% France 21% English 17% American 9% German 7% Irish 1% Italian 1% European 1% French
Year of entry for the foreign-born population
604 2010 or later 566 2000 to 2009 439 1990 to 1999 413 Before 1990
Facilities with environmental interests located in this zip code:
AZLE CITY OF WATER PLANT (1500 LAKEVIEW DRIVE in AZLE, TX)
(Integrated Compliance Information System) - ICIS-06-2006-3531, ENFORCEMENT/COMPLIANCE ACTIVITY FORMAL ENFORCEMENT ACTION (Integrated Compliance Information System) - ICIS-06-2006-3531, ENFORCEMENT/COMPLIANCE ACTIVITY Alternative names: AZLE WATER PLANT
AZLE EL (301 CHURCH ST in AZLE, TX)
(National Center for Education Statistics) - STATE ID-220915104 Organizations: AZLE ISD (SCHOOL DISTRICT)
AZLE H S (1200 BOYD RD in AZLE, TX)
(National Center for Education Statistics) - STATE ID-220915001 Organizations: AZLE ISD (SCHOOL DISTRICT)
AZLE J H SOUTH (201 SCHOOL ST in AZLE, TX)
(National Center for Education Statistics) - STATE ID-220915041 Organizations: AZLE ISD (SCHOOL DISTRICT)
AZLE PLANT (1110 S E PARKWAY in AZLE, TX)
National Pollutant Discharge Elimination System NON-MAJOR (Tracking pollutant discharge elimination systems) - permit Business SIC classification: READY-MIXED CONCRETEOrganizations: BEALL INDUSTRIES (CONTACT/OWNER)
Alternative names: BEALL INDUSTRIES, PARADIGM ENGINEERING
AZLE LPST SITE (100 NE PKWY (NW CORENER OF HWY in AZLE, TX)
National Pollutant Discharge Elimination System NON-MAJOR (Tracking pollutant discharge elimination systems) - permit Business SIC classification: NONCLASSIFIABLE ESTABLISHMENTSOrganizations: EA ENGINEERING, SCIENCE, & (CONTACT/OWNER)
Alternative names: EA ENGINEERING, SCIENCE, AND
Housing units lacking complete plumbing facilities: 1.9%
Housing units lacking complete kitchen facilities: 2.9%
84.8% Electricity 7.0% Utility gas 6.6% Bottled, tank, or LP gas 0.9% No fuel used 0.6% Wood
Population in 1990: 18,198. Population change in the 1990s: +5,105 (+28.1%).
Place of birth for U.S.-born residents:
This state: 21,508Northeast: 1,281Midwest: 2,914South: 2,861West: 3,225
55% of the 76020 zip code residents lived in the same house 5 years ago.
Out of people who lived in different houses, 45% lived in this county.
Out of people who lived in different counties, 50% lived in Texas.
89% of the 76020 zip code residents lived in the same house 1 year ago.
Out of people who lived in different houses, 33% moved from this county.
Out of people who lived in different houses, 53% moved from different county within same state.
Out of people who lived in different houses, 15% moved from different state.
Out of people who lived in different houses, 1% moved from abroad.
Private vs. public school enrollment:
Students in private schools in grades 1 to 8 (elementary and middle school): 470
Students in private schools in grades 9 to 12 (high school): 209
Students in private undergraduate colleges: 167
Occupation by median earnings in the past 12 months ($)
177,344 Architecture and engineering occupations 89,134 Life, physical, and social science occupations 75,961 Computer and mathematical occupations 69,448 Business and financial operations occupations 69,063 Management occupations 64,770 Law enforcement workers including supervisors
Companies with federal contracts located in this zip code (AZLE, TX):
SC ELECTRONICS INC (200 COMMERCE ST; small business) in 15 contracts from 1999 to 2005
Contracts for Miscellaneous Electrical and Electronic Components, Converters, Electrical, Nonrotating, Radar Equipment, Airborne, Miscellaneous Communication Equipment by Navy, Air Force, Defense Logistics Agency, Army, and others Signed by year: 2000: $0; 2001: $760,404; 2002: $90,000; 2003: $144,140; 2004: $304,704; 2005: $1,506,282; 2006: $0.
Biggest contracts: with Navy for Miscellaneous Electrical and Electronic Components. Signed on 2005-06-09. Completion date: 2005-12-30.
with Air Force for Converters, Electrical, Nonrotating. Signed on 2001-09-27. Completion date: 2002-09-30.
, same as above. Signed on 2001-09-28. Completion date: 2004-12-31.
with Air Force for Radar Equipment, Airborne. Signed on 2004-09-28. Completion date: 2006-01-31.
CLARKS GUNS & AMMO (636 PROFIT ST; small business) in 16 contracts from 2000 to 2006
Contracts for Aircraft Maintenance and Repair Shop Specialized Equipment, Aircraft Ground Servicing Equipment, Miscellaneous Aircraft Accessories and Components by Air Force, Navy, Defense Logistics AgencySigned by year: 2000: $58,255; 2001: $149,971; 2002: $164,330; 2003: $29,176; 2004: $56,752; 2005: $11,372; 2006: $9,247.
Biggest contracts: with Air Force for Aircraft Maintenance and Repair Shop Specialized Equipment. Signed on 2002-07-08. Completion date: 2003-01-31.
, same as above. Signed on 2001-04-24. Completion date: 2001-12-31.
, same as above. Signed on 2004-08-10. Completion date: 2005-04-30.
, same as above. Signed on 2002-05-02. Completion date: 2003-01-01.
EML ASSOCIATES LLC (12030 OAK ST STE 301; small business)
$43,000 with Navy for Aircraft, Fixed Wing. Signed on 2004-06-15. Completion date: 2004-12-31.
TALTEC ENGINEERING (713 WILLIAM RD; small business) in 3 contracts from 2005 to 2006
$4,090 with Defense Logistics Agency for Hardware, Commercial. Signed on 2005-04-13. Completion date: 2005-05-24.
, same as above. Signed on 2005-06-23. Completion date: 2005-08-08.
, same as above. Signed on 2006-03-22. Completion date: 2006-05-28.
DIAMOND FOOD MARKETS INC (150 INDUSTRIAL AVE STE 210; small business)
$2,701 with Army for Food Services. Signed on 2003-11-14. Completion date: 2003-11-15.
Top industries in this zip code by the number of employees in 2005:
Accommodation and Food Services: Limited-Service Restaurants (20-49 employees: 8 establishments, 10-19 employees: 3 establishments, 5-9 employees: 2 establishments, 1-4 employees: 5 establishments)Health Care and Social Assistance: Nursing Care Facilities (100-249: 1)Health Care and Social Assistance: General Medical and Surgical Hospitals (100-249: 1)Finance and Insurance: Commercial Banking (50-99: 1, 10-19: 1, 5-9: 4, 1-4: 1)Other Services (except Public Administration): Religious Organizations (20-49: 1, 10-19: 2, 5-9: 5, 1-4: 8)Construction: Electrical Contractors (20-49: 2, 10-19: 2, 5-9: 2, 1-4: 2)Accommodation and Food Services: Full-Service Restaurants (20-49: 1, 10-19: 2, 5-9: 3, 1-4: 3)Health Care and Social Assistance: Child Day Care Services (20-49: 1, 10-19: 2, 5-9: 1, 1-4: 3)
People in group quarters in 2010:
177 people in nursing facilities/skilled-nursing facilities
127 people in state prisons
50 people in group homes intended for adults
6 people in workers' group living quarters and job corps centers
People in group quarters in 2000:
128 people in nursing homes
16 people in schools, hospitals, or wards for the intellectually disabled
12 people in homes for the mentally retarded
Fatal accident statistics in 2014:
Fatal accident count: 3Vehicles involved in fatal accidents: 5Fatal accidents caused by drunken drivers: 0Fatalities: 3Persons involved in fatal accidents: 10Pedestrians involved in fatal accidents: 0
Fatal accident statistics in 2013:
Fatal accident count: 2Vehicles involved in fatal accidents: 2Fatal accidents caused by drunken drivers: 0Fatalities: 2Persons involved in fatal accidents: 2Pedestrians involved in fatal accidents: 1
Home Mortgage Disclosure Act Aggregated Statistics For Year 2009(Based on 6 full and 6 partial tracts) A) FHA, FSA/RHS & VA B) Conventional C) Refinancings D) Home Improvement Loans F) Non-occupant Loans on G) Loans On Manufactured Number Average Value Number Average Value Number Average Value Number Average Value Number Average Value Number Average Value
LOANS ORIGINATED 230 $141,053 241 $153,745 627 $173,126 74 $63,587 106 $120,623 45 $51,116 APPLICATIONS APPROVED, NOT ACCEPTED 19 $134,175 22 $82,227 60 $146,760 5 $15,900 9 $59,214 10 $52,523 APPLICATIONS DENIED 55 $109,018 53 $163,727 254 $162,388 106 $32,813 21 $111,006 38 $42,829 APPLICATIONS WITHDRAWN 39 $138,295 26 $143,002 190 $150,699 21 $56,004 16 $130,952 18 $82,493 FILES CLOSED FOR INCOMPLETENESS 18 $113,607 8 $156,258 36 $147,680 10 $48,662 5 $125,338 7 $62,159
Aggregated Statistics For Year 2008(Based on 6 full and 6 partial tracts) A) FHA, FSA/RHS & VA B) Conventional C) Refinancings D) Home Improvement Loans E) Loans on Dwellings For 5+ Families F) Non-occupant Loans on G) Loans On Manufactured Number Average Value Number Average Value Number Average Value Number Average Value Number Average Value Number Average Value Number Average Value
LOANS ORIGINATED 306 $125,593 426 $148,817 362 $150,513 135 $41,027 2 $649,740 135 $109,758 76 $82,832 APPLICATIONS APPROVED, NOT ACCEPTED 12 $125,285 53 $114,716 58 $134,590 20 $30,611 0 $0 11 $99,451 16 $59,539 APPLICATIONS DENIED 67 $115,582 80 $109,397 313 $133,974 174 $35,597 2 $574,770 45 $134,757 61 $58,861 APPLICATIONS WITHDRAWN 22 $134,650 47 $172,251 150 $128,018 10 $65,296 0 $0 14 $67,417 8 $85,618 FILES CLOSED FOR INCOMPLETENESS 5 $127,604 11 $144,095 38 $133,778 7 $27,864 2 $499,800 4 $90,545 3 $69,407
Aggregated Statistics For Year 2007(Based on 6 full and 6 partial tracts) A) FHA, FSA/RHS & VA B) Conventional C) Refinancings D) Home Improvement Loans E) Loans on Dwellings For 5+ Families F) Non-occupant Loans on G) Loans On Manufactured Number Average Value Number Average Value Number Average Value Number Average Value Number Average Value Number Average Value Number Average Value
LOANS ORIGINATED 213 $122,927 768 $135,524 446 $134,717 180 $37,635 1 $299,630 172 $118,443 113 $85,570 APPLICATIONS APPROVED, NOT ACCEPTED 18 $90,760 113 $115,116 72 $145,628 27 $37,240 0 $0 24 $113,160 27 $53,044 APPLICATIONS DENIED 28 $97,415 256 $109,818 517 $121,306 203 $41,880 0 $0 113 $108,246 125 $58,004 APPLICATIONS WITHDRAWN 26 $114,291 97 $155,374 248 $123,619 29 $63,055 0 $0 18 $160,073 16 $66,382 FILES CLOSED FOR INCOMPLETENESS 6 $131,353 30 $139,183 63 $171,041 12 $27,452 0 $0 0 $0 5 $111,000
Aggregated Statistics For Year 2006(Based on 6 full and 6 partial tracts) A) FHA, FSA/RHS & VA B) Conventional C) Refinancings D) Home Improvement Loans E) Loans on Dwellings For 5+ Families F) Non-occupant Loans on G) Loans On Manufactured Number Average Value Number Average Value Number Average Value Number Average Value Number Average Value Number Average Value Number Average Value
LOANS ORIGINATED 192 $112,704 1,188 $111,568 454 $121,394 158 $42,910 1 $2,182,070 241 $99,092 108 $68,225 APPLICATIONS APPROVED, NOT ACCEPTED 12 $104,894 190 $113,006 82 $111,984 31 $60,473 0 $0 66 $97,410 38 $54,672 APPLICATIONS DENIED 15 $96,004 371 $98,291 490 $116,933 208 $36,504 1 $1,921,820 102 $112,132 85 $54,618 APPLICATIONS WITHDRAWN 19 $106,914 150 $114,324 318 $114,489 14 $47,030 0 $0 45 $111,486 7 $95,474 FILES CLOSED FOR INCOMPLETENESS 1 $40,860 28 $144,789 148 $128,848 9 $42,323 0 $0 16 $123,550 0 $0
Aggregated Statistics For Year 2005(Based on 6 full and 6 partial tracts) A) FHA, FSA/RHS & VA B) Conventional C) Refinancings D) Home Improvement Loans E) Loans on Dwellings For 5+ Families F) Non-occupant Loans on G) Loans On Manufactured Number Average Value Number Average Value Number Average Value Number Average Value Number Average Value Number Average Value Number Average Value
LOANS ORIGINATED 210 $98,629 1,087 $110,174 664 $120,594 171 $71,941 1 $615,230 244 $98,736 143 $69,696 APPLICATIONS APPROVED, NOT ACCEPTED 13 $94,588 121 $87,152 111 $117,609 34 $32,954 0 $0 26 $115,301 31 $57,616 APPLICATIONS DENIED 45 $96,181 425 $78,780 566 $113,878 202 $44,331 0 $0 88 $77,868 204 $57,835 APPLICATIONS WITHDRAWN 21 $94,138 176 $102,936 507 $116,628 56 $251,118 0 $0 47 $137,162 18 $51,039 FILES CLOSED FOR INCOMPLETENESS 4 $115,740 53 $110,496 119 $135,176 3 $136,150 0 $0 10 $119,056 4 $100,262
Aggregated Statistics For Year 2004(Based on 6 full and 6 partial tracts) A) FHA, FSA/RHS & VA B) Conventional C) Refinancings D) Home Improvement Loans F) Non-occupant Loans on G) Loans On Manufactured Number Average Value Number Average Value Number Average Value Number Average Value Number Average Value Number Average Value
LOANS ORIGINATED 246 $100,268 776 $109,999 900 $108,201 173 $45,169 191 $76,122 125 $71,005 APPLICATIONS APPROVED, NOT ACCEPTED 6 $111,060 131 $81,405 143 $98,175 26 $37,429 13 $114,468 34 $49,304 APPLICATIONS DENIED 46 $101,614 239 $82,719 729 $94,049 209 $33,680 32 $65,014 133 $51,505 APPLICATIONS WITHDRAWN 24 $92,260 111 $108,904 470 $103,514 15 $76,309 29 $108,948 31 $66,812 FILES CLOSED FOR INCOMPLETENESS 1 $117,270 41 $84,273 226 $105,719 7 $55,451 9 $122,102 0 $0
Aggregated Statistics For Year 2003(Based on 6 full and 6 partial tracts) A) FHA, FSA/RHS & VA B) Conventional C) Refinancings D) Home Improvement Loans E) Loans on Dwellings For 5+ Families F) Non-occupant Loans on Number Average Value Number Average Value Number Average Value Number Average Value Number Average Value Number Average Value
LOANS ORIGINATED 235 $96,463 720 $103,835 1,707 $111,860 189 $26,987 1 $661,570 235 $90,411 APPLICATIONS APPROVED, NOT ACCEPTED 16 $85,960 90 $92,213 247 $107,778 42 $28,399 0 $0 25 $142,489 APPLICATIONS DENIED 32 $76,420 266 $79,047 754 $90,395 155 $24,709 0 $0 55 $100,989 APPLICATIONS WITHDRAWN 37 $89,693 88 $117,607 513 $95,739 11 $28,597 0 $0 29 $123,045 FILES CLOSED FOR INCOMPLETENESS 5 $74,196 32 $89,387 88 $90,243 5 $75,854 0 $0 11 $69,799
Aggregated Statistics For Year 2002(Based on 6 full tracts) A) FHA, FSA/RHS & VA B) Conventional C) Refinancings D) Home Improvement Loans E) Loans on Dwellings For 5+ Families F) Non-occupant Loans on Number Average Value Number Average Value Number Average Value Number Average Value Number Average Value Number Average Value
LOANS ORIGINATED 181 $96,925 344 $103,620 583 $101,877 116 $27,800 2 $149,820 100 $108,224 APPLICATIONS APPROVED, NOT ACCEPTED 16 $94,612 46 $71,192 98 $77,103 16 $29,130 0 $0 8 $70,554 APPLICATIONS DENIED 20 $94,664 131 $65,268 247 $80,870 44 $15,340 0 $0 24 $50,030 APPLICATIONS WITHDRAWN 8 $100,936 62 $100,297 209 $84,545 2 $59,930 0 $0 4 $83,900 FILES CLOSED FOR INCOMPLETENESS 2 $124,740 16 $83,820 44 $116,277 0 $0 0 $0 2 $175,790
Aggregated Statistics For Year 2001(Based on 6 full tracts) A) FHA, FSA/RHS & VA B) Conventional C) Refinancings D) Home Improvement Loans E) Loans on Dwellings For 5+ Families F) Non-occupant Loans on Number Average Value Number Average Value Number Average Value Number Average Value Number Average Value Number Average Value
LOANS ORIGINATED 163 $92,731 425 $97,380 432 $97,495 123 $22,353 2 $349,580 64 $77,387 APPLICATIONS APPROVED, NOT ACCEPTED 10 $109,470 46 $65,413 56 $97,297 22 $24,217 0 $0 4 $86,120 APPLICATIONS DENIED 20 $79,762 235 $51,917 169 $80,377 48 $28,053 0 $0 36 $62,365 APPLICATIONS WITHDRAWN 12 $91,527 50 $91,053 125 $95,223 8 $19,935 0 $0 2 $6,930 FILES CLOSED FOR INCOMPLETENESS 6 $86,345 20 $62,942 42 $109,000 0 $0 0 $0 2 $50,490
Aggregated Statistics For Year 2000(Based on 6 full tracts) A) FHA, FSA/RHS & VA B) Conventional C) Refinancings D) Home Improvement Loans F) Non-occupant Loans on Number Average Value Number Average Value Number Average Value Number Average Value Number Average Value
LOANS ORIGINATED 165 $87,435 362 $81,203 169 $87,195 100 $23,627 52 $55,009 APPLICATIONS APPROVED, NOT ACCEPTED 14 $60,515 86 $68,173 38 $81,579 46 $15,553 6 $93,265 APPLICATIONS DENIED 30 $59,333 219 $48,886 74 $68,582 97 $16,879 14 $57,926 APPLICATIONS WITHDRAWN 14 $84,175 40 $88,703 76 $72,533 6 $25,510 6 $50,967 FILES CLOSED FOR INCOMPLETENESS 2 $140,580 26 $70,721 36 $85,363 2 $19,975 2 $31,985
Aggregated Statistics For Year 1999(Based on 3 full and 2 partial tracts) A) FHA, FSA/RHS & VA B) Conventional C) Refinancings D) Home Improvement Loans E) Loans on Dwellings For 5+ Families F) Non-occupant Loans on Number Average Value Number Average Value Number Average Value Number Average Value Number Average Value Number Average Value
LOANS ORIGINATED 102 $79,074 384 $73,941 236 $81,823 82 $18,164 1 $806,010 48 $47,235 APPLICATIONS APPROVED, NOT ACCEPTED 4 $78,280 165 $52,466 73 $64,636 26 $16,921 0 $0 16 $46,636 APPLICATIONS DENIED 9 $63,287 491 $49,117 131 $67,562 80 $14,720 0 $0 25 $49,070 APPLICATIONS WITHDRAWN 9 $70,391 53 $77,728 92 $71,718 7 $19,520 0 $0 5 $54,354 FILES CLOSED FOR INCOMPLETENESS 1 $67,030 5 $137,760 31 $74,641 0 $0 0 $0 5 $66,552
Private Mortgage Insurance Companies Aggregated Statistics For Year 2009(Based on 6 full and 6 partial tracts) A) Conventional B) Refinancings C) Non-occupant Loans on Number Average Value Number Average Value Number Average Value
LOANS ORIGINATED 37 $219,767 20 $210,458 0 $0 APPLICATIONS APPROVED, NOT ACCEPTED 9 $215,844 11 $208,995 2 $22,990 APPLICATIONS DENIED 4 $258,702 5 $188,812 0 $0 APPLICATIONS WITHDRAWN 4 $180,495 2 $420,670 0 $0 FILES CLOSED FOR INCOMPLETENESS 5 $129,930 0 $0 2 $76,910
Aggregated Statistics For Year 2008(Based on 6 full and 6 partial tracts) A) Conventional B) Refinancings C) Non-occupant Loans on D) Loans On Manufactured Number Average Value Number Average Value Number Average Value Number Average Value
LOANS ORIGINATED 141 $173,164 27 $205,396 24 $157,638 0 $0 APPLICATIONS APPROVED, NOT ACCEPTED 47 $199,679 17 $159,319 10 $175,482 0 $0 APPLICATIONS DENIED 8 $160,268 2 $456,230 3 $279,753 1 $46,340 APPLICATIONS WITHDRAWN 12 $180,935 2 $128,845 2 $128,845 0 $0 FILES CLOSED FOR INCOMPLETENESS 2 $153,450 1 $193,690 2 $153,450 0 $0
Aggregated Statistics For Year 2007(Based on 6 full and 6 partial tracts) A) Conventional B) Refinancings C) Non-occupant Loans on D) Loans On Manufactured Number Average Value Number Average Value Number Average Value Number Average Value
LOANS ORIGINATED 229 $149,190 26 $168,995 13 $174,987 2 $50,640 APPLICATIONS APPROVED, NOT ACCEPTED 27 $184,360 12 $171,102 4 $159,635 0 $0 APPLICATIONS DENIED 10 $100,588 0 $0 2 $174,240 0 $0 APPLICATIONS WITHDRAWN 11 $164,955 3 $158,353 4 $73,105 0 $0 FILES CLOSED FOR INCOMPLETENESS 2 $141,570 0 $0 0 $0 0 $0
Aggregated Statistics For Year 2006(Based on 6 full and 6 partial tracts) A) Conventional B) Refinancings C) Non-occupant Loans on D) Loans On Manufactured Number Average Value Number Average Value Number Average Value Number Average Value
LOANS ORIGINATED 115 $145,422 19 $134,732 8 $122,291 1 $55,930 APPLICATIONS APPROVED, NOT ACCEPTED 27 $141,665 14 $204,740 1 $180,070 3 $56,393 APPLICATIONS DENIED 3 $116,937 0 $0 3 $116,937 0 $0 APPLICATIONS WITHDRAWN 11 $146,959 7 $101,169 2 $51,980 0 $0 FILES CLOSED FOR INCOMPLETENESS 0 $0 0 $0 0 $0 0 $0
Aggregated Statistics For Year 2005(Based on 6 full and 6 partial tracts) A) Conventional B) Refinancings C) Non-occupant Loans on D) Loans On Manufactured Number Average Value Number Average Value Number Average Value Number Average Value
LOANS ORIGINATED 131 $114,649 43 $183,697 23 $90,998 8 $76,182 APPLICATIONS APPROVED, NOT ACCEPTED 24 $167,729 19 $182,547 3 $93,423 2 $32,515 APPLICATIONS DENIED 0 $0 0 $0 0 $0 0 $0 APPLICATIONS WITHDRAWN 5 $159,452 2 $317,400 0 $0 0 $0 FILES CLOSED FOR INCOMPLETENESS 1 $117,440 1 $208,200 1 $208,200 0 $0
Aggregated Statistics For Year 2004(Based on 6 full and 6 partial tracts) A) Conventional B) Refinancings C) Non-occupant Loans on D) Loans On Manufactured Number Average Value Number Average Value Number Average Value Number Average Value
LOANS ORIGINATED 166 $125,400 55 $136,883 42 $89,594 7 $46,919 APPLICATIONS APPROVED, NOT ACCEPTED 17 $113,740 32 $163,715 6 $104,250 3 $67,923 APPLICATIONS DENIED 0 $0 0 $0 0 $0 0 $0 APPLICATIONS WITHDRAWN 11 $109,032 6 $172,677 3 $116,597 0 $0 FILES CLOSED FOR INCOMPLETENESS 0 $0 1 $85,490 0 $0 1 $85,490
Aggregated Statistics For Year 2003(Based on 6 full and 6 partial tracts) A) Conventional B) Refinancings C) Non-occupant Loans on Number Average Value Number Average Value Number Average Value
LOANS ORIGINATED 153 $102,869 122 $121,684 27 $102,546 APPLICATIONS APPROVED, NOT ACCEPTED 24 $110,916 51 $149,088 6 $60,130 APPLICATIONS DENIED 6 $82,520 2 $58,505 0 $0 APPLICATIONS WITHDRAWN 4 $75,708 14 $109,808 8 $85,311 FILES CLOSED FOR INCOMPLETENESS 1 $72,710 0 $0 0 $0
Aggregated Statistics For Year 2002(Based on 6 full tracts) A) Conventional B) Refinancings C) Non-occupant Loans on Number Average Value Number Average Value Number Average Value
LOANS ORIGINATED 131 $119,710 44 $112,060 22 $155,780 APPLICATIONS APPROVED, NOT ACCEPTED 8 $135,345 12 $138,161 2 $108,900 APPLICATIONS DENIED 8 $94,564 0 $0 0 $0 APPLICATIONS WITHDRAWN 4 $147,360 6 $93,772 4 $152,460 FILES CLOSED FOR INCOMPLETENESS 2 $68,915 0 $0 0 $0
Aggregated Statistics For Year 2001(Based on 6 full tracts) A) Conventional B) Refinancings C) Non-occupant Loans on Number Average Value Number Average Value Number Average Value
LOANS ORIGINATED 110 $113,581 20 $97,463 8 $71,035 APPLICATIONS APPROVED, NOT ACCEPTED 26 $116,152 12 $95,061 2 $161,935 APPLICATIONS DENIED 6 $138,702 6 $106,677 0 $0 APPLICATIONS WITHDRAWN 4 $82,900 0 $0 0 $0 FILES CLOSED FOR INCOMPLETENESS 0 $0 0 $0 0 $0
Aggregated Statistics For Year 2000(Based on 6 full tracts) A) Conventional B) Refinancings C) Non-occupant Loans on Number Average Value Number Average Value Number Average Value
LOANS ORIGINATED 84 $105,383 26 $107,147 4 $76,185 APPLICATIONS APPROVED, NOT ACCEPTED 10 $80,935 2 $149,820 4 $60,950 APPLICATIONS DENIED 10 $109,126 0 $0 2 $129,690 APPLICATIONS WITHDRAWN 2 $236,610 0 $0 0 $0 FILES CLOSED FOR INCOMPLETENESS 10 $84,474 6 $110,550 0 $0
Aggregated Statistics For Year 1999(Based on 3 full and 2 partial tracts) A) Conventional B) Refinancings C) Non-occupant Loans on Number Average Value Number Average Value Number Average Value
LOANS ORIGINATED 65 $107,327 26 $94,272 6 $63,458 APPLICATIONS APPROVED, NOT ACCEPTED 4 $107,040 8 $96,035 0 $0 APPLICATIONS DENIED 2 $81,140 3 $137,730 0 $0 APPLICATIONS WITHDRAWN 1 $125,240 5 $84,266 0 $0 FILES CLOSED FOR INCOMPLETENESS 3 $83,530 2 $73,730 1 $39,830
2002 - 2018 National Fire Incident Reporting System (NFIRS) incidents See full 2006 National Fire Incident Reporting System statistics for zip code 76020, Texas
Most common first names in zip code 76020 among deceased individuals Name Count Lived (average)
James 122 70.3 years John 109 73.3 years William 98 74.1 years Mary 88 77.2 years Robert 67 70.5 years Charles 48 72.9 years George 46 71.5 years Thomas 33 73.9 years Ruby 33 78.5 years Margaret 33 73.5 years
Most common last names in zip code 76020 among deceased individuals Last name Count Lived (average)
Smith 61 75.7 years Jones 40 72.0 years Williams 40 76.3 years Davis 32 74.3 years Harris 32 78.2 years Brown 29 78.9 years Miller 28 76.2 years White 24 75.3 years Martin 23 73.6 years Thompson 21 73.0 years
Businesses in zip code 76020
Name Count Name Count
AT&T 1 Nike 1 Albertsons 1 Pizza Hut 1 AutoZone 1 RadioShack 1 Blockbuster 1 SONIC Drive-In 1 CVS 1 Sears 1 Curves 1 Sprint Nextel 1 Domino's Pizza 1 Subway 2 Econo Lodge 1 T-Mobile 2 FedEx 3 Taco Bell 1 H&R Block 1 True Value 1 Jack In The Box 1 U-Haul 3 Jones New York 1 UPS 2 KFC 1 Walgreens 1 Long John Silver's 1 Walmart 1 McDonald's 1
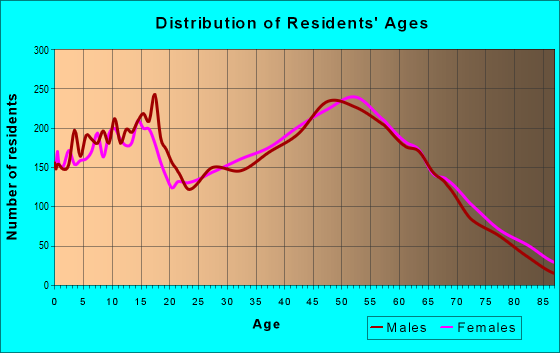
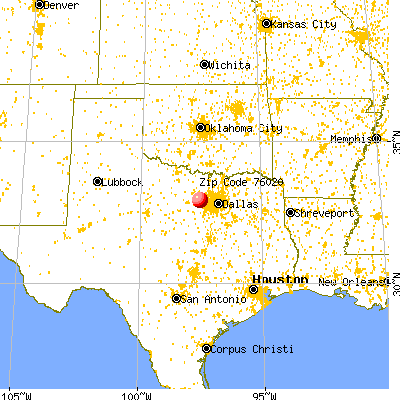


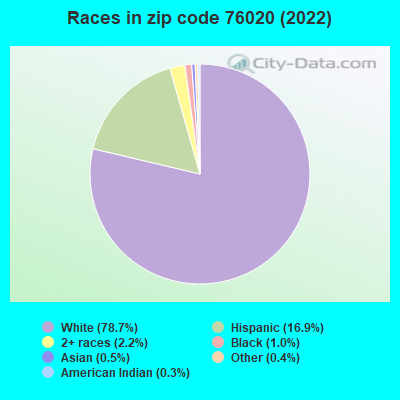


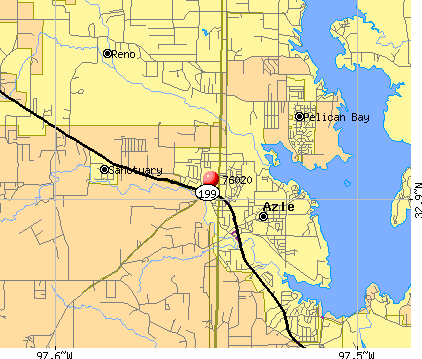 Nearest zip codes: 76135, 76108, 76179, 76085, 76023, 76071.
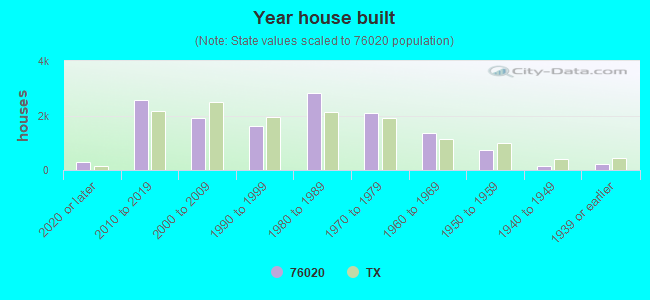
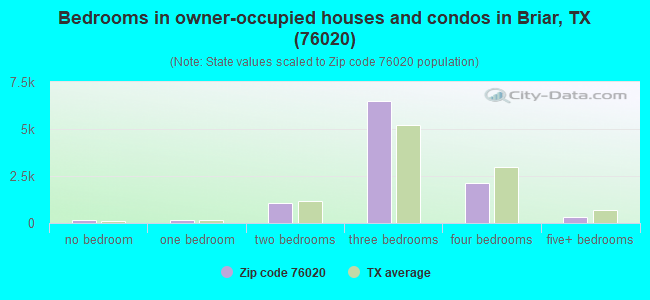
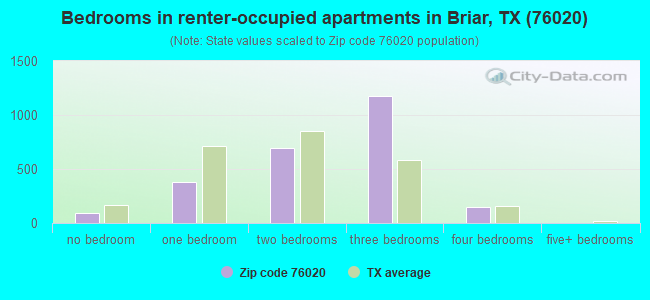
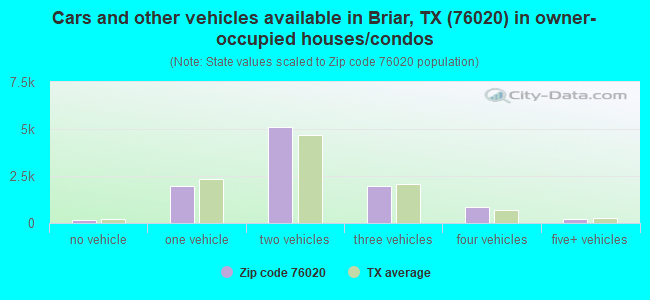
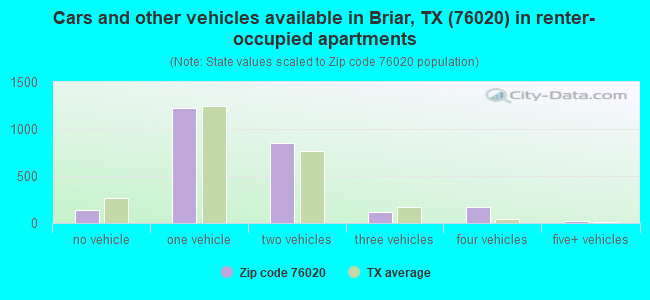


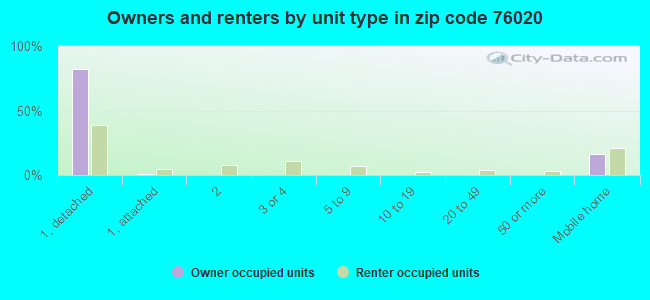
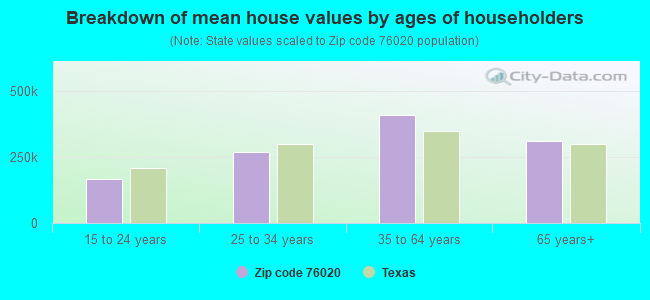


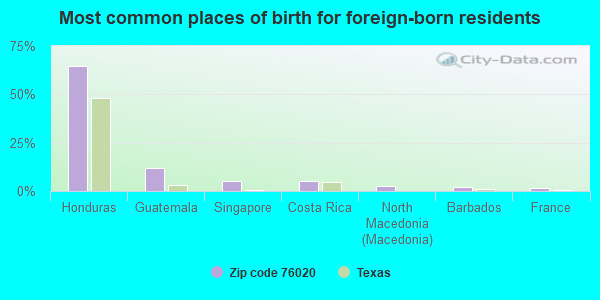
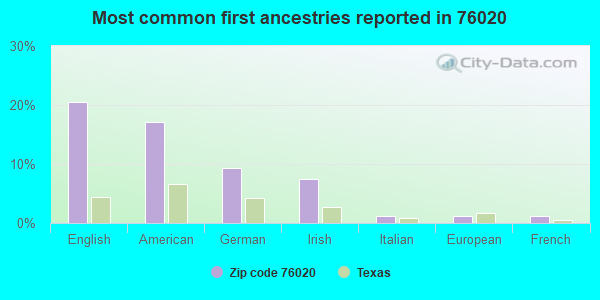
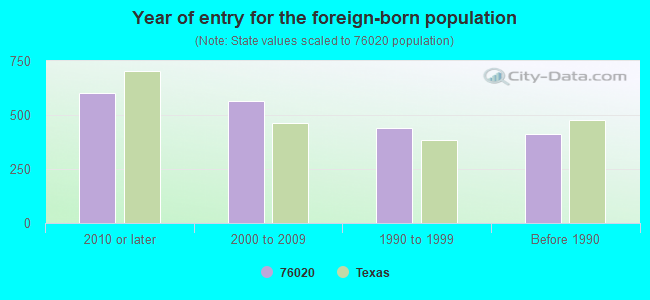


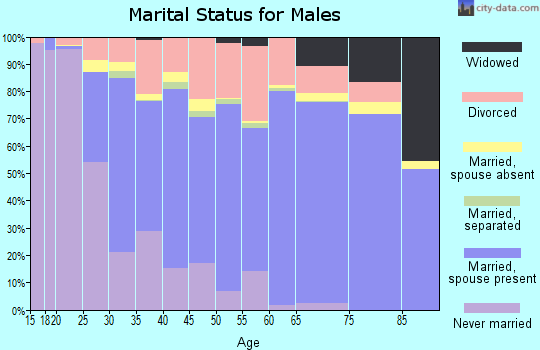


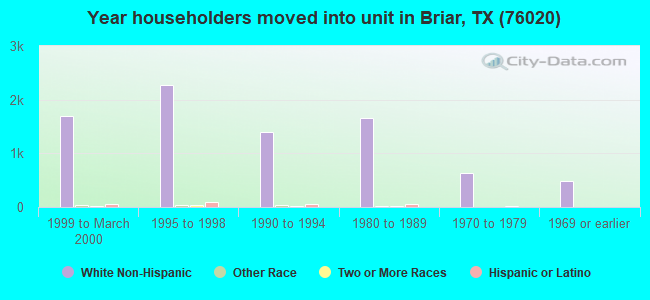
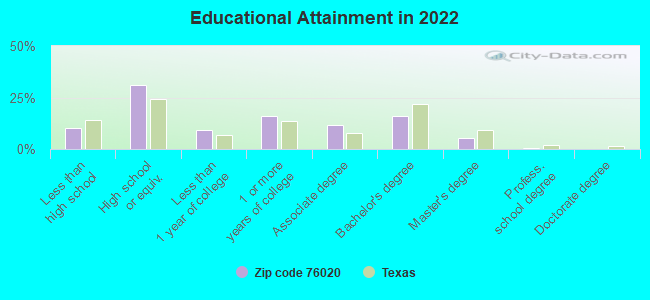
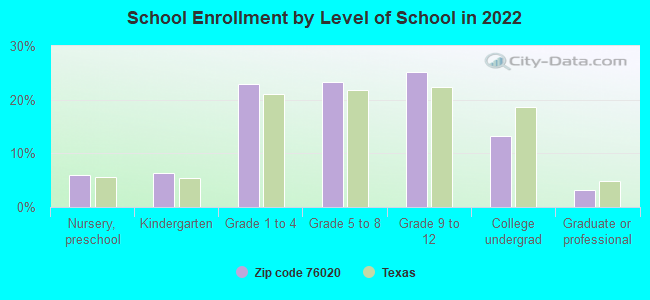
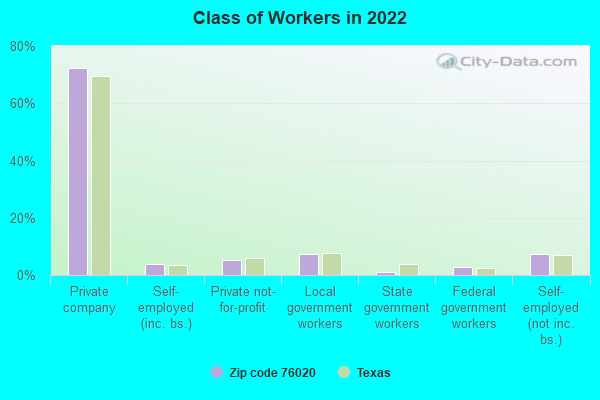
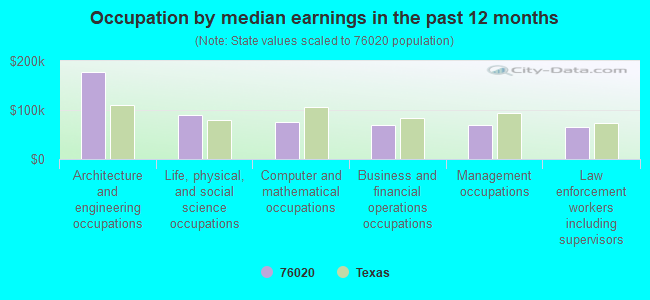
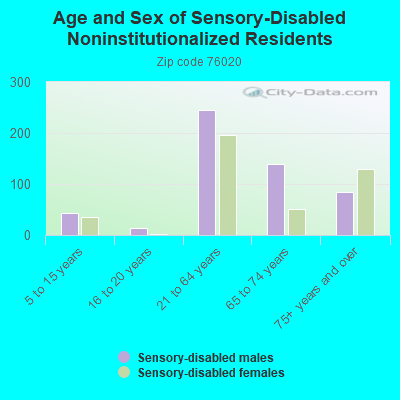
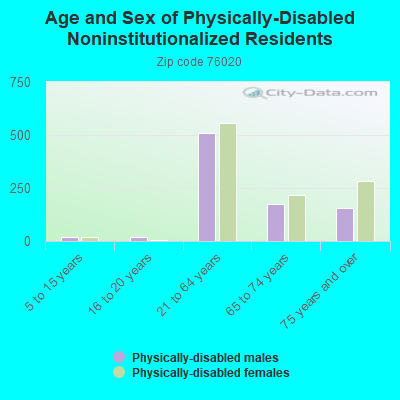
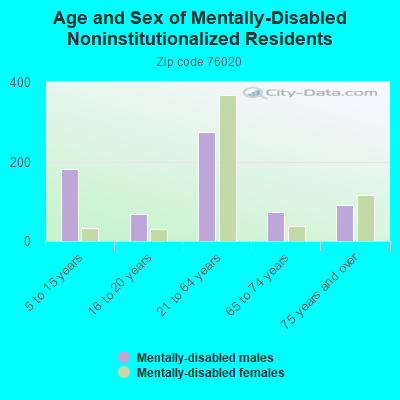
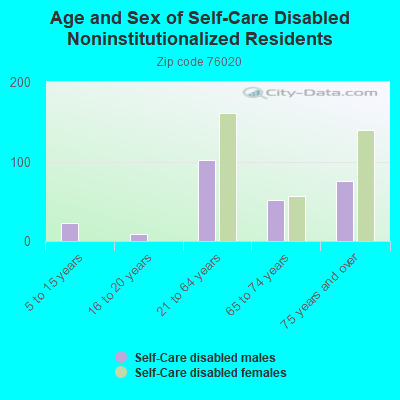
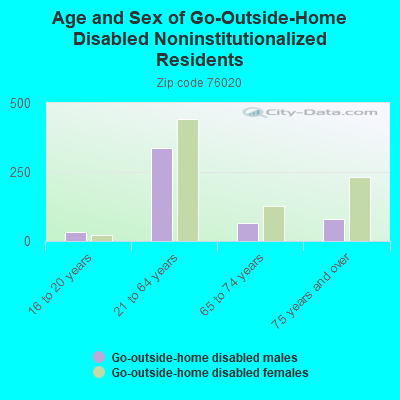
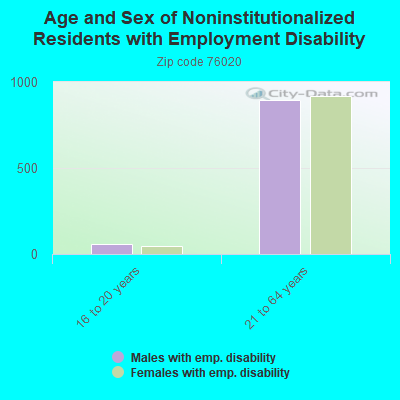
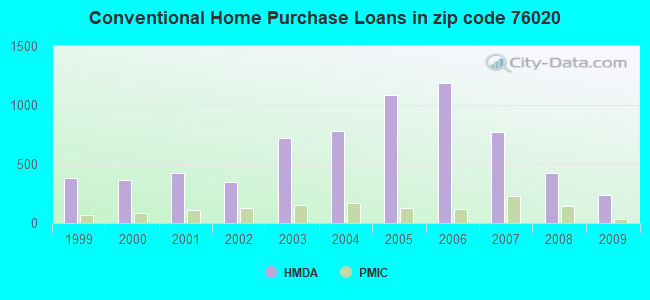
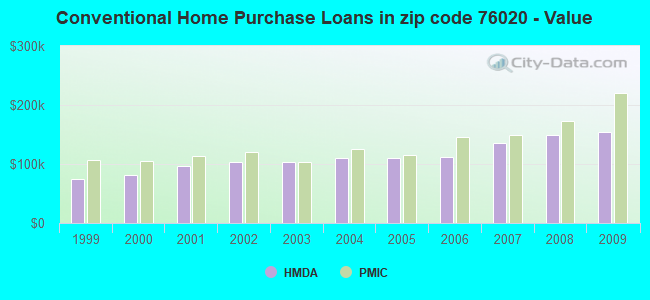
 According to the data from the years 2002 - 2018 the average number of fires per year is 212. The highest number of reported fires - 358 took place in 2011, and the least - 87 in 2002. The data has an increasing trend.
 When looking into fire subcategories, the most reports belonged to: Outside Fires (47.8%), and Structure Fires (42.2%).