Estimated zip code population in 2022: 3,515 Zip code population in 2010: 2,637 Zip code population in 2000: 2,145
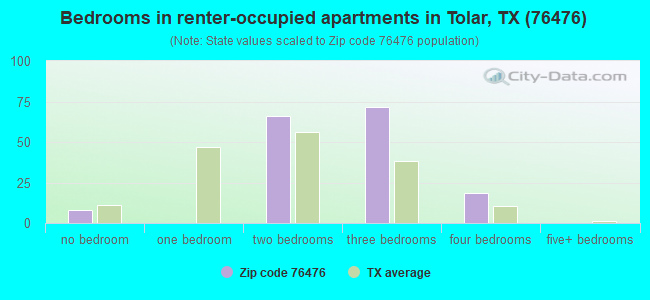
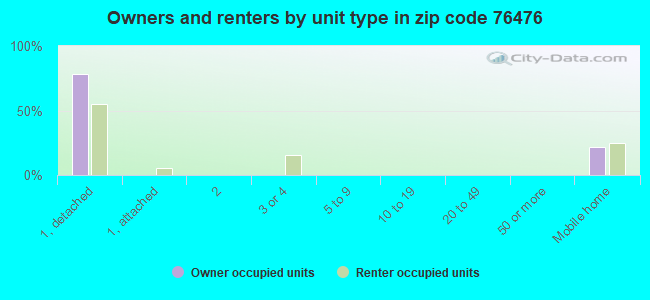
Houses and condos: 1,175 Renter-occupied apartments: 165
% of renters here:
15%
State:
38%
March 2022 cost of living index in zip code 76476: 85.0 (less than average, U.S. average is 100)
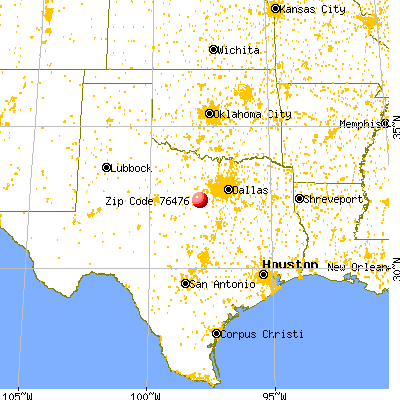
Land area: 102.7 sq. mi. Water area: 1.6 sq. mi.
Population density: 34 people per square mile
(very low).
OSM Map
General Map
Google Map
MSN Map
OSM Map
General Map
Google Map
MSN Map
OSM Map
General Map
Google Map
MSN Map
OSM Map
General Map
Google Map
MSN Map
Please wait while loading the map...
Real estate property taxes paid for housing units in 2022:
This zip code:
1.2% ($2,669)
Texas:
1.5% ($4,050)
Median real estate property taxes paid for housing units with mortgages in 2022: $3,632 (1.3%) Median real estate property taxes paid for housing units with no mortgage in 2022: $1,827 (1.0%)
Business Search- 14 Million verified businesses
Males: 1,729
(49.2%)
Females: 1,785
(50.8%)
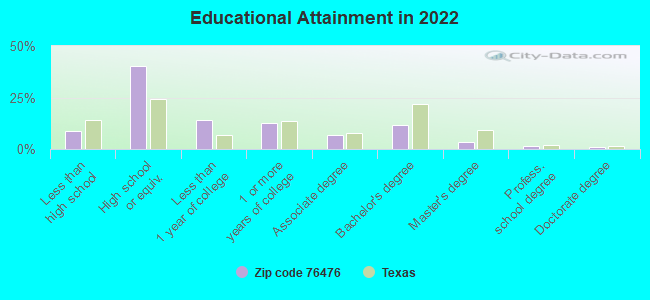
For population 25 years and over in 76476:
High school or higher: 90.4%
Bachelor's degree or higher: 17.6%
Graduate or professional degree: 5.9%
Unemployed: 2.5%
Mean travel time to work (commute): 37.5 minutes
For population 15 years and over in 76476:
Never married: 20.8%
Now married: 60.2%
Separated: 0.6%
Widowed: 5.7%
Divorced: 12.7%
Zip code 76476 compared to state average:
Unemployed percentage below state average.
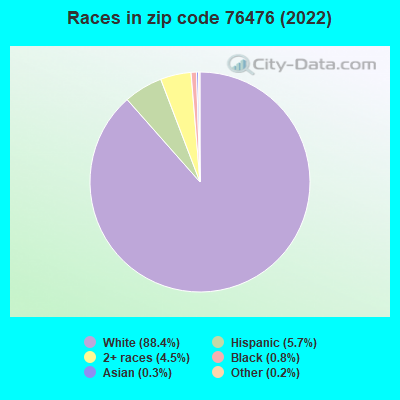
Black race population percentage significantly below state average.
Hispanic race population percentage significantly below state average.
Foreign-born population percentage significantly below state average.
Renting percentage significantly below state average.
Length of stay since moving in significantly above state average.
Percentage of population with a bachelor's degree or higher below state average.
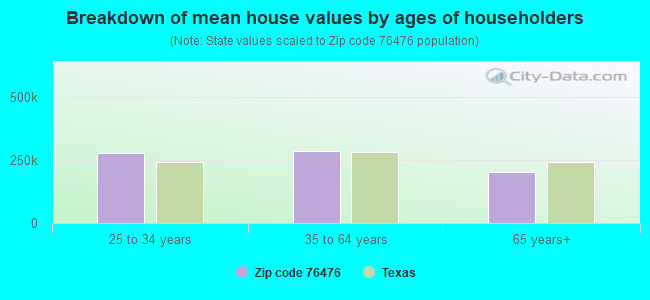
Estimated median house/condo value in 2022: $224,370
76476:
$224,370
Texas:
$275,400
According to our research of Texas and other state lists, there were 7 registered sex offenders living in 76476 zip code as of April 27, 2024. The ratio of all residents to sex offenders in zip code 76476 is 370 to 1. The ratio of registered sex offenders to all residents in this zip code is near the state average.
Median resident age:
This zip code:
38.3 years
Texas median age:
35.6 years
Average household size:
This zip code:
3.1 people
Texas:
2.6 people
Averages for the 2020 tax year for zip code 76476, filed in 2021:
Average Adjusted Gross Income (AGI) in 2020: $74,437 (Individual Income Tax Returns)
Here:
$74,437
State:
$77,054
Salary/wage: $63,286 (reported on 81.2% of returns)
Here:
$63,286
State:
$62,766
(% of AGI for various income ranges: 1254.3% for AGIs below $25k, 3361.7% for AGIs $25k-50k, 6277.3% for AGIs $50k-75k, 10071.0% for AGIs $75k-100k, 17309.3% for AGIs $100k-200k, 69245.0% for AGIs over 200k)
Taxable interest for individuals: $1,768 (reported on 24.6% of returns)
This zip code:
$1,768
Texas:
$2,665
(% of AGI for various income ranges: 6.1% for AGIs below $25k, 35.0% for AGIs $25k-50k, 17.3% for AGIs $50k-75k, 15.0% for AGIs $75k-100k, 144.0% for AGIs $100k-200k, 1215.0% for AGIs over 200k)
Ordinary dividends: $5,395 (reported on 14.5% of returns)
Here:
$5,395
State:
$10,044
(% of AGI for various income ranges: 3.6% for AGIs below $25k, 18.3% for AGIs $25k-50k, 84.7% for AGIs $50k-75k, 172.0% for AGIs $100k-200k, 3200.0% for AGIs over 200k)
Net capital gain/loss in AGI: +$26,395 (reported on 15.2% of returns)
Here:
+$26,395
State:
+$39,590
(% of AGI for various income ranges: 32.9% for AGIs $25k-50k, 116.7% for AGIs $50k-75k, 135.0% for AGIs $75k-100k, 807.3% for AGIs $100k-200k, 19745.0% for AGIs over 200k)
Profit/loss from business: +$13,906 (reported on 24.6% of returns)
Here:
+$13,906
State:
+$10,888
(% of AGI for various income ranges: 163.2% for AGIs below $25k, 210.8% for AGIs $25k-50k, 267.3% for AGIs $50k-75k, 807.0% for AGIs $75k-100k, 1000.7% for AGIs $100k-200k, 5280.0% for AGIs over 200k)
Taxable individual retirement arrangement distribution: $17,150 (reported on 8.7% of returns)
76476:
$17,150
Texas:
$24,740
(% of AGI for various income ranges: 170.0% for AGIs $25k-50k, 362.0% for AGIs $50k-75k, 738.0% for AGIs $100k-200k)
Total itemized deductions: $34,238 (reported on 5.8% of returns)
Here:
$34,238
State:
$40,428
(% of AGI for various income ranges: 174.6% for AGIs below $25k, 762.0% for AGIs $100k-200k, 5535.0% for AGIs over 200k)
Charity contributions: $11,633 (reported on 4.3% of returns)
Here:
$11,633
State:
$18,201
(% of AGI for various income ranges: 242.0% for AGIs $100k-200k, 1675.0% for AGIs over 200k)
Taxes paid: $7,675 (reported on 5.8% of returns)
76476:
$7,675
State:
$7,821
(% of AGI for various income ranges: 35.0% for AGIs below $25k, 160.7% for AGIs $100k-200k, 1375.0% for AGIs over 200k)
Earned income credit: $2,400 (reported on 15.2% of returns)
Here:
$2,400
State:
$2,584
(% of AGI for various income ranges: 96.1% for AGIs below $25k, 97.9% for AGIs $25k-50k)
Percentage of individuals using paid preparers for their 2020 taxes: 92.0%
Here:
92%
State:
92%
(% for various income ranges: 87.8% for AGIs below $25k, 93.3% for AGIs $25k-50k, 94.7% for AGIs $50k-75k, 93.3% for AGIs $75k-100k, 96.0% for AGIs $100k-200k, 87.5% for AGIs over 200k)
Averages for the 2012 tax year for zip code 76476, filed in 2013:
Average Adjusted Gross Income (AGI) in 2012: $61,964 (Individual Income Tax Returns)
Here:
$61,964
State:
$65,384
Salary/wage: $53,039 (reported on 82.9% of returns)
Here:
$53,039
State:
$52,524
(% of AGI for various income ranges: 71.3% for AGIs below $25k, 77.0% for AGIs $25k-50k, 77.3% for AGIs $50k-75k, 82.8% for AGIs $75k-100k, 77.8% for AGIs $100k-200k, 39.4% for AGIs over 200k)
Taxable interest for individuals: $922 (reported on 25.7% of returns)
This zip code:
$922
Texas:
$2,372
(% of AGI for various income ranges: 1.3% for AGIs below $25k, 0.3% for AGIs $25k-50k, 0.3% for AGIs $50k-75k, 0.3% for AGIs $75k-100k, 0.1% for AGIs $100k-200k, 0.8% for AGIs over 200k)
Ordinary dividends: $1,731 (reported on 12.4% of returns)
Here:
$1,731
State:
$9,721
(% of AGI for various income ranges: 2.7% for AGIs below $25k, 0.2% for AGIs $50k-75k, 0.4% for AGIs $100k-200k)
Net capital gain/loss in AGI: +$11,986 (reported on 13.3% of returns)
Here:
+$11,986
State:
+$35,319
(% of AGI for various income ranges: 0.2% for AGIs $25k-50k, 0.4% for AGIs $50k-75k, 8.1% for AGIs $100k-200k)
Profit/loss from business: +$12,804 (reported on 24.8% of returns)
Here:
+$12,804
State:
+$13,732
(% of AGI for various income ranges: 13.5% for AGIs below $25k, 5.1% for AGIs $25k-50k, 5.0% for AGIs $50k-75k, 5.1% for AGIs $75k-100k, 6.4% for AGIs $100k-200k)
Taxable individual retirement arrangement distribution: $15,456 (reported on 8.6% of returns)
76476:
$15,456
Texas:
$19,511
(% of AGI for various income ranges: 5.2% for AGIs below $25k, 3.6% for AGIs $50k-75k, 4.0% for AGIs $100k-200k)
Total itemized deductions: $22,654 (21% of AGI, reported on 26.7% of returns)
Here:
$22,654
State:
$24,724
Here:
20.8% of AGI
State:
15.9% of AGI
(% of AGI for various income ranges: 8.0% for AGIs below $25k, 9.2% for AGIs $25k-50k, 9.3% for AGIs $50k-75k, 9.8% for AGIs $75k-100k, 11.1% for AGIs $100k-200k, 8.7% for AGIs over 200k)
Charity contributions: $4,782 (reported on 21.0% of returns)
Here:
$4,782
State:
$6,808
(% of AGI for various income ranges: 1.6% for AGIs $25k-50k, 1.1% for AGIs $50k-75k, 1.5% for AGIs $75k-100k, 2.4% for AGIs $100k-200k, 1.5% for AGIs over 200k)
Taxes paid: $4,589 (reported on 26.7% of returns)
76476:
$4,589
State:
$6,921
(% of AGI for various income ranges: 2.5% for AGIs $25k-50k, 1.7% for AGIs $50k-75k, 2.3% for AGIs $75k-100k, 2.4% for AGIs $100k-200k, 1.6% for AGIs over 200k)
Earned income credit: $2,133 (reported on 17.1% of returns)
Here:
$2,133
State:
$2,570
(% of AGI for various income ranges: 6.6% for AGIs below $25k, 1.2% for AGIs $25k-50k)
Percentage of individuals using paid preparers for their 2012 taxes: 58.1%
Here:
58%
State:
51%
(% for various income ranges: 48.6% for AGIs below $25k, 54.5% for AGIs $25k-50k, 62.5% for AGIs $50k-75k, 58.3% for AGIs $75k-100k, 73.3% for AGIs $100k-200k, 100.0% for AGIs over 200k)
Averages for the 2004 tax year for zip code 76476, filed in 2005:
Average Adjusted Gross Income (AGI) in 2004: $41,082 (Individual Income Tax Returns)
Here:
$41,082
State:
$47,881
Salary/wage: $39,515 (reported on 81.4% of returns)
Here:
$39,515
State:
$41,947
(% of AGI for various income ranges: 73.1% for AGIs $10k-25k, 78.3% for AGIs $25k-50k, 82.4% for AGIs $50k-75k, 88.3% for AGIs $75k-100k, 58.8% for AGIs over 100k)
Taxable interest for individuals: $1,283 (reported on 35.4% of returns)
This zip code:
$1,283
Texas:
$2,255
(% of AGI for various income ranges: 0.6% for AGIs $10k-25k, 0.8% for AGIs $25k-50k, 1.7% for AGIs $50k-75k, 0.4% for AGIs $75k-100k, 1.1% for AGIs over 100k)
Taxable dividends: $772 (reported on 14.0% of returns)
Here:
$772
State:
$4,261
(% of AGI for various income ranges: 0.3% for AGIs $10k-25k, 0.3% for AGIs $25k-50k, 0.1% for AGIs $50k-75k, 0.1% for AGIs $75k-100k, 0.1% for AGIs over 100k)
Net capital gain/loss: +$11,650 (reported on 16.8% of returns)
Here:
+$11,650
State:
+$16,110
(% of AGI for various income ranges: 0.4% for AGIs $10k-25k, 1.0% for AGIs $25k-50k, 0.9% for AGIs $50k-75k, -0.1% for AGIs $75k-100k, 19.5% for AGIs over 100k)
Profit/loss from business: +$5,098 (reported on 26.3% of returns)
Here:
+$5,098
State:
+$11,013
(% of AGI for various income ranges: 11.2% for AGIs $10k-25k, 7.0% for AGIs $25k-50k, 1.5% for AGIs $50k-75k, 2.0% for AGIs $75k-100k, -0.1% for AGIs over 100k)
IRA payment deduction: $3,923 (reported on 1.3% of returns)
76476:
$3,923
Texas:
$3,120
Total itemized deductions: $16,122 (22% of AGI, reported on 24.5% of returns)
Here:
$16,122
State:
$19,631
Here:
22.3% of AGI
State:
18.9% of AGI
(% of AGI for various income ranges: 9.1% for AGIs $10k-25k, 8.5% for AGIs $25k-50k, 9.6% for AGIs $50k-75k, 12.1% for AGIs $75k-100k, 8.9% for AGIs over 100k)
Charity contributions deductions: $3,320 (5% of AGI, reported on 17.8% of returns)
Here:
$3,320
State:
$4,753
Here:
4.5% of AGI
State:
4.2% of AGI
(% of AGI for various income ranges: 1.3% for AGIs $10k-25k, 1.2% for AGIs $25k-50k, 1.2% for AGIs $50k-75k, 2.1% for AGIs $75k-100k, 1.4% for AGIs over 100k)
Total tax: $5,211 (reported on 78.1% of returns)
76476:
$5,211
State:
$9,058
(% of AGI for various income ranges: 5.0% for AGIs $10k-25k, 6.4% for AGIs $25k-50k, 8.4% for AGIs $50k-75k, 10.3% for AGIs $75k-100k, 16.9% for AGIs over 100k)
Earned income credit: $1,777 (reported on 15.3% of returns)
Here:
$1,777
State:
$2,024
Percentage of individuals using paid preparers for their 2004 taxes: 64.3%
Here:
64%
State:
57%
(% for various income ranges: 55.5% for AGIs below $10k, 59.3% for AGIs $10k-25k, 64.6% for AGIs $25k-50k, 70.3% for AGIs $50k-75k, 75.9% for AGIs $75k-100k, 73.6% for AGIs over 100k)
Household received Food Stamps/SNAP in the past 12 months: 55 Household did not receive Food Stamps/SNAP in the past 12 months: 1,057
Women who had a birth in the past 12 months: 32 (17 now married, 13 unmarried) Women who did not have a birth in the past 12 months: 759 (400 now married, 357 unmarried)
Housing units in zip code 76476 with a mortgage: 468 (40 second mortgage, 40 both second mortgage and home equity loan) Median monthly owner costs for units with a mortgage: $1,376 Median monthly owner costs for units without a mortgage: $490
Residents with income below the poverty level in 2022:
This zip code:
10.7%
Whole state:
14.0%
Residents with income below 50% of the poverty level in 2022:
This zip code:
2.5%
Whole state:
7.4%
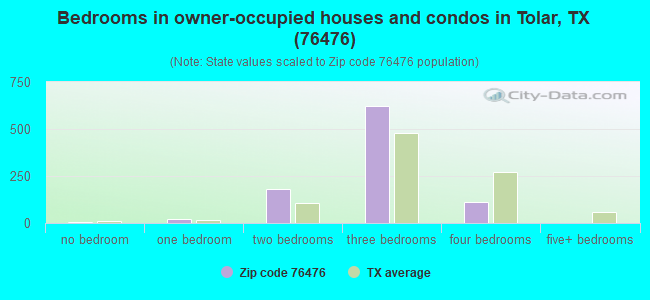
Median number of rooms in houses and condos:
Here:
5.5
State:
6.3
Median number of rooms in apartments:
Here:
4.6
State:
4.0
Notable locations in this zip code not listed on our city pages
Cemeteries: Antioch Cemetery (1), Asbury Cemetery (2), Mount Pleasant Cemetery (3), Strouds Creek Cemetery (4), Glenn Cemetery (5), Powell Cemetery (6), Tolar Cemetery (7). Display/hide their locations on the map
587 married couples with children.
199 single-parent households (57 men, 142 women).
98.1% of residents of 76476 zip code speak English at home.
1.5% of residents speak Spanish at home (100% very well).
0.3% of residents speak other Indo-European language at home (100% very well).
0.1% of residents speak Asian or Pacific Island language at home (100% very well).
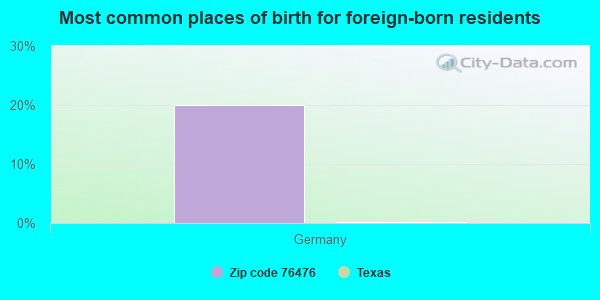
Foreign born population: 5 (0.2%) (100.0% of them are naturalized citizens)
This zip code:
0.2%
Whole state:
17.2%
20%Germany
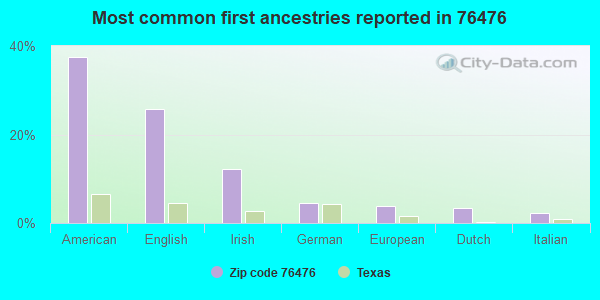
38%American
26%English
12%Irish
5%German
4%European
3%Dutch
2%Italian
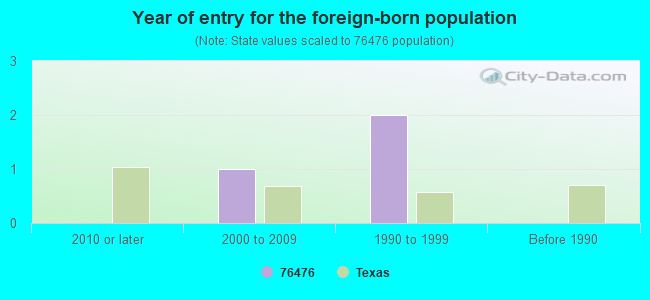
Year of entry for the foreign-born population
02010 or later
12000 to 2009
21990 to 1999
0Before 1990
Housing units lacking complete plumbing facilities: 2.0% Housing units lacking complete kitchen facilities: 1.9%
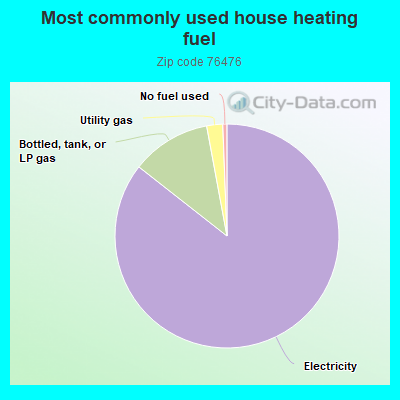
85.5%Electricity
11.5%Bottled, tank, or LP gas
2.3%Utility gas
0.6%No fuel used
Population in 1990: 2,586.
Place of birth for U.S.-born residents:
This state: 2,613
Northeast: 18
Midwest: 216
South: 327
West: 324
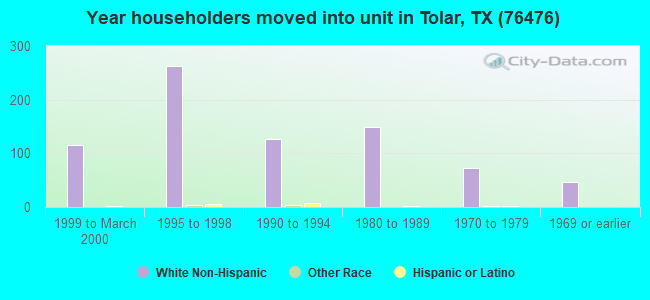
60% of the 76476 zip code residents lived in the same house 5 years ago. Out of people who lived in different houses, 49% lived in this county. Out of people who lived in different counties, 50% lived in Texas.
92% of the 76476 zip code residents lived in the same house 1 year ago. Out of people who lived in different houses, 35% moved from this county. Out of people who lived in different houses, 29% moved from different county within same state. Out of people who lived in different houses, 39% moved from different state. Out of people who lived in different houses, 1% moved from abroad.
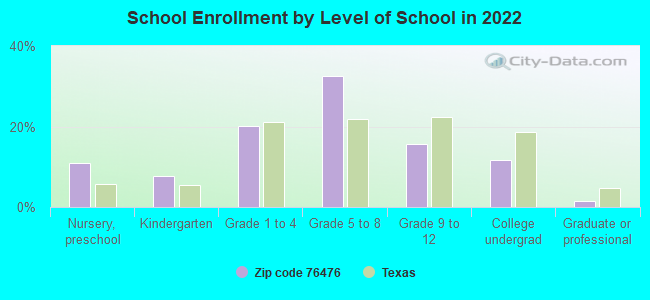
Private vs. public school enrollment:
Students in private schools in grades 1 to 8 (elementary and middle school): 18
Here:
3.5%
Texas:
8.8%
Students in private schools in grades 9 to 12 (high school): 6
Here:
4.1%
Texas:
8.0%
Students in private undergraduate colleges: 6
Here:
5.7%
Texas:
16.2%
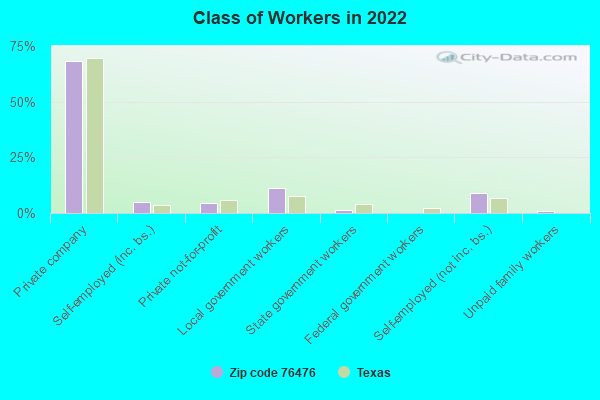
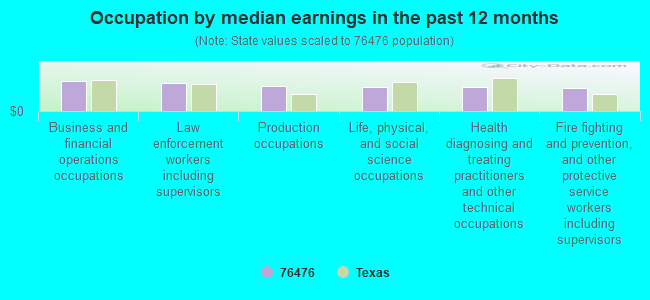
Occupation by median earnings in the past 12 months ($)
92,784Business and financial operations occupations
83,782Law enforcement workers including supervisors
75,421Production occupations
72,966Life, physical, and social science occupations
72,216Health diagnosing and treating practitioners and other technical occupations
70,510Fire fighting and prevention, and other protective service workers including supervisors
Top industries in this zip code by the number of employees in 2005:
Other Services (except Public Administration): Religious Organizations (5-9 employees: 2 establishments, 1-4 employees: 1 establishment)
Arts, Entertainment, and Recreation: Golf Courses and Country Clubs (10-19: 1)
Other Services (except Public Administration): Drycleaning and Laundry Services (except Coin-Operated) (10-19: 1)
Construction: New Single-Family Housing Construction (except Operative Builders) (10-19: 1)
Wholesale Trade: Metal Service Centers and Other Metal Merchant Wholesalers (5-9: 1)
Finance and Insurance: Commercial Banking (5-9: 1)
Construction: Commercial and Institutional Building Construction (5-9: 1)
Health Care and Social Assistance: Residential Mental Retardation Facilities (5-9: 1)
People in group quarters in 2010:
6 people in group homes intended for adults
People in group quarters in 2000:
8 people in nursing homes
5 people in homes for the mentally retarded
Fatal accident statistics in 2013:
Fatal accident count: 1
Vehicles involved in fatal accidents: 1
Fatal accidents caused by drunken drivers: 0
Fatalities: 1
Persons involved in fatal accidents: 3
Pedestrians involved in fatal accidents: 1
Fatal accident statistics in 2012:
Fatal accident count: 1
Vehicles involved in fatal accidents: 1
Fatal accidents caused by drunken drivers: 0
Fatalities: 1
Persons involved in fatal accidents: 1
Pedestrians involved in fatal accidents: 0
Home Mortgage Disclosure Act Aggregated Statistics For Year 2003 (Based on 2 partial tracts)
A) FHA, FSA/RHS & VA Home Purchase Loans
B) Conventional Home Purchase Loans
C) Refinancings
D) Home Improvement Loans
F) Non-occupant Loans on < 5 Family Dwellings (A B C & D)
Number
Average Value
Number
Average Value
Number
Average Value
Number
Average Value
Number
Average Value
LOANS ORIGINATED
33
$102,025
115
$87,911
193
$103,569
46
$15,362
33
$80,075
APPLICATIONS APPROVED, NOT ACCEPTED
0
$0
14
$80,295
28
$103,839
1
$16,740
6
$77,018
APPLICATIONS DENIED
4
$103,672
47
$79,963
86
$83,228
13
$24,103
12
$101,271
APPLICATIONS WITHDRAWN
1
$139,470
20
$109,810
56
$105,018
2
$63,690
10
$129,149
FILES CLOSED FOR INCOMPLETENESS
0
$0
10
$98,001
6
$75,313
2
$38,585
1
$146,910
Detailed HMDA statistics for the following Tracts:1603.00
Private Mortgage Insurance Companies Aggregated Statistics For Year 2003 (Based on 2 partial tracts)
A) Conventional Home Purchase Loans
B) Refinancings
C) Non-occupant Loans on < 5 Family Dwellings (A & B)
Number
Average Value
Number
Average Value
Number
Average Value
LOANS ORIGINATED
33
$105,800
15
$128,870
2
$61,365
APPLICATIONS APPROVED, NOT ACCEPTED
3
$107,547
6
$83,682
0
$0
APPLICATIONS DENIED
1
$97,630
0
$0
0
$0
APPLICATIONS WITHDRAWN
0
$0
1
$86,470
0
$0
FILES CLOSED FOR INCOMPLETENESS
5
$117,712
0
$0
4
$131,102
Detailed PMIC statistics for the following Tracts:1603.00
2002 - 2018 National Fire Incident Reporting System (NFIRS) incidents
Based on the data from the years 2002 - 2018 the average number of fire incidents per year is 52. The highest number of fires - 99 took place in 2008, and the least - 24 in 2015. The data has a growing trend.
When looking into fire subcategories, the most reports belonged to: Outside Fires (69.9%), and Structure Fires (17.1%).
Fire incident types reported to NFIRS in Zip Code 76476


 Nearest zip codes: 76433, 76048, 76462, 76043, 76049, 76077.


 Based on the data from the years 2002 - 2018 the average number of fire incidents per year is 52. The highest number of fires - 99 took place in 2008, and the least - 24 in 2015. The data has a growing trend.
 When looking into fire subcategories, the most reports belonged to: Outside Fires (69.9%), and Structure Fires (17.1%).