Estimated zip code population in 2022: 89,380 Zip code population in 2010: 93,818 Zip code population in 2000: 84,485
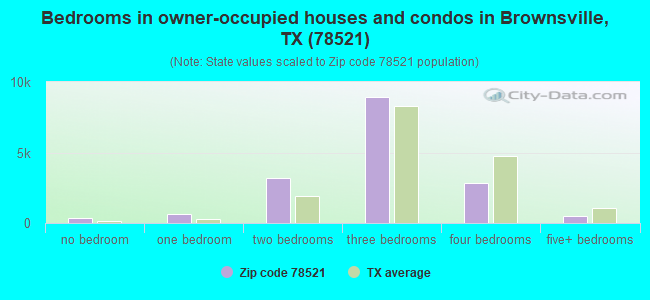
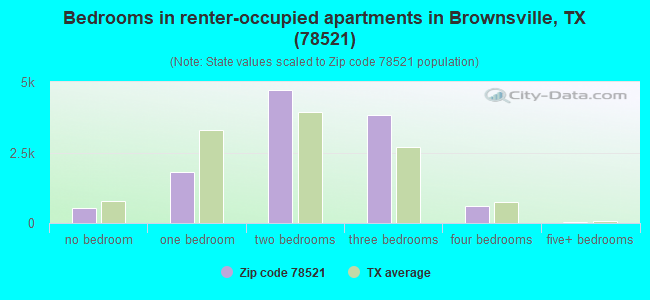
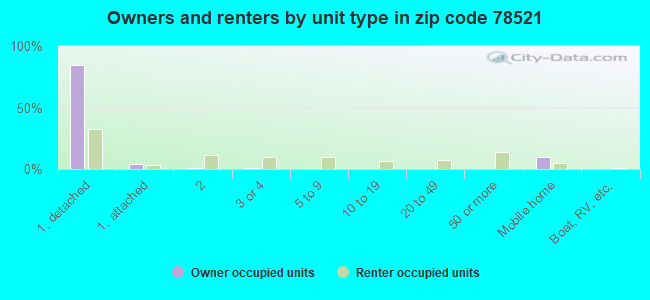
Houses and condos: 30,175 Renter-occupied apartments: 11,636
% of renters here:
41%
State:
38%
March 2022 cost of living index in zip code 78521: 79.1 (low, U.S. average is 100)
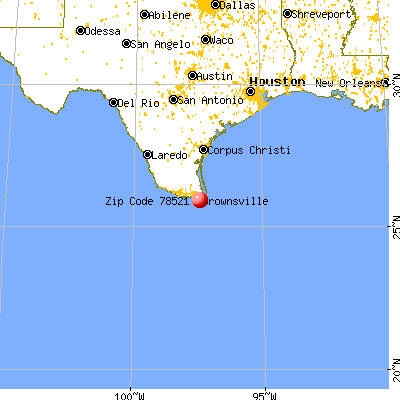
Land area: 93.1 sq. mi. Water area: 27.9 sq. mi.
Population density: 960 people per square mile
(low).
OSM Map
General Map
Google Map
MSN Map
OSM Map
General Map
Google Map
MSN Map
OSM Map
General Map
Google Map
MSN Map
OSM Map
General Map
Google Map
MSN Map
Please wait while loading the map...
Real estate property taxes paid for housing units in 2022:
This zip code:
1.5% ($1,428)
Texas:
1.5% ($4,050)
Median real estate property taxes paid for housing units with mortgages in 2022: $1,982 (1.7%) Median real estate property taxes paid for housing units with no mortgage in 2022: $1,211 (1.4%)
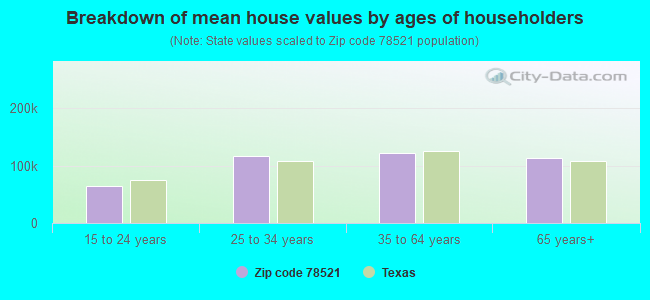
Estimated median house/condo value in 2022: $97,547
78521:
$97,547
Texas:
$275,400
According to our research of Texas and other state lists, there were 155 registered sex offenders living in 78521 zip code as of April 26, 2024. The ratio of all residents to sex offenders in zip code 78521 is 609 to 1. The ratio of registered sex offenders to all residents in this zip code is lower than the state average.
Median resident age:
This zip code:
31.3 years
Texas median age:
35.6 years
Average household size:
This zip code:
3.2 people
Texas:
2.6 people
Averages for the 2020 tax year for zip code 78521, filed in 2021:
Average Adjusted Gross Income (AGI) in 2020: $34,311 (Individual Income Tax Returns)
Here:
$34,311
State:
$77,054
Salary/wage: $31,105 (reported on 85.6% of returns)
Here:
$31,105
State:
$62,766
(% of AGI for various income ranges: 1133.5% for AGIs below $25k, 3336.7% for AGIs $25k-50k, 6247.7% for AGIs $50k-75k, 9270.5% for AGIs $75k-100k, 16752.6% for AGIs $100k-200k, 71120.0% for AGIs over 200k)
Taxable interest for individuals: $2,275 (reported on 7.5% of returns)
This zip code:
$2,275
Texas:
$2,665
(% of AGI for various income ranges: 2.6% for AGIs below $25k, 4.5% for AGIs $25k-50k, 12.1% for AGIs $50k-75k, 35.6% for AGIs $75k-100k, 212.5% for AGIs $100k-200k, 3963.8% for AGIs over 200k)
Ordinary dividends: $6,520 (reported on 2.5% of returns)
Here:
$6,520
State:
$10,044
(% of AGI for various income ranges: 1.4% for AGIs below $25k, 3.2% for AGIs $25k-50k, 11.9% for AGIs $50k-75k, 27.5% for AGIs $75k-100k, 158.9% for AGIs $100k-200k, 4576.2% for AGIs over 200k)
Net capital gain/loss in AGI: +$10,266 (reported on 3.0% of returns)
Here:
+$10,266
State:
+$39,590
(% of AGI for various income ranges: 1.5% for AGIs below $25k, 3.8% for AGIs $25k-50k, 19.2% for AGIs $50k-75k, 57.9% for AGIs $75k-100k, 401.3% for AGIs $100k-200k, 8635.0% for AGIs over 200k)
Profit/loss from business: +$8,002 (reported on 20.4% of returns)
Here:
+$8,002
State:
+$10,888
(% of AGI for various income ranges: 228.4% for AGIs below $25k, 87.0% for AGIs $25k-50k, 87.8% for AGIs $50k-75k, 198.1% for AGIs $75k-100k, 455.7% for AGIs $100k-200k, 7990.0% for AGIs over 200k)
Taxable individual retirement arrangement distribution: $12,523 (reported on 1.7% of returns)
78521:
$12,523
Texas:
$24,740
(% of AGI for various income ranges: 5.0% for AGIs below $25k, 13.7% for AGIs $25k-50k, 36.8% for AGIs $50k-75k, 132.3% for AGIs $75k-100k, 243.5% for AGIs $100k-200k, 1417.5% for AGIs over 200k)
Total itemized deductions: $34,289 (reported on 1.2% of returns)
Here:
$34,289
State:
$40,428
(% of AGI for various income ranges: 2.7% for AGIs below $25k, 26.9% for AGIs $25k-50k, 111.7% for AGIs $50k-75k, 211.9% for AGIs $75k-100k, 411.3% for AGIs $100k-200k, 3836.2% for AGIs over 200k)
Charity contributions: $9,973 (reported on 0.8% of returns)
Here:
$9,973
State:
$18,201
(% of AGI for various income ranges: 3.7% for AGIs $25k-50k, 14.8% for AGIs $50k-75k, 46.8% for AGIs $75k-100k, 100.6% for AGIs $100k-200k, 1317.5% for AGIs over 200k)
Taxes paid: $5,937 (reported on 1.0% of returns)
78521:
$5,937
State:
$7,821
(% of AGI for various income ranges: 0.4% for AGIs below $25k, 4.0% for AGIs $25k-50k, 12.3% for AGIs $50k-75k, 27.2% for AGIs $75k-100k, 75.6% for AGIs $100k-200k, 758.8% for AGIs over 200k)
Earned income credit: $3,091 (reported on 41.4% of returns)
Here:
$3,091
State:
$2,584
(% of AGI for various income ranges: 208.9% for AGIs below $25k, 135.7% for AGIs $25k-50k, 3.1% for AGIs $50k-75k)
Percentage of individuals using paid preparers for their 2020 taxes: 93.0%
Here:
93%
State:
92%
(% for various income ranges: 92.1% for AGIs below $25k, 94.8% for AGIs $25k-50k, 93.1% for AGIs $50k-75k, 91.9% for AGIs $75k-100k, 93.3% for AGIs $100k-200k, 93.3% for AGIs over 200k)
Averages for the 2012 tax year for zip code 78521, filed in 2013:
Average Adjusted Gross Income (AGI) in 2012: $28,649 (Individual Income Tax Returns)
Here:
$28,649
State:
$65,384
Salary/wage: $26,210 (reported on 86.8% of returns)
Here:
$26,210
State:
$52,524
(% of AGI for various income ranges: 77.8% for AGIs below $25k, 88.5% for AGIs $25k-50k, 87.5% for AGIs $50k-75k, 85.0% for AGIs $75k-100k, 76.6% for AGIs $100k-200k, 36.6% for AGIs over 200k)
Taxable interest for individuals: $1,958 (reported on 7.8% of returns)
This zip code:
$1,958
Texas:
$2,372
(% of AGI for various income ranges: 0.2% for AGIs below $25k, 0.2% for AGIs $25k-50k, 0.4% for AGIs $50k-75k, 0.3% for AGIs $75k-100k, 1.0% for AGIs $100k-200k, 2.8% for AGIs over 200k)
Ordinary dividends: $8,738 (reported on 2.4% of returns)
Here:
$8,738
State:
$9,721
(% of AGI for various income ranges: 0.1% for AGIs below $25k, 0.2% for AGIs $25k-50k, 0.3% for AGIs $50k-75k, 0.5% for AGIs $75k-100k, 1.1% for AGIs $100k-200k, 5.3% for AGIs over 200k)
Net capital gain/loss in AGI: +$12,121 (reported on 2.1% of returns)
Here:
+$12,121
State:
+$35,319
(% of AGI for various income ranges: 0.4% for AGIs $50k-75k, 0.3% for AGIs $75k-100k, 1.2% for AGIs $100k-200k, 7.9% for AGIs over 200k)
Profit/loss from business: +$9,927 (reported on 20.9% of returns)
Here:
+$9,927
State:
+$13,732
(% of AGI for various income ranges: 16.2% for AGIs below $25k, 3.0% for AGIs $25k-50k, 1.9% for AGIs $50k-75k, 1.7% for AGIs $75k-100k, 3.4% for AGIs $100k-200k, 9.3% for AGIs over 200k)
Taxable individual retirement arrangement distribution: $11,435 (reported on 1.9% of returns)
78521:
$11,435
Texas:
$19,511
(% of AGI for various income ranges: 0.3% for AGIs below $25k, 0.6% for AGIs $25k-50k, 0.8% for AGIs $50k-75k, 1.0% for AGIs $75k-100k, 1.7% for AGIs $100k-200k, 1.3% for AGIs over 200k)
Self-employment retirement plans: $5,767 (reported on 0.2% of returns)
78521:
$5,767
Texas:
$23,938
Total itemized deductions: $19,636 (24% of AGI, reported on 7.9% of returns)
Here:
$19,636
State:
$24,724
Here:
23.8% of AGI
State:
15.9% of AGI
(% of AGI for various income ranges: 1.3% for AGIs below $25k, 5.3% for AGIs $25k-50k, 9.0% for AGIs $50k-75k, 9.5% for AGIs $75k-100k, 9.1% for AGIs $100k-200k, 4.8% for AGIs over 200k)
Charity contributions: $3,212 (reported on 5.1% of returns)
Here:
$3,212
State:
$6,808
(% of AGI for various income ranges: 0.4% for AGIs $25k-50k, 0.8% for AGIs $50k-75k, 1.1% for AGIs $75k-100k, 1.5% for AGIs $100k-200k, 0.8% for AGIs over 200k)
Taxes paid: $4,216 (reported on 7.2% of returns)
78521:
$4,216
State:
$6,921
(% of AGI for various income ranges: 0.2% for AGIs below $25k, 0.8% for AGIs $25k-50k, 1.5% for AGIs $50k-75k, 1.7% for AGIs $75k-100k, 2.4% for AGIs $100k-200k, 1.8% for AGIs over 200k)
Earned income credit: $3,121 (reported on 51.4% of returns)
Here:
$3,121
State:
$2,570
(% of AGI for various income ranges: 15.8% for AGIs below $25k, 3.1% for AGIs $25k-50k)
Percentage of individuals using paid preparers for their 2012 taxes: 68.3%
Here:
68%
State:
51%
(% for various income ranges: 68.1% for AGIs below $25k, 69.1% for AGIs $25k-50k, 66.9% for AGIs $50k-75k, 65.0% for AGIs $75k-100k, 68.3% for AGIs $100k-200k, 88.9% for AGIs over 200k)
Averages for the 2004 tax year for zip code 78521, filed in 2005:
Average Adjusted Gross Income (AGI) in 2004: $22,647 (Individual Income Tax Returns)
Here:
$22,647
State:
$47,881
Salary/wage: $20,787 (reported on 86.9% of returns)
Here:
$20,787
State:
$41,947
(% of AGI for various income ranges: 78.0% for AGIs below $10k, 83.3% for AGIs $10k-25k, 89.2% for AGIs $25k-50k, 84.8% for AGIs $50k-75k, 82.9% for AGIs $75k-100k, 50.2% for AGIs over 100k)
Taxable interest for individuals: $1,695 (reported on 10.8% of returns)
This zip code:
$1,695
Texas:
$2,255
(% of AGI for various income ranges: 0.6% for AGIs below $10k, 0.3% for AGIs $10k-25k, 0.5% for AGIs $25k-50k, 0.8% for AGIs $50k-75k, 0.8% for AGIs $75k-100k, 2.6% for AGIs over 100k)
Taxable dividends: $3,432 (reported on 3.0% of returns)
Here:
$3,432
State:
$4,261
(% of AGI for various income ranges: 0.2% for AGIs below $10k, 0.1% for AGIs $10k-25k, 0.2% for AGIs $25k-50k, 0.3% for AGIs $50k-75k, 0.4% for AGIs $75k-100k, 1.7% for AGIs over 100k)
Net capital gain/loss: +$11,050 (reported on 2.7% of returns)
Here:
+$11,050
State:
+$16,110
(% of AGI for various income ranges: 0.2% for AGIs below $10k, 0.1% for AGIs $10k-25k, 0.3% for AGIs $25k-50k, 0.7% for AGIs $50k-75k, 1.2% for AGIs $75k-100k, 7.0% for AGIs over 100k)
Profit/loss from business: +$8,980 (reported on 20.2% of returns)
Here:
+$8,980
State:
+$11,013
(% of AGI for various income ranges: 23.5% for AGIs below $10k, 11.7% for AGIs $10k-25k, 3.2% for AGIs $25k-50k, 3.0% for AGIs $50k-75k, 3.5% for AGIs $75k-100k, 8.2% for AGIs over 100k)
IRA payment deduction: $2,842 (reported on 0.6% of returns)
78521:
$2,842
Texas:
$3,120
(% of AGI for various income ranges: 0.0% for AGIs $10k-25k, 0.1% for AGIs $25k-50k, 0.1% for AGIs $50k-75k, 0.1% for AGIs $75k-100k, 0.2% for AGIs over 100k)
Self-employed pension: $18,810 (reported on 0.1% of returns)
Here:
$18,810
Texas:
$16,401
Total itemized deductions: $17,063 (24% of AGI, reported on 6.0% of returns)
Here:
$17,063
State:
$19,631
Here:
24.3% of AGI
State:
18.9% of AGI
(% of AGI for various income ranges: 0.8% for AGIs below $10k, 1.1% for AGIs $10k-25k, 5.7% for AGIs $25k-50k, 8.2% for AGIs $50k-75k, 8.9% for AGIs $75k-100k, 6.5% for AGIs over 100k)
Charity contributions deductions: $2,928 (4% of AGI, reported on 4.6% of returns)
Here:
$2,928
State:
$4,753
Here:
3.9% of AGI
State:
4.2% of AGI
(% of AGI for various income ranges: 0.1% for AGIs below $10k, 0.1% for AGIs $10k-25k, 0.5% for AGIs $25k-50k, 1.0% for AGIs $50k-75k, 1.4% for AGIs $75k-100k, 1.4% for AGIs over 100k)
Total tax: $3,305 (reported on 49.7% of returns)
78521:
$3,305
State:
$9,058
(% of AGI for various income ranges: 4.2% for AGIs below $10k, 2.9% for AGIs $10k-25k, 4.3% for AGIs $25k-50k, 7.9% for AGIs $50k-75k, 10.4% for AGIs $75k-100k, 21.5% for AGIs over 100k)
Earned income credit: $2,500 (reported on 56.6% of returns)
Here:
$2,500
State:
$2,024
Percentage of individuals using paid preparers for their 2004 taxes: 76.9%
Here:
77%
State:
57%
(% for various income ranges: 75.4% for AGIs below $10k, 81.5% for AGIs $10k-25k, 72.6% for AGIs $25k-50k, 63.3% for AGIs $50k-75k, 64.7% for AGIs $75k-100k, 73.9% for AGIs over 100k)
Likely homosexual households (counted as self-reported same-sex unmarried-partner households)
Lesbian couples: 0.0% of all households
Gay men: 0.0% of all households
Household received Food Stamps/SNAP in the past 12 months: 9,980 Household did not receive Food Stamps/SNAP in the past 12 months: 18,467
Women who had a birth in the past 12 months: 1,274 (678 now married, 584 unmarried) Women who did not have a birth in the past 12 months: 20,494 (8,968 now married, 11,527 unmarried)
Housing units in zip code 78521 with a mortgage: 5,063 (50 second mortgage, 14 home equity loan, 28 both second mortgage and home equity loan) Houses without a mortgage: 27
Median monthly owner costs for units with a mortgage: $1,100 Median monthly owner costs for units without a mortgage: $398
Residents with income below the poverty level in 2022:
This zip code:
31.3%
Whole state:
14.0%
Residents with income below 50% of the poverty level in 2022:
This zip code:
18.7%
Whole state:
7.4%
Median number of rooms in houses and condos:
Here:
5.2
State:
6.3
Median number of rooms in apartments:
Here:
3.9
State:
4.0
Notable locations in this zip code not listed on our city pages
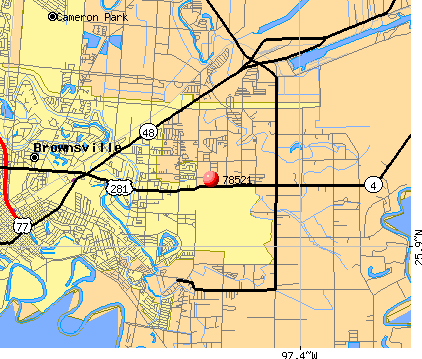
Notable locations in zip code 78521: Los Sauces Ranch (A), Old Palmito Ranch (B), Old Tulosa Ranch Site (C), Palmito Hill Battlefield (D), Palmito Ranch (E), Brulay Plantation (F), English Farms (G), Palmito Ranch Battlefield (H), Nogales Ranch (I), Old San Joaquin Ranch (J), Southmost Ranch (K), Brownsville Fire Department Station 3 (L), Brownsville Fire Department Station 5 (M), Brownsville Fire Department Station 6 (N), Brownsville Fire Department Station 8 (O), Brownsville Police Department (P), Brownsville Independent School District Police Department (Q), Valley Baptist Inpatient Behavioral Health Facility (R). Display/hide their locations on the map
Churches in zip code 78521 include: The Church of Jesus Christ of Latter Day Saints (A), Shepherd of the Valley Lutheran Church (B), Church of Christ (C), Portway Baptist Church (D), First Mexican Baptist Church (E), Brownsville Missionary Baptist Church (F), Seventh Day Adventist Church (G). Display/hide their locations on the map
Parks in zip code 78521 include: Las Palomas Wildlife Management Area - Voshell Unit (1), Las Palomas Wildlife Management Area - Boca Chica Unit (2), Portway Acres Park (3), Morningside Park (4), Tony Gonzales Park (5), Battle of Palmito Hill Historical Monument (6), Historical Monument (7), Lincoln Park (8), Victoria Park (9). Display/hide their locations on the map
11,247 married couples with children.
9,400 single-parent households (1,580 men, 7,820 women).
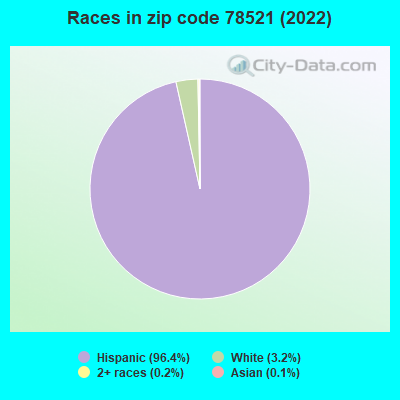
11.6% of residents of 78521 zip code speak English at home.
87.8% of residents speak Spanish at home (64% very well, 10% well, 11% not well, 15% not at all).
0.2% of residents speak other Indo-European language at home (74% very well, 22% well, 4% not at all).
0.1% of residents speak Asian or Pacific Island language at home (46% very well, 54% well).
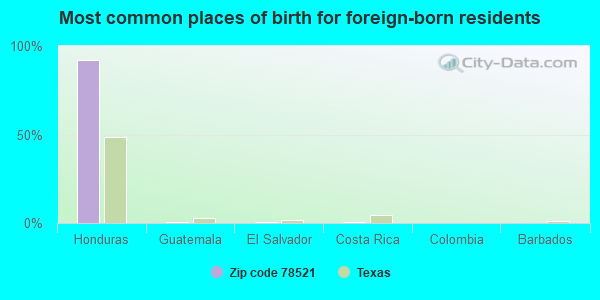
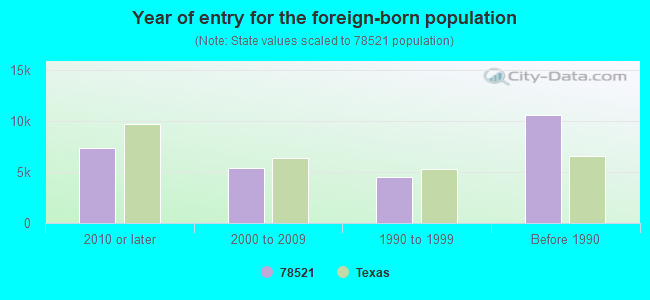
Foreign born population: 26,841 (30.0%) (35.4% of them are naturalized citizens)
This zip code:
30.0%
Whole state:
17.2%
92%Honduras
1%Guatemala
1%El Salvador
0%Costa Rica
0%Colombia
0%Barbados
0%Guyana
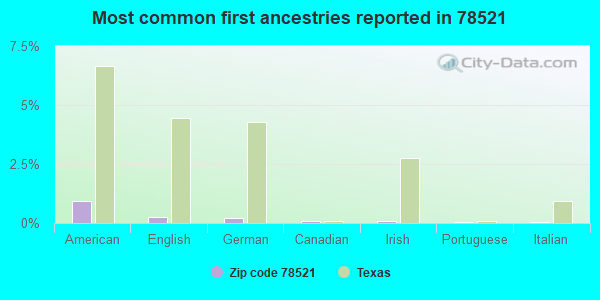
1%American
0%English
0%German
0%Canadian
0%Irish
0%Portuguese
0%Italian
Year of entry for the foreign-born population
7,3662010 or later
5,4042000 to 2009
4,5561990 to 1999
10,599Before 1990
Facilities with environmental interests located in this zip code:
AUTO TRIM DE MEXICO (4402 AUSTIN RD STE B in BROWNSVILLE, TX)
ENFORCEMENT/COMPLIANCE ACTIVITY (Integrated Compliance Information System) - ICIS-06-1996-0338, FORMAL ENFORCEMENT ACTION (Integrated Compliance Information System) - ICIS-06-1996-0338, FORMAL ENFORCEMENT ACTION (Resource Conservation and Recovery Act (tracking hazardous waste)) Business SIC classification: MOTOR VEHICLE SUPPLIES AND NEW PARTS
511 AUTO & TRUCK SALVAGE (4275 FM 511 in BROWNSVILLE, TX)
(Integrated Compliance Information System) - ICIS-06-2000-0065, FORMAL ENFORCEMENT ACTION National Pollutant Discharge Elimination System NON-MAJOR (Tracking pollutant discharge elimination systems) - permit Business SIC classification: MOTOR VEHICLE PARTS, USED
AKZO NOBEL TRANSPORTATION COATINGS INCORPORATED (200 YARD ROAD in BROWNSVILLE, TX)
CRITERIA AND HAZARDOUS AIR POLLUTANT INVENTORY (Inventory of air pollution sources) HAZARDOUS WASTE BIENNIAL REPORTER (Resource Conservation and Recovery Act (tracking hazardous waste)) (Resource Conservation and Recovery Act (tracking hazardous waste)) TRI REPORTER (Tracking of toxic chemicals releasing facilities) Business SIC classification: PAINTS, VARNISHES, LACQUERS, ENAMELS, AND ALLIED PRODUCTS Business NAICS classification: PAINT AND COATING MANUFACTURING. Organizations: AKZO NOBEL TRANSPORTATION COATING INC (CONTACT/OPERATOR)
Alternative names: DEXTER CORP., POTTER PAINT CO OF TEXAD INC, POTTER PAINT COMPANY OF TEXAS INCORPORATED
A A CHAMPION (4750 BOWIE RD in BROWNSVILLE, TX)
(National Center for Education Statistics) - STATE ID-031901136 Organizations: BROWNSVILLE ISD (SCHOOL DISTRICT)
A X BENAVIDES ELEMENTARY (3101 MCALLEN RD in BROWNSVILLE, TX)
(National Center for Education Statistics) - STATE ID-031901135 Organizations: BROWNSVILLE ISD (SCHOOL DISTRICT)
AUSTIN POWDER COMPANY (901 CANTU ROAD in BROWNSVILLE, TX)
Small Quantity Generators, between 100 kg and 1000 kg of hazardous waste/month (Resource Conservation and Recovery Act (tracking hazardous waste)) - notification Alternative names: AUSTIN STAR DETONATOR CO
AGENCIA ADUANAL PEDRO BER (3543 E 14TH STREET SUITE G in BROWNSVILLE, TX)
(Resource Conservation and Recovery Act (tracking hazardous waste)) Alternative names: AGENCIA ADUANAL PEDRO BERMUDEZ H
AMER-LIQUID (2020 N CENTRAL AVE in BROWNSVILLE, TX)
(Resource Conservation and Recovery Act (tracking hazardous waste))
BALDWIN WASTE OIL CO (STATE HIGHWAY 48 in BROWNSVILLE, TX)
(Resource Conservation and Recovery Act (tracking hazardous waste))
ADVANTAGE PAINT & BODY (4614 N EXPRESSWAY BLDG B in BROWNSVILLE, TX)
Conditionally Exempt Small Quantity Generators, less than 100 kg/month of hazardous waste (Resource Conservation and Recovery Act (tracking hazardous waste)) - notification Organizations: MILTON WHITE (CONTACT/OWNER)
Housing units lacking complete plumbing facilities: 1.6% Housing units lacking complete kitchen facilities: 1.3%
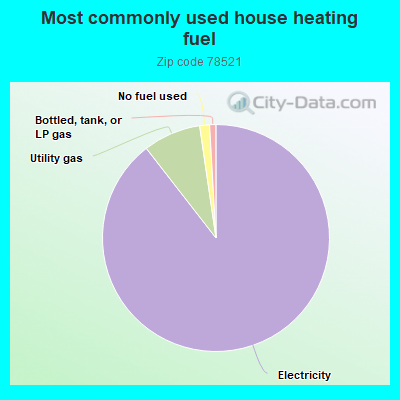
89.4%Electricity
8.2%Utility gas
1.4%No fuel used
0.9%Bottled, tank, or LP gas
Population in 1990: 79,463. Population change in the 1990s: +5,022 (+6.3%).
Place of birth for U.S.-born residents:
This state: 55,158
Northeast: 726
Midwest: 1,651
South: 1,861
West: 1,026
63% of the 78521 zip code residents lived in the same house 5 years ago. Out of people who lived in different houses, 84% lived in this county. Out of people who lived in different counties, 50% lived in Texas.
92% of the 78521 zip code residents lived in the same house 1 year ago. Out of people who lived in different houses, 63% moved from this county. Out of people who lived in different houses, 17% moved from different county within same state. Out of people who lived in different houses, 7% moved from different state. Out of people who lived in different houses, 13% moved from abroad.
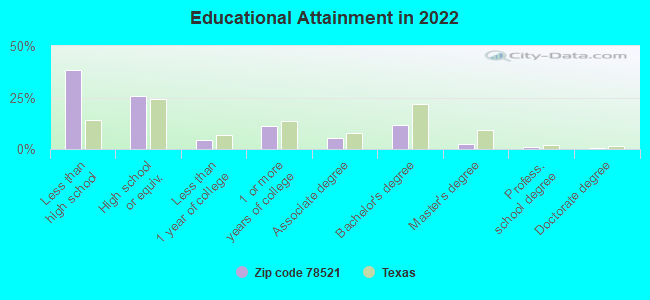
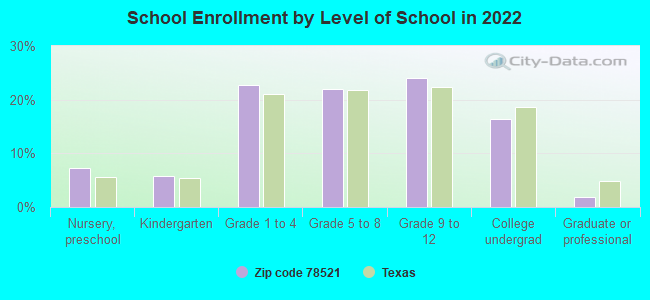
Private vs. public school enrollment:
Students in private schools in grades 1 to 8 (elementary and middle school): 372
Here:
3.2%
Texas:
8.8%
Students in private schools in grades 9 to 12 (high school): 387
Here:
6.1%
Texas:
8.0%
Students in private undergraduate colleges: 247
Here:
5.8%
Texas:
16.2%
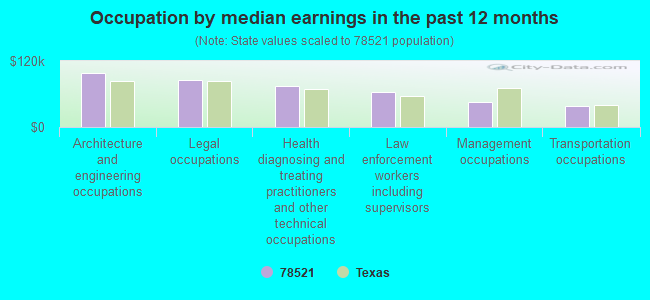
Occupation by median earnings in the past 12 months ($)
98,574Architecture and engineering occupations
85,106Legal occupations
74,012Health diagnosing and treating practitioners and other technical occupations
63,743Law enforcement workers including supervisors
44,623Management occupations
38,793Transportation occupations
Companies with federal contracts located in this zip code (BROWNSVILLE, TX):
NATIONAL ELECTRIC COIL COMPANY (3330 E 14TH ST) : $1,926,517 in 3 contractsin 2000
$1,766,000 with U.S. Army Corps of Engineers - civil program financing only for Generators and Generators Sets, Electrical. Signed on 2000-01-24. Completion date: 2000-07-10.
$100,517, same as above.Signed on 2000-08-30. Completion date: 2000-07-10.
$60,000, same as above.Signed on 2000-06-12. Completion date: 2000-07-10.
FLORES, JUANITA (700 PAREDES AVE STE108; small business) : $1,844,474 in 20 contractsfrom 2002 to 2004
Contracts for Construction of Structures and Facilities -- Hospitals and Infirmaries, Maintenance, Repair and Rebuilding of Equipment -- Refrigeration, Air Conditioning, and Air Circulating Equipment, Engineering and Technical Services, Refrigeration Equipment, and moreby Department of Veterans Affairs, Army, National Oceanic and Atmospheric Administration/Under Secretary for Oceans and Atmosphere, Air Force, and others Signed by year:2000: $0; 2001: $0; 2002: $353,727; 2003: $1,197,902; 2004: $292,845; 2005: $0; 2006: $0.
Biggest contracts:
$901,831 with Department of Veterans Affairs for Construction of Structures and Facilities -- Hospitals and Infirmaries. Taking place in NY. Signed on 2003-09-15. Completion date: 2004-07-15.
$203,000 with Department of Veterans Affairs for Maintenance, Repair and Rebuilding of Equipment -- Refrigeration, Air Conditioning, and Air Circulating Equipment. Taking place in NY. Signed on 2002-07-15. Completion date: 2006-07-15.
$183,600, same as above.Signed on 2003-10-01. Completion date: 2004-09-30.
$183,600 with Department of Veterans Affairs for Engineering and Technical Services. Taking place in NY. Signed on 2003-06-15. Completion date: 2006-07-15.
BROWNSVILLE AIR CENTER INC (455 S MINNESOTA AVE; small business) : $428,723 in 2 contractsfrom 2001 to 2003
$293,045 with Defense Logistics Agency for Liquid Propellants and Fuels, Petroleum Base. Signed on 2001-05-24. Completion date: 2004-05-31.
$135,678, same as above.Signed on 2003-11-19. Completion date: 2007-03-31.
R & I ENTERPRISES INC (233 PAREDES LINE RD; small business) : $235,673 in 32 contractsfrom 2004 to 2006
Contracts for Nails, Machine Keys, and Pins, Nuts and Washers, Inspection Gages and Precision Layout Tools, Fastening Device, and moreby Defense Logistics Agency Signed by year:2000: $0; 2001: $0; 2002: $0; 2003: $0; 2004: $59,974; 2005: $126,021; 2006: $49,678.
Biggest contracts:
$32,505 with Defense Logistics Agency for Nails, Machine Keys, and Pins. Signed on 2005-01-16. Completion date: 2005-01-21.
$25,300, same as above.Signed on 2004-08-20. Completion date: 2004-08-25.
$21,150, same as above.Signed on 2005-09-20. Completion date: 2006-01-19.
$15,760, same as above.Signed on 2005-05-12. Completion date: 2005-09-10.
TRICO PRODUCTS CORPORATION (1900 BILLY MITCHELL BLVD)
$35,875 with Defense Logistics Agency for Vehicular Furniture and Accessories. Taking place in NY. Signed on 2003-11-13. Completion date: 2003-11-13.
JUAN REYES LAWN SERVICE (3355 ELSA AVE; small business) : $2,700 in 2 contractsin 2002
$2,700 with U.S. Army Corps of Engineers - civil program financing only for Landscaping/Groundskeeping Services. Signed on 2002-10-11. Completion date: 2004-10-19.
$0, same as above.Signed on 2002-10-11. Completion date: 2004-10-19.
Top industries in this zip code by the number of employees in 2005:
Health Care and Social Assistance: Home Health Care Services (500-999 employees: 2 establishments, 100-249 employees: 5 establishments, 50-99 employees: 1 establishment, 20-49 employees: 1 establishment, 1-4 employees: 4 establishments)
Other Services (except Public Administration): Commercial and Industrial Machinery and Equipment (except Automotive and Electronic) Repair and Maintenance (250-499: 1, 5-9: 1, 1-4: 2)
People in group quarters in 2010:
75 people in nursing facilities/skilled-nursing facilities
53 people in emergency and transitional shelters (with sleeping facilities) for people experiencing homelessness
37 people in group homes for juveniles (non-correctional)
26 people in other noninstitutional facilities
19 people in mental (psychiatric) hospitals and psychiatric units in other hospitals
People in group quarters in 2000:
112 people in nursing homes
63 people in other noninstitutional group quarters
6 people in homes for the mentally retarded
2 people in religious group quarters
Fatal accident statistics in 2014:
Fatal accident count: 5
Vehicles involved in fatal accidents: 10
Fatal accidents caused by drunken drivers: 0
Fatalities: 5
Persons involved in fatal accidents: 15
Pedestrians involved in fatal accidents: 2
Fatal accident statistics in 2013:
Fatal accident count: 3
Vehicles involved in fatal accidents: 4
Fatal accidents caused by drunken drivers: 1
Fatalities: 3
Persons involved in fatal accidents: 5
Pedestrians involved in fatal accidents: 2
Home Mortgage Disclosure Act Aggregated Statistics For Year 2009 (Based on 28 full and 10 partial tracts)
A) FHA, FSA/RHS & VA Home Purchase Loans
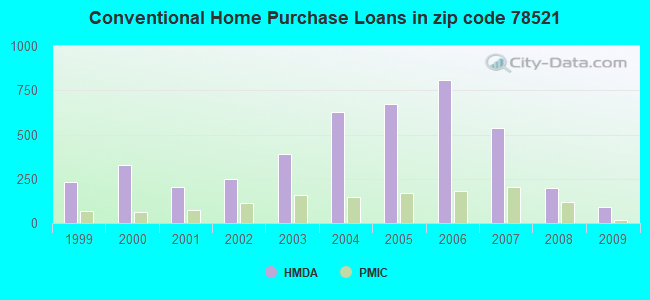
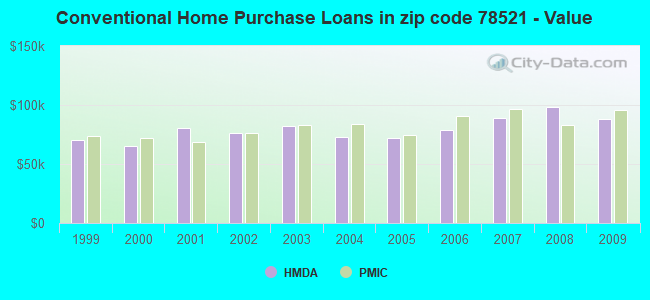
B) Conventional Home Purchase Loans
C) Refinancings
D) Home Improvement Loans
E) Loans on Dwellings For 5+ Families
F) Non-occupant Loans on < 5 Family Dwellings (A B C & D)
G) Loans On Manufactured Home Dwelling (A B C & D)
Number
Average Value
Number
Average Value
Number
Average Value
Number
Average Value
Number
Average Value
Number
Average Value
Number
Average Value
LOANS ORIGINATED
186
$86,593
88
$87,956
206
$105,821
83
$26,565
3
$246,000
38
$79,884
5
$30,448
APPLICATIONS APPROVED, NOT ACCEPTED
15
$94,075
13
$77,132
72
$84,162
23
$26,861
0
$0
5
$111,128
2
$41,985
APPLICATIONS DENIED
20
$103,873
54
$81,090
431
$63,634
375
$29,510
0
$0
45
$74,290
14
$46,057
APPLICATIONS WITHDRAWN
21
$103,713
10
$131,961
107
$70,288
43
$42,773
0
$0
11
$39,906
4
$75,208
FILES CLOSED FOR INCOMPLETENESS
7
$121,693
7
$63,374
20
$100,070
24
$29,425
0
$0
5
$66,558
1
$35,900
Aggregated Statistics For Year 2008 (Based on 28 full and 10 partial tracts)
A) FHA, FSA/RHS & VA Home Purchase Loans
B) Conventional Home Purchase Loans
C) Refinancings
D) Home Improvement Loans
E) Loans on Dwellings For 5+ Families
F) Non-occupant Loans on < 5 Family Dwellings (A B C & D)
G) Loans On Manufactured Home Dwelling (A B C & D)
Number
Average Value
Number
Average Value
Number
Average Value
Number
Average Value
Number
Average Value
Number
Average Value
Number
Average Value
LOANS ORIGINATED
154
$86,310
198
$98,175
239
$76,014
161
$24,843
11
$921,011
64
$98,226
4
$46,250
APPLICATIONS APPROVED, NOT ACCEPTED
20
$79,596
43
$121,869
118
$72,329
59
$33,317
0
$0
17
$52,260
9
$44,692
APPLICATIONS DENIED
34
$88,878
119
$102,544
730
$68,015
538
$26,099
3
$286,590
69
$69,547
19
$40,072
APPLICATIONS WITHDRAWN
18
$83,357
26
$101,671
166
$87,324
59
$38,507
0
$0
16
$74,899
2
$51,000
FILES CLOSED FOR INCOMPLETENESS
7
$66,666
7
$87,281
43
$78,584
23
$53,330
0
$0
14
$74,719
0
$0
Aggregated Statistics For Year 2007 (Based on 28 full and 10 partial tracts)
A) FHA, FSA/RHS & VA Home Purchase Loans
B) Conventional Home Purchase Loans
C) Refinancings
D) Home Improvement Loans
E) Loans on Dwellings For 5+ Families
F) Non-occupant Loans on < 5 Family Dwellings (A B C & D)
G) Loans On Manufactured Home Dwelling (A B C & D)
Number
Average Value
Number
Average Value
Number
Average Value
Number
Average Value
Number
Average Value
Number
Average Value
Number
Average Value
LOANS ORIGINATED
98
$81,046
535
$88,980
450
$82,911
233
$26,035
9
$1,364,177
98
$71,127
8
$33,352
APPLICATIONS APPROVED, NOT ACCEPTED
7
$73,094
160
$75,758
170
$68,423
73
$32,092
0
$0
37
$59,305
4
$35,312
APPLICATIONS DENIED
32
$92,114
333
$73,821
1,049
$71,647
652
$23,482
1
$210,000
175
$51,323
19
$25,867
APPLICATIONS WITHDRAWN
9
$96,141
111
$77,446
426
$76,911
113
$35,015
0
$0
37
$57,291
5
$23,400
FILES CLOSED FOR INCOMPLETENESS
2
$160,340
52
$94,179
131
$105,033
16
$34,841
0
$0
8
$120,795
0
$0
Aggregated Statistics For Year 2006 (Based on 28 full and 10 partial tracts)
A) FHA, FSA/RHS & VA Home Purchase Loans
B) Conventional Home Purchase Loans
C) Refinancings
D) Home Improvement Loans
E) Loans on Dwellings For 5+ Families
F) Non-occupant Loans on < 5 Family Dwellings (A B C & D)
G) Loans On Manufactured Home Dwelling (A B C & D)
Number
Average Value
Number
Average Value
Number
Average Value
Number
Average Value
Number
Average Value
Number
Average Value
Number
Average Value
LOANS ORIGINATED
118
$71,907
807
$78,559
549
$77,960
230
$30,413
9
$554,967
169
$61,911
7
$27,667
APPLICATIONS APPROVED, NOT ACCEPTED
11
$96,344
241
$77,133
226
$95,363
73
$30,434
5
$539,302
25
$83,105
8
$35,026
APPLICATIONS DENIED
22
$95,441
469
$83,966
981
$92,234
457
$25,127
0
$0
161
$54,079
19
$28,581
APPLICATIONS WITHDRAWN
7
$71,284
137
$74,646
415
$76,320
67
$34,665
0
$0
34
$58,974
0
$0
FILES CLOSED FOR INCOMPLETENESS
0
$0
62
$92,763
99
$123,438
8
$33,978
0
$0
21
$139,929
2
$72,295
Aggregated Statistics For Year 2005 (Based on 28 full and 10 partial tracts)
A) FHA, FSA/RHS & VA Home Purchase Loans
B) Conventional Home Purchase Loans
C) Refinancings
D) Home Improvement Loans
E) Loans on Dwellings For 5+ Families
F) Non-occupant Loans on < 5 Family Dwellings (A B C & D)
G) Loans On Manufactured Home Dwelling (A B C & D)
Number
Average Value
Number
Average Value
Number
Average Value
Number
Average Value
Number
Average Value
Number
Average Value
Number
Average Value
LOANS ORIGINATED
146
$74,087
670
$71,771
695
$68,435
247
$34,674
8
$220,015
161
$67,206
10
$36,121
APPLICATIONS APPROVED, NOT ACCEPTED
10
$58,616
221
$66,701
261
$57,159
91
$31,777
0
$0
35
$56,665
6
$36,190
APPLICATIONS DENIED
10
$99,237
418
$68,727
1,192
$60,907
501
$25,370
6
$270,195
179
$56,713
20
$30,316
APPLICATIONS WITHDRAWN
9
$66,209
245
$79,961
451
$74,476
153
$113,417
0
$0
68
$66,375
5
$38,884
FILES CLOSED FOR INCOMPLETENESS
3
$103,000
30
$76,115
170
$103,595
9
$64,560
0
$0
11
$75,794
0
$0
Aggregated Statistics For Year 2004 (Based on 28 full and 10 partial tracts)
A) FHA, FSA/RHS & VA Home Purchase Loans
B) Conventional Home Purchase Loans
C) Refinancings
D) Home Improvement Loans
E) Loans on Dwellings For 5+ Families
F) Non-occupant Loans on < 5 Family Dwellings (A B C & D)
G) Loans On Manufactured Home Dwelling (A B C & D)
Number
Average Value
Number
Average Value
Number
Average Value
Number
Average Value
Number
Average Value
Number
Average Value
Number
Average Value
LOANS ORIGINATED
218
$68,650
627
$72,571
779
$69,805
194
$24,356
17
$179,035
139
$55,535
18
$32,762
APPLICATIONS APPROVED, NOT ACCEPTED
9
$59,814
349
$75,182
308
$78,523
65
$29,731
1
$101,490
43
$89,256
22
$26,227
APPLICATIONS DENIED
28
$80,429
385
$74,161
1,146
$60,858
438
$24,010
2
$316,720
120
$55,879
61
$25,915
APPLICATIONS WITHDRAWN
17
$86,303
138
$95,279
508
$68,016
51
$35,797
0
$0
41
$64,021
1
$71,000
FILES CLOSED FOR INCOMPLETENESS
0
$0
40
$72,023
144
$78,322
4
$39,192
0
$0
9
$56,290
0
$0
Aggregated Statistics For Year 2003 (Based on 28 full and 10 partial tracts)
A) FHA, FSA/RHS & VA Home Purchase Loans
B) Conventional Home Purchase Loans
C) Refinancings
D) Home Improvement Loans
E) Loans on Dwellings For 5+ Families
F) Non-occupant Loans on < 5 Family Dwellings (A B C & D)
Number
Average Value
Number
Average Value
Number
Average Value
Number
Average Value
Number
Average Value
Number
Average Value
LOANS ORIGINATED
263
$69,246
389
$81,954
880
$70,944
122
$16,862
7
$215,663
121
$69,998
APPLICATIONS APPROVED, NOT ACCEPTED
20
$80,150
92
$83,293
214
$68,174
24
$25,009
0
$0
40
$59,671
APPLICATIONS DENIED
51
$78,199
200
$72,387
1,066
$53,250
307
$14,148
1
$54,000
99
$44,229
APPLICATIONS WITHDRAWN
22
$86,223
94
$75,458
555
$45,648
12
$40,633
0
$0
29
$49,720
FILES CLOSED FOR INCOMPLETENESS
3
$72,333
6
$56,642
39
$71,497
8
$60,409
0
$0
2
$48,500
Aggregated Statistics For Year 2002 (Based on 13 full and 4 partial tracts)
A) FHA, FSA/RHS & VA Home Purchase Loans
B) Conventional Home Purchase Loans
C) Refinancings
D) Home Improvement Loans
E) Loans on Dwellings For 5+ Families
F) Non-occupant Loans on < 5 Family Dwellings (A B C & D)
Number
Average Value
Number
Average Value
Number
Average Value
Number
Average Value
Number
Average Value
Number
Average Value
LOANS ORIGINATED
65
$75,059
247
$76,580
326
$68,650
41
$13,059
1
$190,000
42
$47,214
APPLICATIONS APPROVED, NOT ACCEPTED
12
$74,524
31
$76,877
72
$62,636
11
$13,971
0
$0
5
$52,640
APPLICATIONS DENIED
33
$74,285
93
$66,965
311
$53,606
129
$12,774
1
$190,000
41
$37,955
APPLICATIONS WITHDRAWN
3
$67,667
26
$51,233
125
$54,398
4
$6,500
0
$0
5
$80,200
FILES CLOSED FOR INCOMPLETENESS
0
$0
9
$49,078
28
$62,095
0
$0
0
$0
1
$54,000
Aggregated Statistics For Year 2001 (Based on 13 full and 4 partial tracts)
A) FHA, FSA/RHS & VA Home Purchase Loans
B) Conventional Home Purchase Loans
C) Refinancings
D) Home Improvement Loans
E) Loans on Dwellings For 5+ Families
F) Non-occupant Loans on < 5 Family Dwellings (A B C & D)
Number
Average Value
Number
Average Value
Number
Average Value
Number
Average Value
Number
Average Value
Number
Average Value
LOANS ORIGINATED
71
$68,813
203
$80,357
247
$64,115
68
$8,986
2
$3,210,000
43
$37,503
APPLICATIONS APPROVED, NOT ACCEPTED
10
$68,516
50
$62,800
64
$52,581
13
$19,855
0
$0
11
$58,151
APPLICATIONS DENIED
17
$74,313
124
$49,783
335
$51,680
147
$11,971
0
$0
31
$37,560
APPLICATIONS WITHDRAWN
8
$69,284
93
$74,635
164
$50,305
10
$11,723
0
$0
6
$71,000
FILES CLOSED FOR INCOMPLETENESS
5
$97,096
12
$67,740
27
$54,329
2
$19,785
0
$0
0
$0
Aggregated Statistics For Year 2000 (Based on 13 full and 4 partial tracts)
A) FHA, FSA/RHS & VA Home Purchase Loans
B) Conventional Home Purchase Loans
C) Refinancings
D) Home Improvement Loans
E) Loans on Dwellings For 5+ Families
F) Non-occupant Loans on < 5 Family Dwellings (A B C & D)
Number
Average Value
Number
Average Value
Number
Average Value
Number
Average Value
Number
Average Value
Number
Average Value
LOANS ORIGINATED
68
$65,250
329
$65,420
107
$64,871
55
$15,133
2
$102,500
45
$49,148
APPLICATIONS APPROVED, NOT ACCEPTED
6
$72,325
58
$56,458
45
$65,134
13
$19,066
0
$0
12
$72,457
APPLICATIONS DENIED
14
$56,923
235
$52,738
129
$48,318
95
$8,378
0
$0
30
$33,754
APPLICATIONS WITHDRAWN
3
$61,333
28
$51,432
56
$63,398
14
$23,576
1
$110,670
6
$70,330
FILES CLOSED FOR INCOMPLETENESS
5
$94,102
15
$54,296
35
$58,752
0
$0
0
$0
9
$44,350
Aggregated Statistics For Year 1999 (Based on 13 full and 4 partial tracts)
A) FHA, FSA/RHS & VA Home Purchase Loans
B) Conventional Home Purchase Loans
C) Refinancings
D) Home Improvement Loans
E) Loans on Dwellings For 5+ Families
F) Non-occupant Loans on < 5 Family Dwellings (A B C & D)
2002 - 2018 National Fire Incident Reporting System (NFIRS) incidents
Based on the data from the years 2002 - 2018 the average number of fires per year is 216. The highest number of reported fires - 437 took place in 2005, and the least - 2 in 2012. The data has a dropping trend.
When looking into fire subcategories, the most incidents belonged to: Outside Fires (51.2%), and Structure Fires (21.1%).
Fire incident types reported to NFIRS in Zip Code 78521


 Nearest zip codes: 78578, 78526, 78566, 78575, 78520, 78597.


 Based on the data from the years 2002 - 2018 the average number of fires per year is 216. The highest number of reported fires - 437 took place in 2005, and the least - 2 in 2012. The data has a dropping trend.
 When looking into fire subcategories, the most incidents belonged to: Outside Fires (51.2%), and Structure Fires (21.1%).