Estimated zip code population in 2022: 10,823 Zip code population in 2010: 12,516 Zip code population in 2000: 9,952
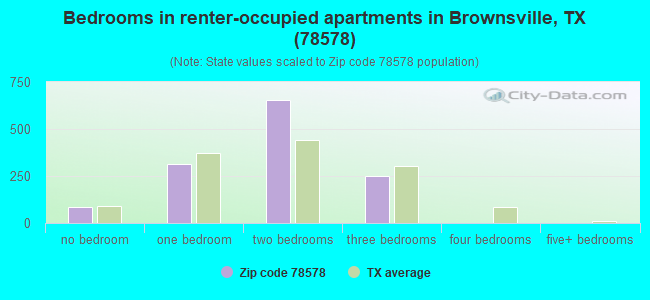
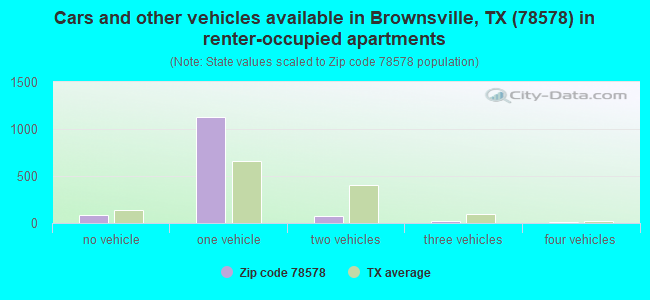
Houses and condos: 6,638 Renter-occupied apartments: 1,306
% of renters here:
30%
State:
38%
March 2022 cost of living index in zip code 78578: 80.3 (low, U.S. average is 100)
Land area: 59.9 sq. mi. Water area: 25.6 sq. mi.
Population density: 181 people per square mile
(very low).
OSM Map
General Map
Google Map
MSN Map
OSM Map
General Map
Google Map
MSN Map
OSM Map
General Map
Google Map
MSN Map
OSM Map
General Map
Google Map
MSN Map
Please wait while loading the map...
Real estate property taxes paid for housing units in 2022:
This zip code:
1.3% ($2,857)
Texas:
1.5% ($4,050)
Median real estate property taxes paid for housing units with mortgages in 2022: $4,203 (1.8%) Median real estate property taxes paid for housing units with no mortgage in 2022: $2,523 (1.4%)
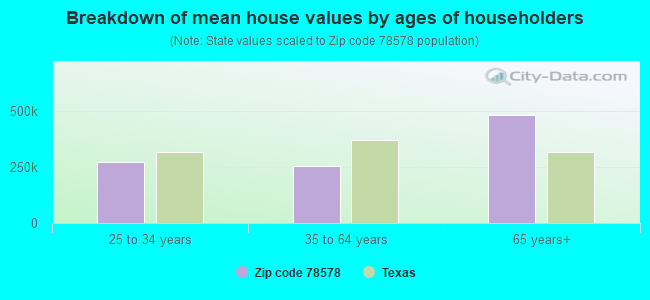
Estimated median house/condo value in 2022: $213,030
78578:
$213,030
Texas:
$275,400
According to our research of Texas and other state lists, there were 22 registered sex offenders living in 78578 zip code as of April 26, 2024. The ratio of all residents to sex offenders in zip code 78578 is 551 to 1. The ratio of registered sex offenders to all residents in this zip code is lower than the state average.
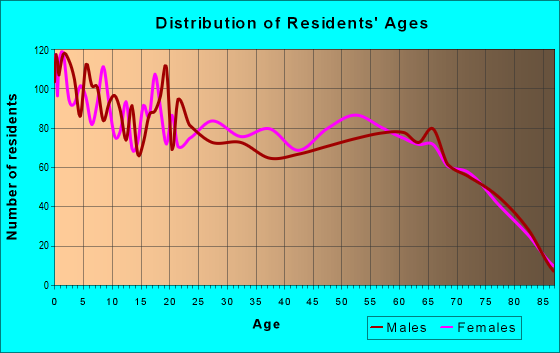
Median resident age:
This zip code:
44.6 years
Texas median age:
35.6 years
Average household size:
This zip code:
2.5 people
Texas:
2.6 people
Averages for the 2020 tax year for zip code 78578, filed in 2021:
Average Adjusted Gross Income (AGI) in 2020: $49,911 (Individual Income Tax Returns)
Here:
$49,911
State:
$77,054
Salary/wage: $38,468 (reported on 73.3% of returns)
Here:
$38,468
State:
$62,766
(% of AGI for various income ranges: 1204.2% for AGIs below $25k, 3233.6% for AGIs $25k-50k, 5218.8% for AGIs $50k-75k, 8766.1% for AGIs $75k-100k, 13196.8% for AGIs $100k-200k, 79620.0% for AGIs over 200k)
Taxable interest for individuals: $2,609 (reported on 23.0% of returns)
This zip code:
$2,609
Texas:
$2,665
(% of AGI for various income ranges: 17.4% for AGIs below $25k, 36.7% for AGIs $25k-50k, 62.1% for AGIs $50k-75k, 141.1% for AGIs $75k-100k, 495.3% for AGIs $100k-200k, 2580.0% for AGIs over 200k)
Ordinary dividends: $7,903 (reported on 14.2% of returns)
Here:
$7,903
State:
$10,044
(% of AGI for various income ranges: 23.0% for AGIs below $25k, 46.0% for AGIs $25k-50k, 129.7% for AGIs $50k-75k, 255.6% for AGIs $75k-100k, 968.4% for AGIs $100k-200k, 5626.7% for AGIs over 200k)
Net capital gain/loss in AGI: +$14,739 (reported on 14.2% of returns)
Here:
+$14,739
State:
+$39,590
(% of AGI for various income ranges: 7.7% for AGIs below $25k, 46.4% for AGIs $25k-50k, 94.7% for AGIs $50k-75k, 581.7% for AGIs $75k-100k, 1306.3% for AGIs $100k-200k, 17773.3% for AGIs over 200k)
Profit/loss from business: +$9,080 (reported on 21.3% of returns)
Here:
+$9,080
State:
+$10,888
(% of AGI for various income ranges: 163.2% for AGIs below $25k, 58.6% for AGIs $25k-50k, 148.8% for AGIs $50k-75k, 302.8% for AGIs $75k-100k, 723.7% for AGIs $100k-200k, 11393.3% for AGIs over 200k)
Taxable individual retirement arrangement distribution: $25,354 (reported on 9.9% of returns)
78578:
$25,354
Texas:
$24,740
(% of AGI for various income ranges: 46.5% for AGIs below $25k, 155.6% for AGIs $25k-50k, 370.6% for AGIs $50k-75k, 1013.3% for AGIs $75k-100k, 2298.9% for AGIs $100k-200k, 6836.7% for AGIs over 200k)
Total itemized deductions: $31,569 (reported on 3.4% of returns)
Here:
$31,569
State:
$40,428
(% of AGI for various income ranges: 90.3% for AGIs $25k-50k, 205.0% for AGIs $50k-75k, 361.7% for AGIs $75k-100k, 804.2% for AGIs $100k-200k, 4510.0% for AGIs over 200k)
Charity contributions: $9,823 (reported on 2.8% of returns)
Here:
$9,823
State:
$18,201
(% of AGI for various income ranges: 90.6% for AGIs $50k-75k, 239.5% for AGIs $100k-200k, 1713.3% for AGIs over 200k)
Taxes paid: $7,644 (reported on 3.4% of returns)
78578:
$7,644
State:
$7,821
(% of AGI for various income ranges: 18.0% for AGIs $25k-50k, 59.4% for AGIs $50k-75k, 75.0% for AGIs $75k-100k, 193.7% for AGIs $100k-200k, 1180.0% for AGIs over 200k)
Earned income credit: $2,847 (reported on 26.5% of returns)
Here:
$2,847
State:
$2,584
(% of AGI for various income ranges: 162.1% for AGIs below $25k, 99.9% for AGIs $25k-50k)
Percentage of individuals using paid preparers for their 2020 taxes: 88.8%
Here:
89%
State:
92%
(% for various income ranges: 87.8% for AGIs below $25k, 90.7% for AGIs $25k-50k, 87.8% for AGIs $50k-75k, 87.9% for AGIs $75k-100k, 92.1% for AGIs $100k-200k, 85.7% for AGIs over 200k)
Averages for the 2012 tax year for zip code 78578, filed in 2013:
Average Adjusted Gross Income (AGI) in 2012: $41,381 (Individual Income Tax Returns)
Here:
$41,381
State:
$65,384
Salary/wage: $31,204 (reported on 78.5% of returns)
Here:
$31,204
State:
$52,524
(% of AGI for various income ranges: 78.6% for AGIs below $25k, 74.9% for AGIs $25k-50k, 61.3% for AGIs $50k-75k, 56.0% for AGIs $75k-100k, 55.4% for AGIs $100k-200k, 31.7% for AGIs over 200k)
Taxable interest for individuals: $2,697 (reported on 21.7% of returns)
This zip code:
$2,697
Texas:
$2,372
(% of AGI for various income ranges: 1.3% for AGIs below $25k, 1.0% for AGIs $25k-50k, 1.3% for AGIs $50k-75k, 1.6% for AGIs $75k-100k, 2.3% for AGIs $100k-200k, 1.0% for AGIs over 200k)
Ordinary dividends: $7,000 (reported on 12.6% of returns)
Here:
$7,000
State:
$9,721
(% of AGI for various income ranges: 0.7% for AGIs below $25k, 1.3% for AGIs $25k-50k, 2.4% for AGIs $50k-75k, 2.1% for AGIs $75k-100k, 2.4% for AGIs $100k-200k, 3.7% for AGIs over 200k)
Net capital gain/loss in AGI: +$21,702 (reported on 11.0% of returns)
Here:
+$21,702
State:
+$35,319
(% of AGI for various income ranges: 0.3% for AGIs $50k-75k, 1.2% for AGIs $75k-100k, 4.5% for AGIs $100k-200k, 23.5% for AGIs over 200k)
Profit/loss from business: +$10,647 (reported on 20.5% of returns)
Here:
+$10,647
State:
+$13,732
(% of AGI for various income ranges: 11.9% for AGIs below $25k, 3.0% for AGIs $25k-50k, 4.6% for AGIs $50k-75k, 4.0% for AGIs $75k-100k, 5.8% for AGIs $100k-200k, 2.1% for AGIs over 200k)
Taxable individual retirement arrangement distribution: $18,615 (reported on 8.9% of returns)
78578:
$18,615
Texas:
$19,511
(% of AGI for various income ranges: 1.7% for AGIs below $25k, 3.5% for AGIs $25k-50k, 4.7% for AGIs $50k-75k, 5.2% for AGIs $75k-100k, 4.9% for AGIs $100k-200k, 4.5% for AGIs over 200k)
Total itemized deductions: $20,117 (19% of AGI, reported on 17.6% of returns)
Here:
$20,117
State:
$24,724
Here:
19.3% of AGI
State:
15.9% of AGI
(% of AGI for various income ranges: 3.8% for AGIs below $25k, 9.8% for AGIs $25k-50k, 11.9% for AGIs $50k-75k, 11.7% for AGIs $75k-100k, 10.3% for AGIs $100k-200k, 6.1% for AGIs over 200k)
Charity contributions: $3,053 (reported on 13.5% of returns)
Here:
$3,053
State:
$6,808
(% of AGI for various income ranges: 0.3% for AGIs below $25k, 0.9% for AGIs $25k-50k, 1.0% for AGIs $50k-75k, 1.3% for AGIs $75k-100k, 1.4% for AGIs $100k-200k, 1.2% for AGIs over 200k)
Taxes paid: $6,490 (reported on 16.7% of returns)
78578:
$6,490
State:
$6,921
(% of AGI for various income ranges: 1.0% for AGIs below $25k, 2.1% for AGIs $25k-50k, 3.1% for AGIs $50k-75k, 3.7% for AGIs $75k-100k, 3.8% for AGIs $100k-200k, 2.5% for AGIs over 200k)
Earned income credit: $2,750 (reported on 32.2% of returns)
Here:
$2,750
State:
$2,570
(% of AGI for various income ranges: 10.2% for AGIs below $25k, 1.7% for AGIs $25k-50k)
Percentage of individuals using paid preparers for their 2012 taxes: 54.3%
Here:
54%
State:
51%
(% for various income ranges: 53.5% for AGIs below $25k, 52.1% for AGIs $25k-50k, 50.0% for AGIs $50k-75k, 59.1% for AGIs $75k-100k, 65.4% for AGIs $100k-200k, 77.8% for AGIs over 200k)
Averages for the 2004 tax year for zip code 78578, filed in 2005:
Average Adjusted Gross Income (AGI) in 2004: $29,040 (Individual Income Tax Returns)
Here:
$29,040
State:
$47,881
Salary/wage: $24,078 (reported on 78.9% of returns)
Here:
$24,078
State:
$41,947
(% of AGI for various income ranges: 95.3% for AGIs below $10k, 79.5% for AGIs $10k-25k, 76.9% for AGIs $25k-50k, 66.9% for AGIs $50k-75k, 64.9% for AGIs $75k-100k, 40.8% for AGIs over 100k)
Taxable interest for individuals: $3,569 (reported on 24.9% of returns)
This zip code:
$3,569
Texas:
$2,255
(% of AGI for various income ranges: 5.5% for AGIs below $10k, 1.3% for AGIs $10k-25k, 1.9% for AGIs $25k-50k, 2.4% for AGIs $50k-75k, 3.4% for AGIs $75k-100k, 5.1% for AGIs over 100k)
Taxable dividends: $4,110 (reported on 13.5% of returns)
Here:
$4,110
State:
$4,261
(% of AGI for various income ranges: 2.9% for AGIs below $10k, 0.9% for AGIs $10k-25k, 1.8% for AGIs $25k-50k, 1.1% for AGIs $50k-75k, 2.1% for AGIs $75k-100k, 3.1% for AGIs over 100k)
Net capital gain/loss: +$10,904 (reported on 12.0% of returns)
Here:
+$10,904
State:
+$16,110
(% of AGI for various income ranges: 2.5% for AGIs below $10k, 0.3% for AGIs $10k-25k, 1.3% for AGIs $25k-50k, 2.0% for AGIs $50k-75k, 2.6% for AGIs $75k-100k, 12.6% for AGIs over 100k)
Profit/loss from business: +$6,649 (reported on 21.4% of returns)
Here:
+$6,649
State:
+$11,013
(% of AGI for various income ranges: 19.7% for AGIs below $10k, 9.1% for AGIs $10k-25k, 3.4% for AGIs $25k-50k, 3.5% for AGIs $50k-75k, 4.9% for AGIs $75k-100k, 1.5% for AGIs over 100k)
IRA payment deduction: $3,539 (reported on 2.0% of returns)
78578:
$3,539
Texas:
$3,120
(% of AGI for various income ranges: 0.2% for AGIs $10k-25k, 0.2% for AGIs $25k-50k, 0.5% for AGIs $50k-75k, 0.3% for AGIs over 100k)
Total itemized deductions: $19,194 (27% of AGI, reported on 14.8% of returns)
Here:
$19,194
State:
$19,631
Here:
26.6% of AGI
State:
18.9% of AGI
(% of AGI for various income ranges: 11.7% for AGIs below $10k, 4.2% for AGIs $10k-25k, 10.6% for AGIs $25k-50k, 14.0% for AGIs $50k-75k, 10.0% for AGIs $75k-100k, 10.7% for AGIs over 100k)
Charity contributions deductions: $3,479 (5% of AGI, reported on 11.5% of returns)
Here:
$3,479
State:
$4,753
Here:
4.7% of AGI
State:
4.2% of AGI
(% of AGI for various income ranges: 0.6% for AGIs below $10k, 0.4% for AGIs $10k-25k, 1.1% for AGIs $25k-50k, 2.0% for AGIs $50k-75k, 1.2% for AGIs $75k-100k, 2.2% for AGIs over 100k)
Total tax: $4,815 (reported on 57.3% of returns)
78578:
$4,815
State:
$9,058
(% of AGI for various income ranges: 5.1% for AGIs below $10k, 3.0% for AGIs $10k-25k, 5.6% for AGIs $25k-50k, 9.1% for AGIs $50k-75k, 11.6% for AGIs $75k-100k, 17.6% for AGIs over 100k)
Earned income credit: $2,327 (reported on 40.3% of returns)
Here:
$2,327
State:
$2,024
Percentage of individuals using paid preparers for their 2004 taxes: 58.1%
Here:
58%
State:
57%
(% for various income ranges: 54.8% for AGIs below $10k, 60.9% for AGIs $10k-25k, 54.7% for AGIs $25k-50k, 54.5% for AGIs $50k-75k, 59.9% for AGIs $75k-100k, 75.9% for AGIs over 100k)
Household received Food Stamps/SNAP in the past 12 months: 215 Household did not receive Food Stamps/SNAP in the past 12 months: 4,123
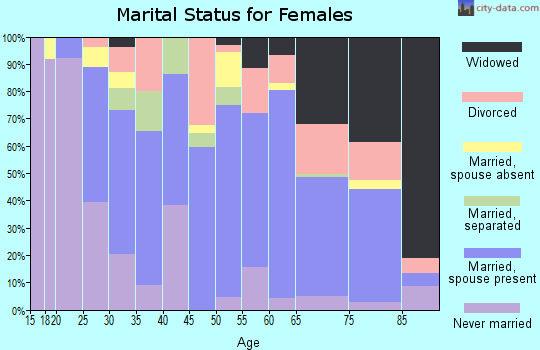
Women who had a birth in the past 12 months: 99 (71 now married, 27 unmarried) Women who did not have a birth in the past 12 months: 1,781 (1,070 now married, 701 unmarried)
Housing units in zip code 78578 with a mortgage: 1,248 (65 second mortgage, 51 both second mortgage and home equity loan) Houses without a mortgage: 18
Median monthly owner costs for units with a mortgage: $1,693 Median monthly owner costs for units without a mortgage: $512
Residents with income below the poverty level in 2022:
This zip code:
24.0%
Whole state:
14.0%
Residents with income below 50% of the poverty level in 2022:
This zip code:
14.6%
Whole state:
7.4%
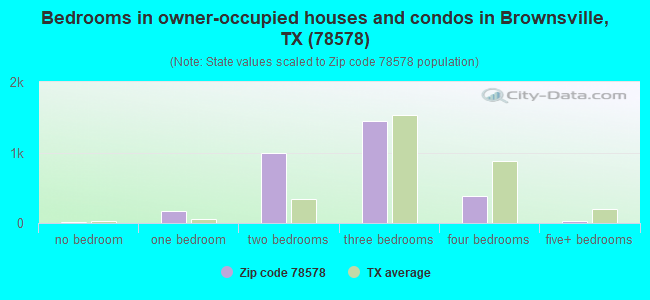
Median number of rooms in houses and condos:
Here:
5.3
State:
6.3
Median number of rooms in apartments:
Here:
4.1
State:
4.0
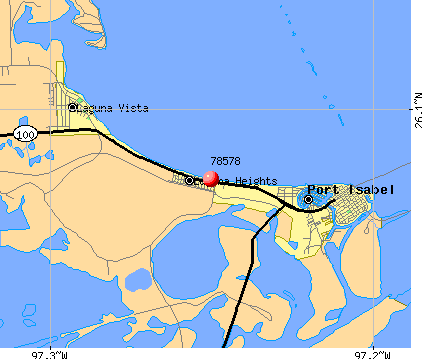
Notable locations in this zip code not listed on our city pages
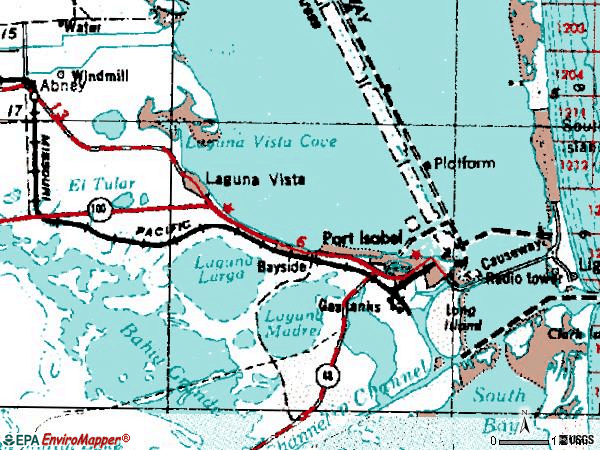
Notable locations in zip code 78578: White Sands Marina (A), Sea Ranch Marina (B), Southpoint Marina (C), Mighty Minnow Marina (D), Anchor Marina (E), Point Isabel Lighthouse (F), Holly Beach (G), Laguna Vista Volunteer Fire Department (H), Port Isabel Fire Department (I), Cameron County Sheriff's Office (J), Port Isabel Police Department (K), Laguna Vista Police Department (L), Laguna Vista Public Library (M), Port Isabel Public Library (N), Port Isabel Emergency Medical Services (O), Port Isabel Historical Museum (P). Display/hide their locations on the map
Lakes and reservoirs: Laguna Larga (A), El Tular (B), San Martin Lake (C), Vadia Ancha (D), Loma Alta Lake (E), Bahia Grande (F), City of Port Isabel Reservoir (G), Cameron Company Fwsd Reservoir 1 (H). Display/hide their locations on the map
In group quarters: 2 (-1 institutionalized population)
Size of family households: 1,453 2-persons, 526 3-persons, 621 4-persons, 268 5-persons, 77 6-persons, 31 7-or-more-persons
Size of nonfamily households: 1,325 1-person, 49 2-persons
1,596 married couples with children.
453 single-parent households (453 women).
60.8% of residents of 78578 zip code speak English at home.
37.7% of residents speak Spanish at home (54% very well, 18% well, 26% not well, 2% not at all).
0.8% of residents speak other Indo-European language at home (64% very well, 36% well).
0.2% of residents speak Asian or Pacific Island language at home (100% well).
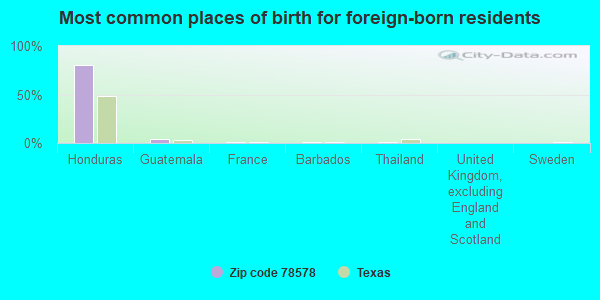
Foreign born population: 2,016 (18.6%) (30.4% of them are naturalized citizens)
This zip code:
18.6%
Whole state:
17.2%
81%Honduras
4%Guatemala
1%France
1%Barbados
1%Thailand
0%United Kingdom, excluding England and Scotland
0%Sweden
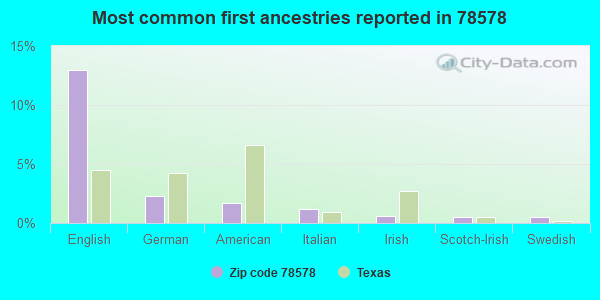
13%English
2%German
2%American
1%Italian
1%Irish
0%Scotch-Irish
0%Swedish
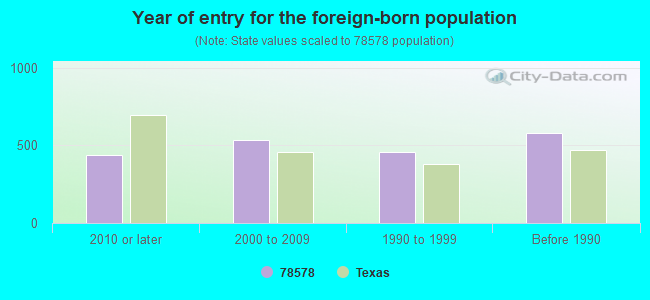
Year of entry for the foreign-born population
4372010 or later
5322000 to 2009
4581990 to 1999
580Before 1990
Facilities with environmental interests located in this zip code:
ANDY BOWIE WWTP (3.7MI N OF QUEEN ISABELA CAUSE in PORT ISABEL, TX)
National Pollutant Discharge Elimination System NON-MAJOR (Tracking pollutant discharge elimination systems) - permit Business SIC classification: SEWERAGE SYSTEMS Organizations: LAGUNA MADRE WATER DISTRICT (CONTACT/OWNER)
Alternative names: LAGUNA MADRE WATER DISTRICT
Housing units lacking complete plumbing facilities: 0.2% Housing units lacking complete kitchen facilities: 0.2%
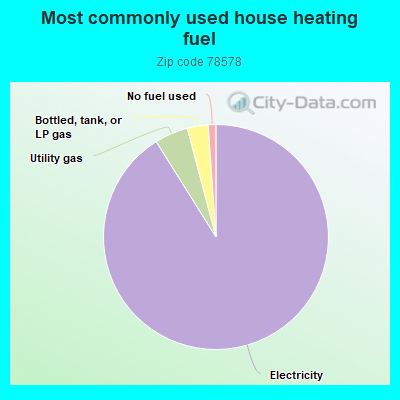
91.1%Electricity
4.8%Utility gas
3.0%Bottled, tank, or LP gas
1.1%No fuel used
Population in 1990: 9,335. Population change in the 1990s: +617 (+6.6%).
Place of birth for U.S.-born residents:
This state: 6,168
Northeast: 304
Midwest: 1,178
South: 256
West: 855
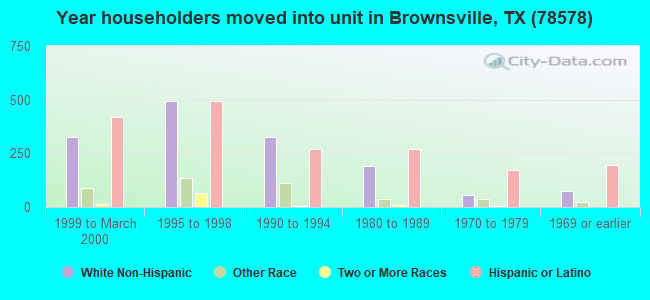
57% of the 78578 zip code residents lived in the same house 5 years ago. Out of people who lived in different houses, 64% lived in this county. Out of people who lived in different counties, 50% lived in Texas.
92% of the 78578 zip code residents lived in the same house 1 year ago. Out of people who lived in different houses, 56% moved from this county. Out of people who lived in different houses, 16% moved from different county within same state. Out of people who lived in different houses, 29% moved from different state.
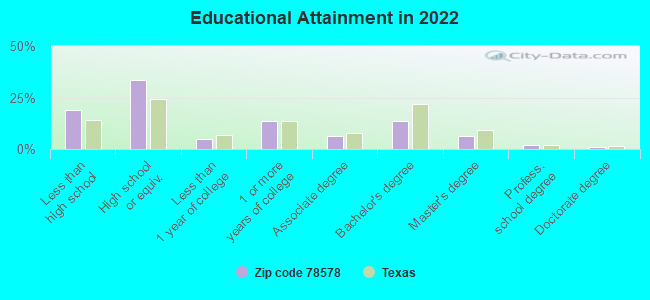
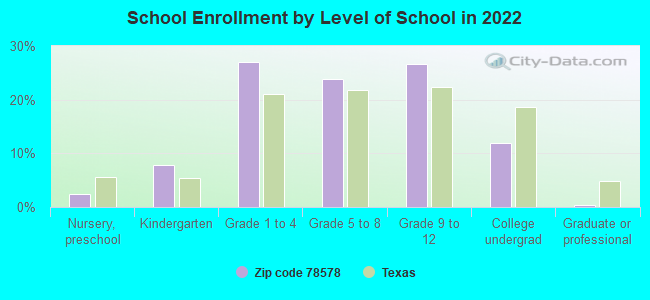
Private vs. public school enrollment:
Students in private schools in grades 1 to 8 (elementary and middle school): 23
Here:
2.3%
Texas:
8.8%
Students in private schools in grades 9 to 12 (high school): 56
Here:
10.5%
Texas:
8.0%
Students in private undergraduate colleges: 20
Here:
8.4%
Texas:
16.2%
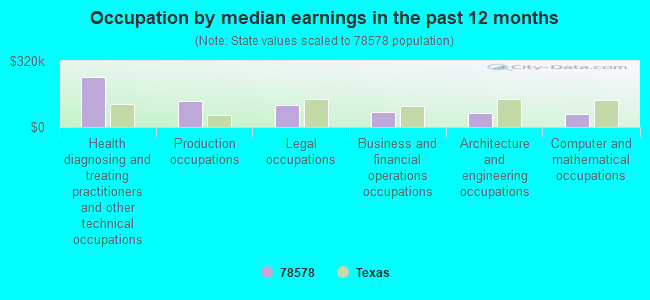
Occupation by median earnings in the past 12 months ($)
243,769Health diagnosing and treating practitioners and other technical occupations
125,305Production occupations
106,724Legal occupations
74,625Business and financial operations occupations
66,578Architecture and engineering occupations
64,232Computer and mathematical occupations
Companies with federal contracts located in this zip code:
INLAND SERVICE CORPORATION (600 SANTA ISABEL BLVD in LAGUNA VISTA, OK; small business) : $26,929,727 in 223 contractsfrom 1999 to 2006
Contracts for Trash/Garbage Collection Services - Including Portable Sanitation Services, Recycling and Reclamation Equipment by Army, Air Force, Department of Veterans Affairs Signed by year:2000: $5,997,882; 2001: $2,633,404; 2002: $3,831,876; 2003: $4,002,865; 2004: $4,193,925; 2005: $3,321,663; 2006: $2,518,494.
Biggest contracts:
$2,549,000 with Army for Trash/Garbage Collection Services - Including Portable Sanitation Services. Signed on 2000-08-28. Completion date: 2001-08-31.
$1,990,576, same as above.Signed on 2002-03-08. Completion date: 2002-10-31.
$1,247,194, same as above.Signed on 2000-07-07. Completion date: 2001-08-31.
$1,149,771 with Army for Trash/Garbage Collection Services - Including Portable Sanitation Services. Taking place in NC. Signed on 2002-07-24. Completion date: 2003-07-31.
BARRAZA FAMILY LIMITED PARTNER (109 SCOLLOP ST in PORT ISABEL, TX; small business) 2 employees, $81000 revenue. : $697,329 in 20 contractsfrom 1999 to 2003
Contracts for Lease or Rental of Facilities -- Office Buildings by Public Buildings Service Signed by year:2000: $144,000; 2001: $144,000; 2002: $180,250; 2003: $193,079; 2004: $0; 2005: $0; 2006: $0.
Biggest contracts:
$36,331 with Public Buildings Service for Lease or Rental of Facilities -- Office Buildings. Signed on 2003-09-15. Completion date: 2003-09-15.
$36,331, same as above.Signed on 2003-06-15. Completion date: 2003-06-15.
$36,125, same as above.Signed on 2002-12-15. Completion date: 2002-12-15.
$36,125, same as above.Signed on 2003-09-15. Completion date: 2003-09-15.
BAYSIDE MARINE INC (BAYSIDE MARINE HWY 100 LG in PORT ISABEL, TX; small business)
$199,000 with Immigration and Naturalization Service for Small Craft. Signed on 2000-08-15. Completion date: 2001-02-15.
ZIMCO MARINE, INC (400 WASHINGTON STREET in PORT ISABEL, TX) : $8,522 in 2 contractsin 2005
$4,261 with U.S. Army Corps of Engineers - civil program financing only for Motors, Electrical. Signed on 2005-01-19. Completion date: 2005-02-17.
$4,261 with Army for Motors, Electrical. Signed on 2005-01-19. Completion date: 2005-02-17.
Top industries in this zip code by the number of employees in 2005:
Other Services (except Public Administration): Other Similar Organizations (except Business, Professional, Labor, and Political Organizations) (20-49: 1, 5-9: 2, 1-4: 2)
Other Services (except Public Administration): Other Personal and Household Goods Repair and Maintenance (20-49: 1, 10-19: 1)
Other Services (except Public Administration): Religious Organizations (20-49: 1, 5-9: 1, 1-4: 3)
People in group quarters in 2010:
9 people in maritime/merchant vessels
People in group quarters in 2000:
3 people in religious group quarters
Fatal accident statistics in 2014:
Fatal accident count: 1
Vehicles involved in fatal accidents: 1
Fatal accidents caused by drunken drivers: 0
Fatalities: 1
Persons involved in fatal accidents: 1
Pedestrians involved in fatal accidents: 0
Fatal accident statistics in 2011:
Fatal accident count: 1
Vehicles involved in fatal accidents: 1
Fatal accidents caused by drunken drivers: 0
Fatalities: 1
Persons involved in fatal accidents: 2
Pedestrians involved in fatal accidents: 0
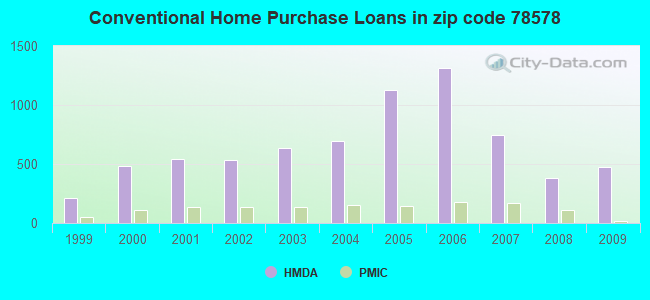
Home Mortgage Disclosure Act Aggregated Statistics For Year 2009 (Based on 14 partial tracts)
A) FHA, FSA/RHS & VA Home Purchase Loans
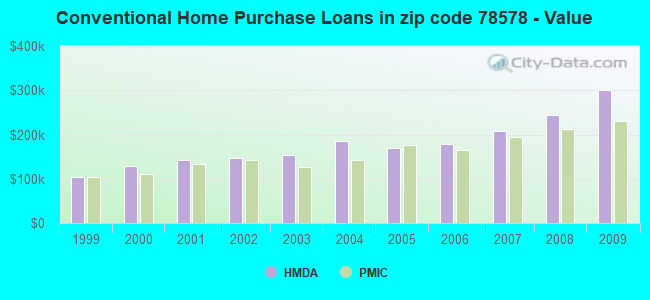
B) Conventional Home Purchase Loans
C) Refinancings
D) Home Improvement Loans
E) Loans on Dwellings For 5+ Families
F) Non-occupant Loans on < 5 Family Dwellings (A B C & D)
G) Loans On Manufactured Home Dwelling (A B C & D)
Number
Average Value
Number
Average Value
Number
Average Value
Number
Average Value
Number
Average Value
Number
Average Value
Number
Average Value
LOANS ORIGINATED
13
$175,187
476
$300,836
191
$237,370
17
$69,707
12
$81,848
541
$291,849
3
$69,190
APPLICATIONS APPROVED, NOT ACCEPTED
1
$144,830
71
$289,421
40
$205,305
3
$180,850
0
$0
86
$286,295
0
$0
APPLICATIONS DENIED
7
$240,763
160
$337,577
197
$243,368
18
$67,483
0
$0
243
$298,379
1
$32,730
APPLICATIONS WITHDRAWN
1
$246,520
64
$315,356
104
$216,259
9
$177,133
2
$1,877,455
119
$252,748
0
$0
FILES CLOSED FOR INCOMPLETENESS
2
$70,880
11
$399,575
23
$254,986
2
$90,060
0
$0
28
$288,588
0
$0
Aggregated Statistics For Year 2008 (Based on 14 partial tracts)
A) FHA, FSA/RHS & VA Home Purchase Loans
B) Conventional Home Purchase Loans
C) Refinancings
D) Home Improvement Loans
E) Loans on Dwellings For 5+ Families
F) Non-occupant Loans on < 5 Family Dwellings (A B C & D)
G) Loans On Manufactured Home Dwelling (A B C & D)
Number
Average Value
Number
Average Value
Number
Average Value
Number
Average Value
Number
Average Value
Number
Average Value
Number
Average Value
LOANS ORIGINATED
6
$130,658
385
$244,836
194
$249,149
25
$87,240
18
$221,290
463
$246,975
3
$65,357
APPLICATIONS APPROVED, NOT ACCEPTED
1
$62,500
66
$267,931
48
$188,479
4
$46,725
0
$0
73
$243,618
1
$63,730
APPLICATIONS DENIED
5
$245,336
166
$269,750
157
$194,906
34
$96,793
2
$206,730
217
$233,689
2
$45,755
APPLICATIONS WITHDRAWN
5
$151,990
53
$241,548
76
$207,933
12
$121,554
0
$0
94
$225,748
2
$96,935
FILES CLOSED FOR INCOMPLETENESS
2
$157,645
37
$336,110
14
$149,826
6
$57,397
0
$0
36
$301,620
0
$0
Aggregated Statistics For Year 2007 (Based on 14 partial tracts)
A) FHA, FSA/RHS & VA Home Purchase Loans
B) Conventional Home Purchase Loans
C) Refinancings
D) Home Improvement Loans
E) Loans on Dwellings For 5+ Families
F) Non-occupant Loans on < 5 Family Dwellings (A B C & D)
G) Loans On Manufactured Home Dwelling (A B C & D)
Number
Average Value
Number
Average Value
Number
Average Value
Number
Average Value
Number
Average Value
Number
Average Value
Number
Average Value
LOANS ORIGINATED
1
$116,740
744
$208,603
251
$315,262
36
$92,842
7
$696,441
749
$249,262
8
$90,084
APPLICATIONS APPROVED, NOT ACCEPTED
0
$0
71
$164,793
51
$352,561
11
$41,550
2
$421,900
80
$233,525
1
$91,080
APPLICATIONS DENIED
0
$0
186
$240,875
182
$238,770
42
$78,452
0
$0
172
$241,965
3
$52,667
APPLICATIONS WITHDRAWN
3
$119,820
57
$284,162
74
$241,595
11
$45,725
0
$0
64
$285,443
3
$525,970
FILES CLOSED FOR INCOMPLETENESS
0
$0
32
$196,231
30
$339,097
6
$117,118
0
$0
34
$216,617
0
$0
Aggregated Statistics For Year 2006 (Based on 14 partial tracts)
A) FHA, FSA/RHS & VA Home Purchase Loans
B) Conventional Home Purchase Loans
C) Refinancings
D) Home Improvement Loans
E) Loans on Dwellings For 5+ Families
F) Non-occupant Loans on < 5 Family Dwellings (A B C & D)
G) Loans On Manufactured Home Dwelling (A B C & D)
Number
Average Value
Number
Average Value
Number
Average Value
Number
Average Value
Number
Average Value
Number
Average Value
Number
Average Value
LOANS ORIGINATED
3
$133,350
1,310
$178,774
258
$251,059
52
$96,292
5
$216,012
1,160
$192,520
11
$78,293
APPLICATIONS APPROVED, NOT ACCEPTED
1
$43,180
104
$170,397
51
$203,528
9
$46,290
0
$0
98
$163,861
0
$0
APPLICATIONS DENIED
1
$135,750
355
$150,577
182
$247,382
35
$72,481
1
$91,480
323
$171,417
7
$38,217
APPLICATIONS WITHDRAWN
1
$42,610
136
$152,296
117
$188,578
12
$76,698
2
$60,331,700
136
$178,742
3
$72,567
FILES CLOSED FOR INCOMPLETENESS
2
$98,725
58
$208,084
32
$290,677
0
$0
0
$0
54
$245,088
0
$0
Aggregated Statistics For Year 2005 (Based on 14 partial tracts)
A) FHA, FSA/RHS & VA Home Purchase Loans
B) Conventional Home Purchase Loans
C) Refinancings
D) Home Improvement Loans
E) Loans on Dwellings For 5+ Families
F) Non-occupant Loans on < 5 Family Dwellings (A B C & D)
G) Loans On Manufactured Home Dwelling (A B C & D)
Number
Average Value
Number
Average Value
Number
Average Value
Number
Average Value
Number
Average Value
Number
Average Value
Number
Average Value
LOANS ORIGINATED
7
$107,207
1,127
$169,768
256
$211,607
39
$159,788
8
$266,219
967
$181,751
16
$49,649
APPLICATIONS APPROVED, NOT ACCEPTED
0
$0
85
$186,768
59
$209,138
14
$94,146
0
$0
75
$204,888
1
$21,590
APPLICATIONS DENIED
2
$103,835
212
$167,205
211
$181,106
40
$49,430
0
$0
218
$178,542
2
$55,755
APPLICATIONS WITHDRAWN
0
$0
96
$192,388
95
$215,040
12
$159,462
1
$46,560
77
$203,919
3
$75,250
FILES CLOSED FOR INCOMPLETENESS
0
$0
42
$190,195
47
$179,407
0
$0
0
$0
47
$222,124
0
$0
Aggregated Statistics For Year 2004 (Based on 14 partial tracts)
A) FHA, FSA/RHS & VA Home Purchase Loans
B) Conventional Home Purchase Loans
C) Refinancings
D) Home Improvement Loans
E) Loans on Dwellings For 5+ Families
F) Non-occupant Loans on < 5 Family Dwellings (A B C & D)
G) Loans On Manufactured Home Dwelling (A B C & D)
Number
Average Value
Number
Average Value
Number
Average Value
Number
Average Value
Number
Average Value
Number
Average Value
Number
Average Value
LOANS ORIGINATED
7
$101,206
692
$184,881
347
$152,363
47
$53,705
4
$224,310
722
$173,384
12
$35,700
APPLICATIONS APPROVED, NOT ACCEPTED
1
$51,800
57
$186,078
60
$179,751
4
$81,965
0
$0
67
$197,533
5
$54,516
APPLICATIONS DENIED
4
$113,230
93
$159,892
162
$141,226
28
$43,080
2
$49,785
80
$169,333
6
$51,757
APPLICATIONS WITHDRAWN
0
$0
58
$166,289
82
$136,724
4
$39,622
0
$0
47
$131,356
2
$19,405
FILES CLOSED FOR INCOMPLETENESS
0
$0
29
$180,329
48
$142,142
4
$172,855
0
$0
32
$164,714
0
$0
Aggregated Statistics For Year 2003 (Based on 14 partial tracts)
A) FHA, FSA/RHS & VA Home Purchase Loans
B) Conventional Home Purchase Loans
C) Refinancings
D) Home Improvement Loans
E) Loans on Dwellings For 5+ Families
F) Non-occupant Loans on < 5 Family Dwellings (A B C & D)
Number
Average Value
Number
Average Value
Number
Average Value
Number
Average Value
Number
Average Value
Number
Average Value
LOANS ORIGINATED
31
$81,163
636
$154,348
597
$153,875
24
$90,238
2
$816,800
767
$151,623
APPLICATIONS APPROVED, NOT ACCEPTED
1
$130,300
62
$122,758
75
$135,902
3
$49,663
0
$0
70
$122,666
APPLICATIONS DENIED
0
$0
83
$139,950
242
$139,182
25
$26,644
0
$0
111
$150,159
APPLICATIONS WITHDRAWN
0
$0
47
$153,234
125
$129,981
3
$54,003
0
$0
49
$154,427
FILES CLOSED FOR INCOMPLETENESS
0
$0
20
$199,234
26
$172,419
3
$63,713
0
$0
24
$175,617
Aggregated Statistics For Year 2002 (Based on 10 partial tracts)
A) FHA, FSA/RHS & VA Home Purchase Loans
B) Conventional Home Purchase Loans
C) Refinancings
D) Home Improvement Loans
E) Loans on Dwellings For 5+ Families
F) Non-occupant Loans on < 5 Family Dwellings (A B C & D)
Number
Average Value
Number
Average Value
Number
Average Value
Number
Average Value
Number
Average Value
Number
Average Value
LOANS ORIGINATED
9
$103,436
533
$147,509
359
$142,280
31
$45,018
0
$0
554
$148,334
APPLICATIONS APPROVED, NOT ACCEPTED
3
$110,473
39
$197,132
56
$149,591
9
$63,834
0
$0
44
$177,235
APPLICATIONS DENIED
5
$83,098
95
$107,459
107
$144,512
21
$18,147
0
$0
84
$115,615
APPLICATIONS WITHDRAWN
0
$0
36
$225,479
39
$118,876
4
$23,220
2
$227,825
30
$163,570
FILES CLOSED FOR INCOMPLETENESS
0
$0
38
$154,522
38
$146,564
0
$0
0
$0
34
$163,075
Aggregated Statistics For Year 2001 (Based on 10 partial tracts)
A) FHA, FSA/RHS & VA Home Purchase Loans
B) Conventional Home Purchase Loans
C) Refinancings
D) Home Improvement Loans
E) Loans on Dwellings For 5+ Families
F) Non-occupant Loans on < 5 Family Dwellings (A B C & D)
Number
Average Value
Number
Average Value
Number
Average Value
Number
Average Value
Number
Average Value
Number
Average Value
LOANS ORIGINATED
7
$78,926
542
$142,325
313
$136,551
25
$19,154
3
$384,773
514
$143,688
APPLICATIONS APPROVED, NOT ACCEPTED
9
$158,599
62
$152,312
44
$88,661
3
$61,460
0
$0
50
$118,404
APPLICATIONS DENIED
3
$145,907
59
$90,986
95
$124,257
13
$78,088
0
$0
56
$124,553
APPLICATIONS WITHDRAWN
3
$170,447
45
$131,304
54
$125,477
0
$0
0
$0
33
$175,409
FILES CLOSED FOR INCOMPLETENESS
0
$0
9
$120,313
21
$178,780
1
$15,190
0
$0
13
$167,192
Aggregated Statistics For Year 2000 (Based on 10 partial tracts)
A) FHA, FSA/RHS & VA Home Purchase Loans
B) Conventional Home Purchase Loans
C) Refinancings
D) Home Improvement Loans
E) Loans on Dwellings For 5+ Families
F) Non-occupant Loans on < 5 Family Dwellings (A B C & D)
Number
Average Value
Number
Average Value
Number
Average Value
Number
Average Value
Number
Average Value
Number
Average Value
LOANS ORIGINATED
9
$91,266
482
$128,853
108
$121,899
29
$26,616
7
$866,746
364
$123,171
APPLICATIONS APPROVED, NOT ACCEPTED
0
$0
42
$101,948
25
$108,934
3
$100,733
0
$0
35
$85,432
APPLICATIONS DENIED
3
$66,867
109
$93,431
45
$102,831
16
$14,861
0
$0
67
$91,477
APPLICATIONS WITHDRAWN
1
$70,820
42
$138,496
13
$150,365
0
$0
0
$0
18
$120,582
FILES CLOSED FOR INCOMPLETENESS
0
$0
11
$125,548
22
$116,202
0
$0
0
$0
12
$134,486
Aggregated Statistics For Year 1999 (Based on 5 partial tracts)
A) FHA, FSA/RHS & VA Home Purchase Loans
B) Conventional Home Purchase Loans
C) Refinancings
D) Home Improvement Loans
E) Loans on Dwellings For 5+ Families
F) Non-occupant Loans on < 5 Family Dwellings (A B C & D)
2002 - 2018 National Fire Incident Reporting System (NFIRS) incidents
Based on the data from the years 2002 - 2018 the average number of fire incidents per year is 26. The highest number of reported fires - 46 took place in 2007, and the least - 12 in 2015. The data has a declining trend.
When looking into fire subcategories, the most reports belonged to: Outside Fires (40.7%), and Structure Fires (28.1%).
Fire incident types reported to NFIRS in Zip Code 78578
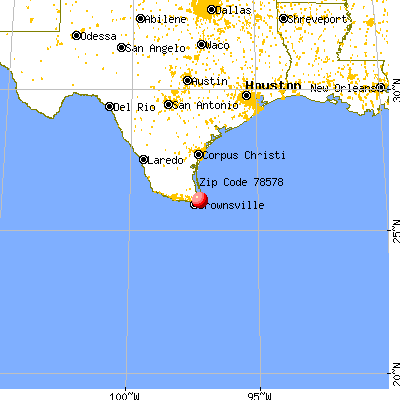


 Nearest zip codes: 78521, 78566, 78526, 78597, 78575, 78520.
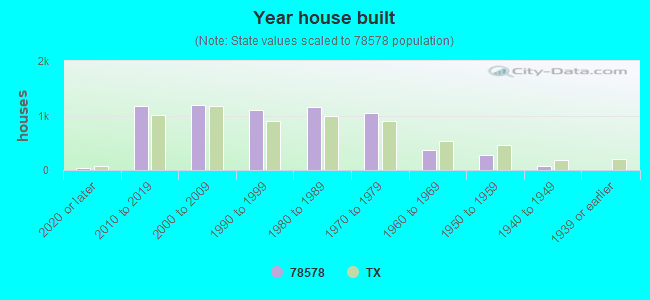


 Based on the data from the years 2002 - 2018 the average number of fire incidents per year is 26. The highest number of reported fires - 46 took place in 2007, and the least - 12 in 2015. The data has a declining trend.
 When looking into fire subcategories, the most reports belonged to: Outside Fires (40.7%), and Structure Fires (28.1%).