Estimated zip code population in 2022: 16,376 Zip code population in 2010: 16,123 Zip code population in 2000: 15,884
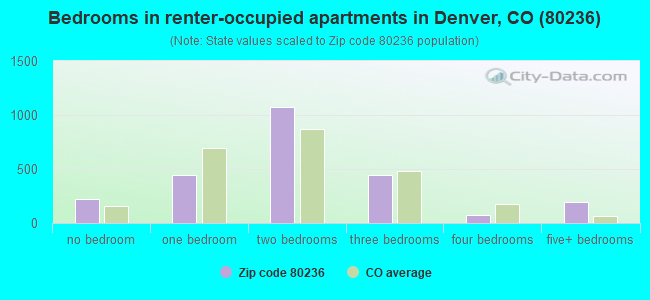
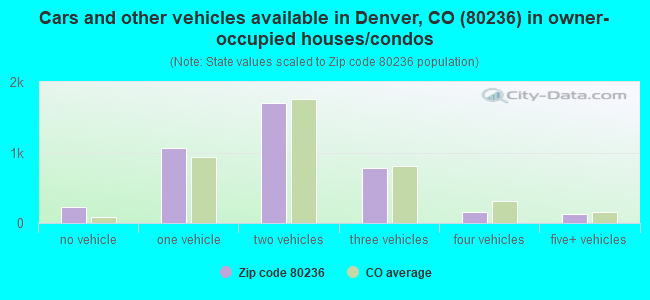
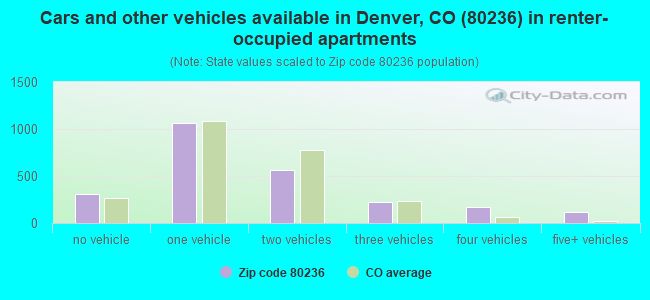
Houses and condos: 6,586 Renter-occupied apartments: 2,451
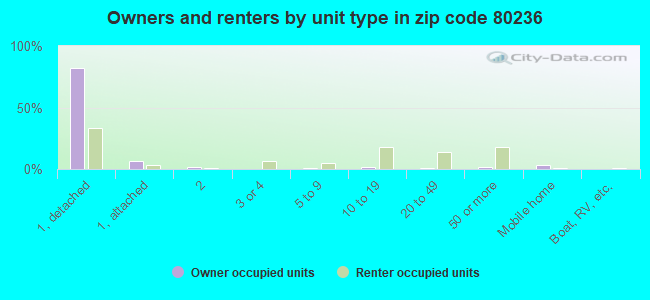
% of renters here:
38%
State:
34%
March 2022 cost of living index in zip code 80236: 109.7 (more than average, U.S. average is 100)
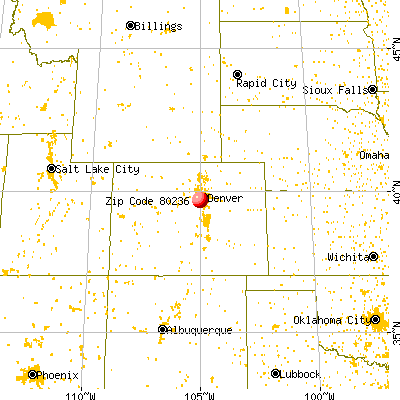
Land area: 3.2 sq. mi. Water area: 0.0 sq. mi.
Population density: 5,097 people per square mile
(average).
OSM Map
General Map
Google Map
MSN Map
OSM Map
General Map
Google Map
MSN Map
OSM Map
General Map
Google Map
MSN Map
OSM Map
General Map
Google Map
MSN Map
Please wait while loading the map...
Real estate property taxes paid for housing units in 2022:
This zip code:
0.4% ($1,993)
Colorado:
0.5% ($2,422)
Median real estate property taxes paid for housing units with mortgages in 2022: $2,152 (0.4%) Median real estate property taxes paid for housing units with no mortgage in 2022: $1,783 (0.4%)
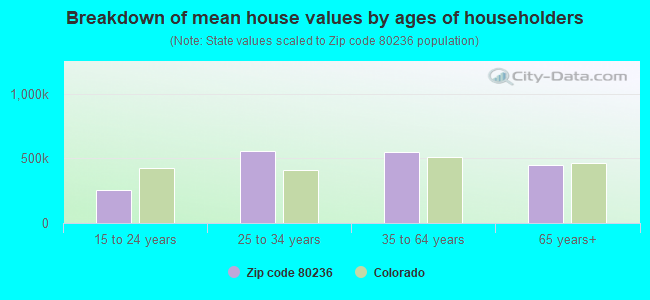
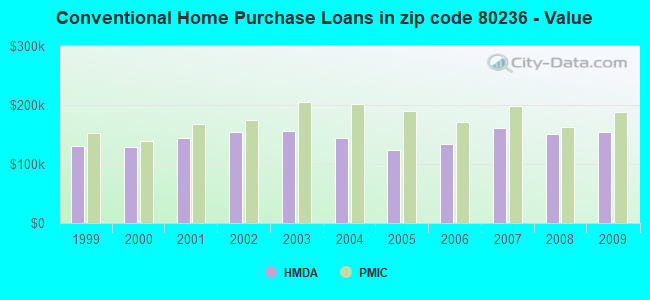
Estimated median house/condo value in 2022: $524,488
80236:
$524,488
Colorado:
$531,100
According to our research of Colorado and other state lists, there were 51 registered sex offenders living in 80236 zip code as of April 27, 2024. The ratio of all residents to sex offenders in zip code 80236 is 368 to 1. The ratio of registered sex offenders to all residents in this zip code is near the state average.
Median resident age:
This zip code:
38.7 years
Colorado median age:
37.7 years
Average household size:
This zip code:
2.4 people
Colorado:
2.4 people
Averages for the 2020 tax year for zip code 80236, filed in 2021:
Average Adjusted Gross Income (AGI) in 2020: $55,802 (Individual Income Tax Returns)
Here:
$55,802
State:
$89,260
Salary/wage: $49,751 (reported on 82.3% of returns)
Here:
$49,751
State:
$70,330
(% of AGI for various income ranges: 1204.1% for AGIs below $25k, 3716.0% for AGIs $25k-50k, 6753.6% for AGIs $50k-75k, 9738.8% for AGIs $75k-100k, 18223.8% for AGIs $100k-200k, 79800.0% for AGIs over 200k)
Taxable interest for individuals: $1,089 (reported on 22.2% of returns)
This zip code:
$1,089
Colorado:
$2,176
(% of AGI for various income ranges: 7.0% for AGIs below $25k, 13.8% for AGIs $25k-50k, 44.1% for AGIs $50k-75k, 65.8% for AGIs $75k-100k, 114.5% for AGIs $100k-200k, 532.5% for AGIs over 200k)
Ordinary dividends: $3,849 (reported on 13.6% of returns)
Here:
$3,849
State:
$8,820
(% of AGI for various income ranges: 15.5% for AGIs below $25k, 22.7% for AGIs $25k-50k, 53.3% for AGIs $50k-75k, 107.3% for AGIs $75k-100k, 183.6% for AGIs $100k-200k, 3717.5% for AGIs over 200k)
Net capital gain/loss in AGI: +$14,240 (reported on 12.1% of returns)
Here:
+$14,240
State:
+$37,276
(% of AGI for various income ranges: 4.5% for AGIs below $25k, 20.8% for AGIs $25k-50k, 101.4% for AGIs $50k-75k, 210.4% for AGIs $75k-100k, 403.0% for AGIs $100k-200k, 22577.5% for AGIs over 200k)
Profit/loss from business: +$13,869 (reported on 16.6% of returns)
Here:
+$13,869
State:
+$15,295
(% of AGI for various income ranges: 207.0% for AGIs below $25k, 230.2% for AGIs $25k-50k, 261.7% for AGIs $50k-75k, 294.0% for AGIs $75k-100k, 732.3% for AGIs $100k-200k, 6945.0% for AGIs over 200k)
Taxable individual retirement arrangement distribution: $17,623 (reported on 6.6% of returns)
80236:
$17,623
Colorado:
$23,785
(% of AGI for various income ranges: 41.0% for AGIs below $25k, 63.2% for AGIs $25k-50k, 142.1% for AGIs $50k-75k, 292.1% for AGIs $75k-100k, 623.4% for AGIs $100k-200k, 3422.5% for AGIs over 200k)
Total itemized deductions: $26,075 (reported on 8.2% of returns)
Here:
$26,075
State:
$35,141
(% of AGI for various income ranges: 37.9% for AGIs below $25k, 110.1% for AGIs $25k-50k, 360.3% for AGIs $50k-75k, 615.6% for AGIs $75k-100k, 1034.5% for AGIs $100k-200k, 6097.5% for AGIs over 200k)
Charity contributions: $5,343 (reported on 5.6% of returns)
Here:
$5,343
State:
$12,103
(% of AGI for various income ranges: 9.7% for AGIs $25k-50k, 32.1% for AGIs $50k-75k, 63.3% for AGIs $75k-100k, 175.5% for AGIs $100k-200k, 1652.5% for AGIs over 200k)
Taxes paid: $5,902 (reported on 8.2% of returns)
80236:
$5,902
State:
$7,710
(% of AGI for various income ranges: 3.3% for AGIs below $25k, 13.6% for AGIs $25k-50k, 74.1% for AGIs $50k-75k, 144.0% for AGIs $75k-100k, 291.3% for AGIs $100k-200k, 1455.0% for AGIs over 200k)
Earned income credit: $2,179 (reported on 16.6% of returns)
Here:
$2,179
State:
$2,053
(% of AGI for various income ranges: 98.7% for AGIs below $25k, 63.1% for AGIs $25k-50k, 1.6% for AGIs $50k-75k)
Percentage of individuals using paid preparers for their 2020 taxes: 90.4%
Here:
90%
State:
93%
(% for various income ranges: 88.3% for AGIs below $25k, 91.1% for AGIs $25k-50k, 91.4% for AGIs $50k-75k, 90.4% for AGIs $75k-100k, 92.7% for AGIs $100k-200k, 94.1% for AGIs over 200k)
Averages for the 2012 tax year for zip code 80236, filed in 2013:
Average Adjusted Gross Income (AGI) in 2012: $43,565 (Individual Income Tax Returns)
Here:
$43,565
State:
$69,103
Salary/wage: $38,929 (reported on 84.2% of returns)
Here:
$38,929
State:
$54,794
(% of AGI for various income ranges: 75.3% for AGIs below $25k, 81.2% for AGIs $25k-50k, 76.6% for AGIs $50k-75k, 75.0% for AGIs $75k-100k, 73.6% for AGIs $100k-200k, 53.9% for AGIs over 200k)
Taxable interest for individuals: $1,122 (reported on 25.2% of returns)
This zip code:
$1,122
Colorado:
$1,971
(% of AGI for various income ranges: 0.7% for AGIs below $25k, 0.5% for AGIs $25k-50k, 0.7% for AGIs $50k-75k, 0.5% for AGIs $75k-100k, 0.8% for AGIs $100k-200k, 0.6% for AGIs over 200k)
Ordinary dividends: $2,982 (reported on 14.0% of returns)
Here:
$2,982
State:
$7,140
(% of AGI for various income ranges: 1.3% for AGIs below $25k, 0.6% for AGIs $25k-50k, 0.8% for AGIs $50k-75k, 0.9% for AGIs $75k-100k, 1.3% for AGIs $100k-200k, 1.2% for AGIs over 200k)
Net capital gain/loss in AGI: +$2,373 (reported on 11.2% of returns)
Here:
+$2,373
State:
+$23,009
(% of AGI for various income ranges: 0.2% for AGIs $50k-75k, 0.5% for AGIs $75k-100k, 1.7% for AGIs $100k-200k, 2.8% for AGIs over 200k)
Profit/loss from business: +$9,315 (reported on 15.2% of returns)
Here:
+$9,315
State:
+$13,514
(% of AGI for various income ranges: 9.4% for AGIs below $25k, 3.1% for AGIs $25k-50k, 2.4% for AGIs $50k-75k, 2.2% for AGIs $75k-100k, 2.4% for AGIs $100k-200k)
Taxable individual retirement arrangement distribution: $12,045 (reported on 9.7% of returns)
80236:
$12,045
Colorado:
$17,927
(% of AGI for various income ranges: 2.8% for AGIs below $25k, 2.1% for AGIs $25k-50k, 2.4% for AGIs $50k-75k, 2.8% for AGIs $75k-100k, 4.1% for AGIs $100k-200k)
Total itemized deductions: $17,837 (23% of AGI, reported on 27.9% of returns)
Here:
$17,837
State:
$24,621
Here:
23.1% of AGI
State:
18.5% of AGI
(% of AGI for various income ranges: 7.7% for AGIs below $25k, 9.5% for AGIs $25k-50k, 12.7% for AGIs $50k-75k, 12.8% for AGIs $75k-100k, 13.8% for AGIs $100k-200k, 10.1% for AGIs over 200k)
Charity contributions: $2,676 (reported on 22.2% of returns)
Here:
$2,676
State:
$4,449
(% of AGI for various income ranges: 0.5% for AGIs below $25k, 0.9% for AGIs $25k-50k, 1.3% for AGIs $50k-75k, 1.4% for AGIs $75k-100k, 2.2% for AGIs $100k-200k, 1.7% for AGIs over 200k)
Taxes paid: $4,327 (reported on 27.9% of returns)
80236:
$4,327
State:
$7,641
(% of AGI for various income ranges: 0.9% for AGIs below $25k, 1.7% for AGIs $25k-50k, 2.6% for AGIs $50k-75k, 3.2% for AGIs $75k-100k, 4.2% for AGIs $100k-200k, 4.7% for AGIs over 200k)
Earned income credit: $2,257 (reported on 20.8% of returns)
Here:
$2,257
State:
$2,095
(% of AGI for various income ranges: 6.5% for AGIs below $25k, 1.2% for AGIs $25k-50k)
Percentage of individuals using paid preparers for their 2012 taxes: 50.5%
Here:
51%
State:
49%
(% for various income ranges: 49.2% for AGIs below $25k, 51.5% for AGIs $25k-50k, 50.5% for AGIs $50k-75k, 50.8% for AGIs $75k-100k, 52.6% for AGIs $100k-200k, 66.7% for AGIs over 200k)
Averages for the 2004 tax year for zip code 80236, filed in 2005:
Average Adjusted Gross Income (AGI) in 2004: $40,491 (Individual Income Tax Returns)
Here:
$40,491
State:
$55,014
Salary/wage: $37,167 (reported on 81.5% of returns)
Here:
$37,167
State:
$46,010
(% of AGI for various income ranges: 101.4% for AGIs below $10k, 72.9% for AGIs $10k-25k, 80.1% for AGIs $25k-50k, 76.4% for AGIs $50k-75k, 78.3% for AGIs $75k-100k, 63.7% for AGIs over 100k)
Taxable interest for individuals: $1,573 (reported on 43.5% of returns)
This zip code:
$1,573
Colorado:
$2,127
(% of AGI for various income ranges: 5.3% for AGIs below $10k, 2.3% for AGIs $10k-25k, 1.7% for AGIs $25k-50k, 1.9% for AGIs $50k-75k, 0.9% for AGIs $75k-100k, 1.5% for AGIs over 100k)
Taxable dividends: $2,607 (reported on 21.5% of returns)
Here:
$2,607
State:
$3,782
(% of AGI for various income ranges: 3.4% for AGIs below $10k, 1.8% for AGIs $10k-25k, 1.0% for AGIs $25k-50k, 1.2% for AGIs $50k-75k, 1.1% for AGIs $75k-100k, 2.0% for AGIs over 100k)
Net capital gain/loss: +$4,792 (reported on 17.5% of returns)
Here:
+$4,792
State:
+$17,882
(% of AGI for various income ranges: -1.0% for AGIs below $10k, -0.1% for AGIs $10k-25k, 0.1% for AGIs $25k-50k, 0.7% for AGIs $50k-75k, 1.5% for AGIs $75k-100k, 7.4% for AGIs over 100k)
Profit/loss from business: +$7,686 (reported on 14.4% of returns)
Here:
+$7,686
State:
+$11,247
(% of AGI for various income ranges: 4.3% for AGIs below $10k, 5.4% for AGIs $10k-25k, 2.9% for AGIs $25k-50k, 2.1% for AGIs $50k-75k, 3.2% for AGIs $75k-100k, 1.6% for AGIs over 100k)
IRA payment deduction: $2,736 (reported on 2.2% of returns)
80236:
$2,736
Colorado:
$2,947
(% of AGI for various income ranges: 0.2% for AGIs $10k-25k, 0.2% for AGIs $25k-50k, 0.1% for AGIs $50k-75k, 0.1% for AGIs $75k-100k, 0.1% for AGIs over 100k)
Self-employed pension: $6,647 (reported on 0.3% of returns)
Here:
$6,647
Colorado:
$13,653
Total itemized deductions: $17,076 (26% of AGI, reported on 37.5% of returns)
Here:
$17,076
State:
$20,560
Here:
26.3% of AGI
State:
21.4% of AGI
(% of AGI for various income ranges: 20.8% for AGIs below $10k, 14.7% for AGIs $10k-25k, 15.8% for AGIs $25k-50k, 17.8% for AGIs $50k-75k, 16.3% for AGIs $75k-100k, 13.6% for AGIs over 100k)
Charity contributions deductions: $2,390 (3% of AGI, reported on 31.6% of returns)
Here:
$2,390
State:
$3,518
Here:
3.5% of AGI
State:
3.4% of AGI
(% of AGI for various income ranges: 1.1% for AGIs below $10k, 1.0% for AGIs $10k-25k, 1.6% for AGIs $25k-50k, 2.1% for AGIs $50k-75k, 2.1% for AGIs $75k-100k, 2.2% for AGIs over 100k)
Total tax: $5,395 (reported on 73.0% of returns)
80236:
$5,395
State:
$9,173
(% of AGI for various income ranges: 3.1% for AGIs below $10k, 3.8% for AGIs $10k-25k, 6.5% for AGIs $25k-50k, 9.0% for AGIs $50k-75k, 10.6% for AGIs $75k-100k, 16.7% for AGIs over 100k)
Earned income credit: $1,666 (reported on 15.7% of returns)
Here:
$1,666
State:
$1,595
Percentage of individuals using paid preparers for their 2004 taxes: 56.9%
Here:
57%
State:
55%
(% for various income ranges: 48.3% for AGIs below $10k, 59.1% for AGIs $10k-25k, 59.0% for AGIs $25k-50k, 58.9% for AGIs $50k-75k, 54.6% for AGIs $75k-100k, 62.0% for AGIs over 100k)
Likely homosexual households (counted as self-reported same-sex unmarried-partner households)
Lesbian couples: 0.1% of all households
Gay men: 0.3% of all households
Household received Food Stamps/SNAP in the past 12 months: 798 Household did not receive Food Stamps/SNAP in the past 12 months: 5,716
Women who had a birth in the past 12 months: 192 (127 now married, 61 unmarried) Women who did not have a birth in the past 12 months: 3,761 (1,248 now married, 2,525 unmarried)
Housing units in zip code 80236 with a mortgage: 2,638 (223 second mortgage, 40 home equity loan, 185 both second mortgage and home equity loan) Houses without a mortgage: 187
Median monthly owner costs for units with a mortgage: $1,875 Median monthly owner costs for units without a mortgage: $501
Residents with income below the poverty level in 2022:
This zip code:
8.7%
Whole state:
9.4%
Residents with income below 50% of the poverty level in 2022:
This zip code:
2.4%
Whole state:
4.6%
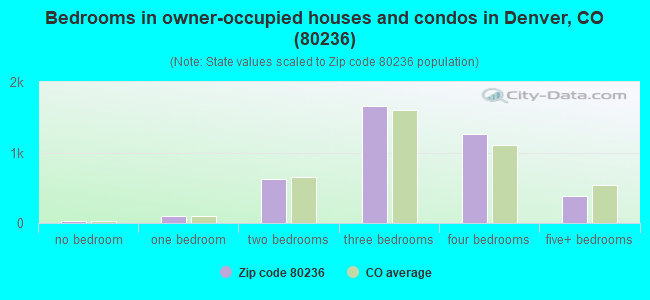
Median number of rooms in houses and condos:
Here:
7.4
State:
6.8
Median number of rooms in apartments:
Here:
4.1
State:
4.0
Notable locations in this zip code not listed on our city pages
Notable locations in zip code 80236: May Bonfils Stanton Library (A), Colorado Mental Health Institute at Fort Logan (B), Denver Public Library Bear Valley Branch (C), Denver Fire Department Station 28 (D). Display/hide their locations on the map
Churches in zip code 80236 include: The Light of Christ Anglican Church (A), Harvey Park Christian Church (B), Saint Philip and Saint James Episcopal Church (C), Saint Andrew Presbyterian Church (D). Display/hide their locations on the map
Parks in zip code 80236 include: Loretto Heights Park (1), Wolff And Quincy Park (2), Bow Mar Heights Park (3), Bear Creek Park (4). Display/hide their locations on the map
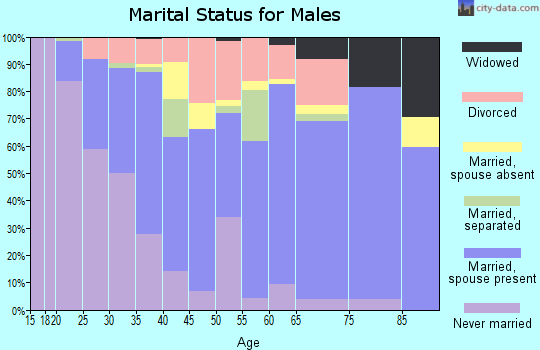
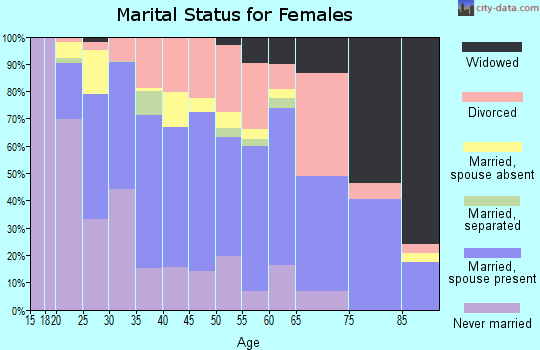
2,101 married couples with children.
856 single-parent households (275 men, 581 women).
73.6% of residents of 80236 zip code speak English at home.
19.4% of residents speak Spanish at home (74% very well, 10% well, 11% not well, 5% not at all).
1.9% of residents speak other Indo-European language at home (42% very well, 13% well, 46% not well).
4.5% of residents speak Asian or Pacific Island language at home (51% very well, 35% well, 13% not well, 1% not at all).
0.1% of residents speak other language at home (42% very well, 58% well).
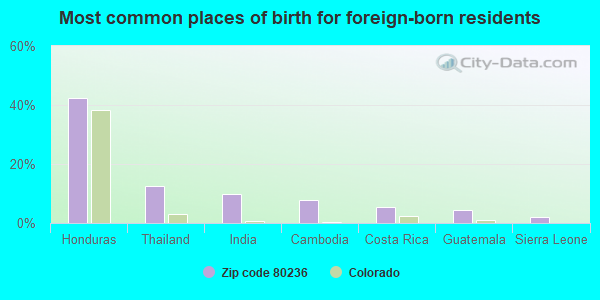
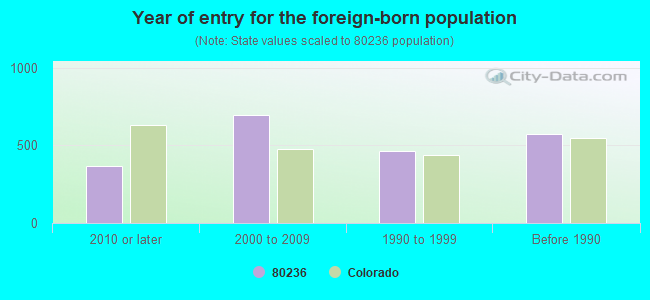
Foreign born population: 2,012 (12.3%) (55.1% of them are naturalized citizens)
Facilities with environmental interests located in this zip code:
KAISER ELEMENTARY SCHOOL (4500 SOUTH QUITMAN STREET in DENVER, CO)
(National Center for Education Statistics) - STATE ID-4498 Organizations: DENVER COUNTY 1 (SCHOOL DISTRICT)
D-MEADOWBROOK WATER DISTRICT (9850 W GIRTON DR, #B in LAKEWOOD, CO)
(Integrated Compliance Information System) - ICIS-08-2000-0116, FORMAL ENFORCEMENT ACTION Business SIC classification: WATER SUPPLY
BRADLEY PETROLEUM INC NO 409 (5100 WEST DARTMOUTH AVENUE in DENVER, CO)
AIR MINOR (AIRS/AFS) CRITERIA AND HAZARDOUS AIR POLLUTANT INVENTORY (Inventory of air pollution sources) Business SIC classification: SANITARY SERVICES; GASOLINE SERVICE STATIONS Alternative names: BRADLEY PETROLEUM INCORPORATED NUMBER 409
HANDY DAN'S HARDWARE STORE (1955 SOUTH SHERIDAN BLVD in LAKEWOOD, CO)
AMBASSADOR DRAPERY CLNRS (4950 ONEIDA ST in ENGLEWOOD, CO)
AIR MINOR (AIRS/AFS) Business SIC classification: DRYCLEANING PLANTS, EXCEPT RUG CLEANING
CRAIG & CO/CIRCLE CHRISTIAN ACADEMY (P O BOX 36226 in DENVER, CO)
COMPLIANCE ACTIVITY (Tracking inspections of insecticide, fungicide, and rodenticide, and toxic substances) Alternative names: CRAIG AND COMPANY (ACCELERATED SCHOOLS), CRAIG AND CO/COLORADO WEST CHRISTIAN SCH
HILLCREST APARTMENTS-DENVER METRO MANAGEMENT (2924 SOUTH FEDERAL BOULEVARD in DENVER, CO)
ENFORCEMENT/COMPLIANCE ACTIVITY (Integrated Compliance Information System) COMPLIANCE ACTIVITY (Tracking inspections of insecticide, fungicide, and rodenticide, and toxic substances) Business SIC classification: OPERATORS OF APARTMENT BUILDINGS Alternative names: DENVER METRO MGMT. - HILLCREST APTS.
Housing units lacking complete plumbing facilities: 0.3% Housing units lacking complete kitchen facilities: 1.2%
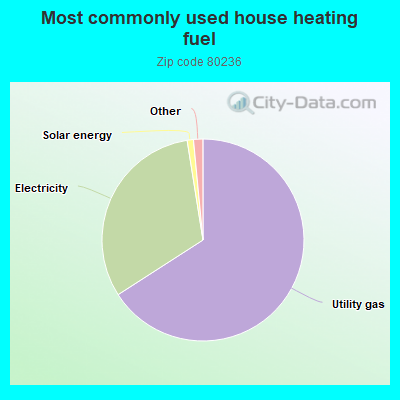
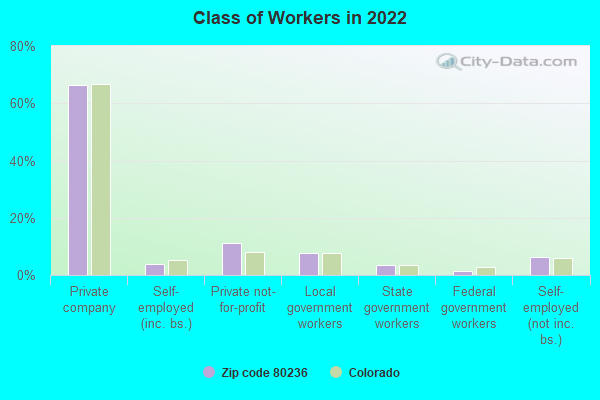
65.9%Utility gas
31.6%Electricity
1.0%Solar energy
0.8%No fuel used
0.6%Bottled, tank, or LP gas
Population in 1990: 12,979. Population change in the 1990s: +2,905 (+22.4%).
Place of birth for U.S.-born residents:
This state: 8,615
Northeast: 629
Midwest: 1,924
South: 1,206
West: 1,831
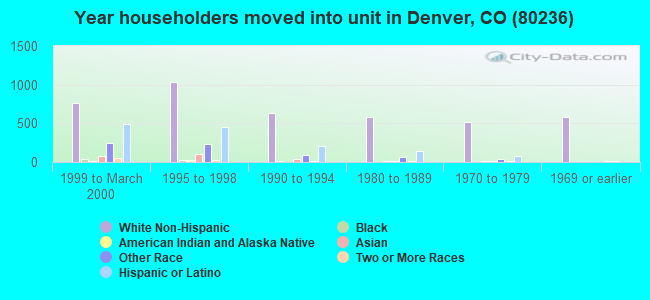
50% of the 80236 zip code residents lived in the same house 5 years ago. Out of people who lived in different houses, 53% lived in this county. Out of people who lived in different counties, 50% lived in Colorado.
86% of the 80236 zip code residents lived in the same house 1 year ago. Out of people who lived in different houses, 44% moved from this county. Out of people who lived in different houses, 43% moved from different county within same state. Out of people who lived in different houses, 9% moved from different state. Out of people who lived in different houses, 4% moved from abroad.
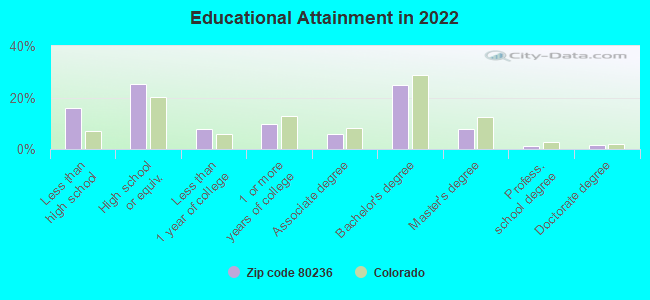
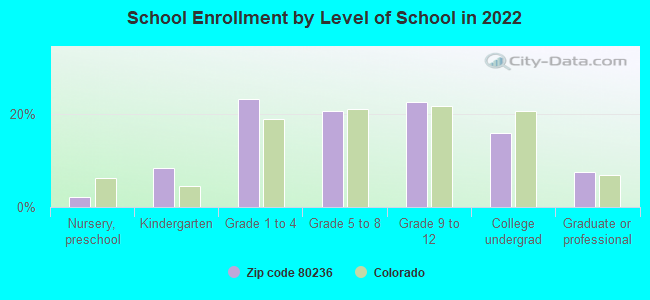
Private vs. public school enrollment:
Students in private schools in grades 1 to 8 (elementary and middle school): 51
Here:
3.4%
Colorado:
11.4%
Students in private schools in grades 9 to 12 (high school):
Here:
0.0%
Colorado:
8.5%
Students in private undergraduate colleges: 119
Here:
21.9%
Colorado:
14.0%
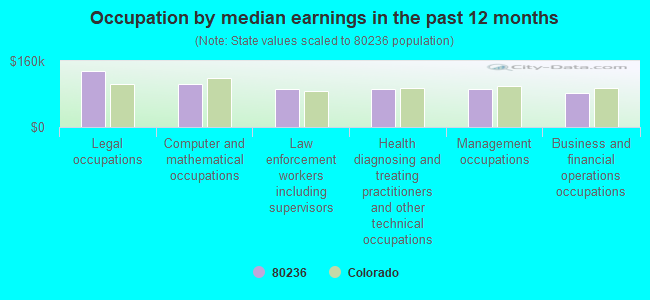
Occupation by median earnings in the past 12 months ($)
135,631Legal occupations
104,770Computer and mathematical occupations
92,242Law enforcement workers including supervisors
91,935Health diagnosing and treating practitioners and other technical occupations
91,611Management occupations
82,195Business and financial operations occupations
Companies with federal contracts located in this zip code:
CHUNG AND ASSOCIATES, INC (2801 W DARTMOUTH AVENUE in DENVER, CO; small business) : $130,114,844 in 888 contractsfrom 1999 to 2006
Contracts for Maintenance, Repair or Alteration of Real Property -- Other Non-Building Facilities, Construction of Structures and Facilities -- Air Traffic Control Towers, Maintenance, Repair or Alteration of Real Property -- Schools, Construction of Structures and Facilities -- Family Housing Facilities, and moreby Army, Navy, Air Force, National Park Service, and others Signed by year:2000: $7,771,655; 2001: $19,518,003; 2002: $19,653,997; 2003: $28,491,144; 2004: $28,513,482; 2005: $16,933,951; 2006: $8,872,612.
Biggest contracts:
$8,384,653 with Army for Maintenance, Repair or Alteration of Real Property -- Other Non-Building Facilities. Taking place in UT. Signed on 2001-06-21. Completion date: 2002-09-30.
$3,295,000 with Navy for Construction of Structures and Facilities -- Air Traffic Control Towers. Taking place in WA. Signed on 2002-09-26. Completion date: 2004-06-12.
$2,898,734 with Air Force for Maintenance, Repair or Alteration of Real Property -- Schools. Taking place in AZ. Signed on 2005-09-28. Completion date: 2006-07-15.
$2,629,000 with National Park Service for Construction of Structures and Facilities -- Family Housing Facilities. Taking place in UT. Signed on 2001-08-15. Completion date: 2002-09-15.
VELLA'S INC (3000 S FEDERAL BLVD in DENVER, CO; small business)
$4,600 with Army for Food Services. Signed on 2005-08-26. Completion date: 2005-09-01.
LONGS DRUG STORE #529 ( in FORT COLLINS, CO) : $0 in 2 contractsin 2005
$110 with Geological Survey for Film, Processed. Signed on 2005-02-28. Completion date: 2005-02-28.
-$110, same as above.Signed on 2005-03-15. Completion date: 2005-03-15.
Top industries in this zip code by the number of employees in 2005:
Health Care and Social Assistance: Psychiatric and Substance Abuse Hospitals (250-499 employees: 1 establishment)
Health Care and Social Assistance: Nursing Care Facilities (100-249: 1, 50-99: 1)
Educational Services: Elementary and Secondary Schools (100-249: 1, 20-49: 1)
Health Care and Social Assistance: Homes for the Elderly (50-99: 1, 20-49: 1)
Construction: Water and Sewer Line and Related Structures Construction (50-99: 1)
Other Services (except Public Administration): Civic and Social Organizations (50-99: 1)
2002 - 2018 National Fire Incident Reporting System (NFIRS) incidents
Based on the data from the years 2002 - 2018 the average number of fire incidents per year is 32. The highest number of fire incidents - 49 took place in 2008, and the least - 14 in 2018. The data has a declining trend.
When looking into fire subcategories, the most reports belonged to: Structure Fires (40.0%), and Outside Fires (39.5%).
Fire incident types reported to NFIRS in Zip Code 80236


 Nearest zip codes: 80110, 80219, 80123, 80235, 80227, 80223.


 Based on the data from the years 2002 - 2018 the average number of fire incidents per year is 32. The highest number of fire incidents - 49 took place in 2008, and the least - 14 in 2018. The data has a declining trend.
 When looking into fire subcategories, the most reports belonged to: Structure Fires (40.0%), and Outside Fires (39.5%).