Sheridan, Colorado Submit your own pictures of this city and show them to the world
OSM Map
General Map
Google Map
MSN Map
OSM Map
General Map
Google Map
MSN Map
OSM Map
General Map
Google Map
MSN Map
OSM Map
General Map
Google Map
MSN Map
Please wait while loading the map...
Population in 2022: 5,970 (100% urban, 0% rural). Population change since 2000: +6.6%Males: 2,883 Females: 3,087
March 2022 cost of living index in Sheridan: 104.2 (near average, U.S. average is 100) Percentage of residents living in poverty in 2022: 11.9%for White Non-Hispanic residents , 10.0% for Hispanic or Latino residents , 14.9% for other race residents , 1.7% for two or more races residents )
Profiles of local businesses
Business Search - 14 Million verified businesses
Data:
Median household income ($)
Median household income (% change since 2000)
Household income diversity
Ratio of average income to average house value (%)
Ratio of average income to average rent
Median household income ($) - White
Median household income ($) - Black or African American
Median household income ($) - Asian
Median household income ($) - Hispanic or Latino
Median household income ($) - American Indian and Alaska Native
Median household income ($) - Multirace
Median household income ($) - Other Race
Median household income for houses/condos with a mortgage ($)
Median household income for apartments without a mortgage ($)
Races - White alone (%)
Races - White alone (% change since 2000)
Races - Black alone (%)
Races - Black alone (% change since 2000)
Races - American Indian alone (%)
Races - American Indian alone (% change since 2000)
Races - Asian alone (%)
Races - Asian alone (% change since 2000)
Races - Hispanic (%)
Races - Hispanic (% change since 2000)
Races - Native Hawaiian and Other Pacific Islander alone (%)
Races - Native Hawaiian and Other Pacific Islander alone (% change since 2000)
Races - Two or more races (%)
Races - Two or more races (% change since 2000)
Races - Other race alone (%)
Races - Other race alone (% change since 2000)
Racial diversity
Unemployment (%)
Unemployment (% change since 2000)
Unemployment (%) - White
Unemployment (%) - Black or African American
Unemployment (%) - Asian
Unemployment (%) - Hispanic or Latino
Unemployment (%) - American Indian and Alaska Native
Unemployment (%) - Multirace
Unemployment (%) - Other Race
Population density (people per square mile)
Population - Males (%)
Population - Females (%)
Population - Males (%) - White
Population - Males (%) - Black or African American
Population - Males (%) - Asian
Population - Males (%) - Hispanic or Latino
Population - Males (%) - American Indian and Alaska Native
Population - Males (%) - Multirace
Population - Males (%) - Other Race
Population - Females (%) - White
Population - Females (%) - Black or African American
Population - Females (%) - Asian
Population - Females (%) - Hispanic or Latino
Population - Females (%) - American Indian and Alaska Native
Population - Females (%) - Multirace
Population - Females (%) - Other Race
Coronavirus confirmed cases (Apr 27, 2024)
Deaths caused by coronavirus (Apr 27, 2024)
Coronavirus confirmed cases (per 100k population) (Apr 27, 2024)
Deaths caused by coronavirus (per 100k population) (Apr 27, 2024)
Daily increase in number of cases (Apr 27, 2024)
Weekly increase in number of cases (Apr 27, 2024)
Cases doubled (in days) (Apr 27, 2024)
Hospitalized patients (Apr 18, 2022)
Negative test results (Apr 18, 2022)
Total test results (Apr 18, 2022)
COVID Vaccine doses distributed (per 100k population) (Sep 19, 2023)
COVID Vaccine doses administered (per 100k population) (Sep 19, 2023)
COVID Vaccine doses distributed (Sep 19, 2023)
COVID Vaccine doses administered (Sep 19, 2023)
Likely homosexual households (%)
Likely homosexual households (% change since 2000)
Likely homosexual households - Lesbian couples (%)
Likely homosexual households - Lesbian couples (% change since 2000)
Likely homosexual households - Gay men (%)
Likely homosexual households - Gay men (% change since 2000)
Cost of living index
Median gross rent ($)
Median contract rent ($)
Median monthly housing costs ($)
Median house or condo value ($)
Median house or condo value ($ change since 2000)
Mean house or condo value by units in structure - 1, detached ($)
Mean house or condo value by units in structure - 1, attached ($)
Mean house or condo value by units in structure - 2 ($)
Mean house or condo value by units in structure by units in structure - 3 or 4 ($)
Mean house or condo value by units in structure - 5 or more ($)
Mean house or condo value by units in structure - Boat, RV, van, etc. ($)
Mean house or condo value by units in structure - Mobile home ($)
Median house or condo value ($) - White
Median house or condo value ($) - Black or African American
Median house or condo value ($) - Asian
Median house or condo value ($) - Hispanic or Latino
Median house or condo value ($) - American Indian and Alaska Native
Median house or condo value ($) - Multirace
Median house or condo value ($) - Other Race
Median resident age
Resident age diversity
Median resident age - Males
Median resident age - Females
Median resident age - White
Median resident age - Black or African American
Median resident age - Asian
Median resident age - Hispanic or Latino
Median resident age - American Indian and Alaska Native
Median resident age - Multirace
Median resident age - Other Race
Median resident age - Males - White
Median resident age - Males - Black or African American
Median resident age - Males - Asian
Median resident age - Males - Hispanic or Latino
Median resident age - Males - American Indian and Alaska Native
Median resident age - Males - Multirace
Median resident age - Males - Other Race
Median resident age - Females - White
Median resident age - Females - Black or African American
Median resident age - Females - Asian
Median resident age - Females - Hispanic or Latino
Median resident age - Females - American Indian and Alaska Native
Median resident age - Females - Multirace
Median resident age - Females - Other Race
Commute - mean travel time to work (minutes)
Travel time to work - Less than 5 minutes (%)
Travel time to work - Less than 5 minutes (% change since 2000)
Travel time to work - 5 to 9 minutes (%)
Travel time to work - 5 to 9 minutes (% change since 2000)
Travel time to work - 10 to 19 minutes (%)
Travel time to work - 10 to 19 minutes (% change since 2000)
Travel time to work - 20 to 29 minutes (%)
Travel time to work - 20 to 29 minutes (% change since 2000)
Travel time to work - 30 to 39 minutes (%)
Travel time to work - 30 to 39 minutes (% change since 2000)
Travel time to work - 40 to 59 minutes (%)
Travel time to work - 40 to 59 minutes (% change since 2000)
Travel time to work - 60 to 89 minutes (%)
Travel time to work - 60 to 89 minutes (% change since 2000)
Travel time to work - 90 or more minutes (%)
Travel time to work - 90 or more minutes (% change since 2000)
Marital status - Never married (%)
Marital status - Now married (%)
Marital status - Separated (%)
Marital status - Widowed (%)
Marital status - Divorced (%)
Median family income ($)
Median family income (% change since 2000)
Median non-family income ($)
Median non-family income (% change since 2000)
Median per capita income ($)
Median per capita income (% change since 2000)
Median family income ($) - White
Median family income ($) - Black or African American
Median family income ($) - Asian
Median family income ($) - Hispanic or Latino
Median family income ($) - American Indian and Alaska Native
Median family income ($) - Multirace
Median family income ($) - Other Race
Median year house/condo built
Median year apartment built
Year house built - Built 2005 or later (%)
Year house built - Built 2000 to 2004 (%)
Year house built - Built 1990 to 1999 (%)
Year house built - Built 1980 to 1989 (%)
Year house built - Built 1970 to 1979 (%)
Year house built - Built 1960 to 1969 (%)
Year house built - Built 1950 to 1959 (%)
Year house built - Built 1940 to 1949 (%)
Year house built - Built 1939 or earlier (%)
Average household size
Household density (households per square mile)
Average household size - White
Average household size - Black or African American
Average household size - Asian
Average household size - Hispanic or Latino
Average household size - American Indian and Alaska Native
Average household size - Multirace
Average household size - Other Race
Occupied housing units (%)
Vacant housing units (%)
Owner occupied housing units (%)
Renter occupied housing units (%)
Vacancy status - For rent (%)
Vacancy status - For sale only (%)
Vacancy status - Rented or sold, not occupied (%)
Vacancy status - For seasonal, recreational, or occasional use (%)
Vacancy status - For migrant workers (%)
Vacancy status - Other vacant (%)
Residents with income below the poverty level (%)
Residents with income below 50% of the poverty level (%)
Children below poverty level (%)
Poor families by family type - Married-couple family (%)
Poor families by family type - Male, no wife present (%)
Poor families by family type - Female, no husband present (%)
Poverty status for native-born residents (%)
Poverty status for foreign-born residents (%)
Poverty among high school graduates not in families (%)
Poverty among people who did not graduate high school not in families (%)
Residents with income below the poverty level (%) - White
Residents with income below the poverty level (%) - Black or African American
Residents with income below the poverty level (%) - Asian
Residents with income below the poverty level (%) - Hispanic or Latino
Residents with income below the poverty level (%) - American Indian and Alaska Native
Residents with income below the poverty level (%) - Multirace
Residents with income below the poverty level (%) - Other Race
Air pollution - Air Quality Index (AQI)
Air pollution - CO
Air pollution - NO2
Air pollution - SO2
Air pollution - Ozone
Air pollution - PM10
Air pollution - PM25
Air pollution - Pb
Crime - Murders per 100,000 population
Crime - Rapes per 100,000 population
Crime - Robberies per 100,000 population
Crime - Assaults per 100,000 population
Crime - Burglaries per 100,000 population
Crime - Thefts per 100,000 population
Crime - Auto thefts per 100,000 population
Crime - Arson per 100,000 population
Crime - City-data.com crime index
Crime - Violent crime index
Crime - Property crime index
Crime - Murders per 100,000 population (5 year average)
Crime - Rapes per 100,000 population (5 year average)
Crime - Robberies per 100,000 population (5 year average)
Crime - Assaults per 100,000 population (5 year average)
Crime - Burglaries per 100,000 population (5 year average)
Crime - Thefts per 100,000 population (5 year average)
Crime - Auto thefts per 100,000 population (5 year average)
Crime - Arson per 100,000 population (5 year average)
Crime - City-data.com crime index (5 year average)
Crime - Violent crime index (5 year average)
Crime - Property crime index (5 year average)
1996 Presidential Elections Results (%) - Democratic Party (Clinton)
1996 Presidential Elections Results (%) - Republican Party (Dole)
1996 Presidential Elections Results (%) - Other
2000 Presidential Elections Results (%) - Democratic Party (Gore)
2000 Presidential Elections Results (%) - Republican Party (Bush)
2000 Presidential Elections Results (%) - Other
2004 Presidential Elections Results (%) - Democratic Party (Kerry)
2004 Presidential Elections Results (%) - Republican Party (Bush)
2004 Presidential Elections Results (%) - Other
2008 Presidential Elections Results (%) - Democratic Party (Obama)
2008 Presidential Elections Results (%) - Republican Party (McCain)
2008 Presidential Elections Results (%) - Other
2012 Presidential Elections Results (%) - Democratic Party (Obama)
2012 Presidential Elections Results (%) - Republican Party (Romney)
2012 Presidential Elections Results (%) - Other
2016 Presidential Elections Results (%) - Democratic Party (Clinton)
2016 Presidential Elections Results (%) - Republican Party (Trump)
2016 Presidential Elections Results (%) - Other
2020 Presidential Elections Results (%) - Democratic Party (Biden)
2020 Presidential Elections Results (%) - Republican Party (Trump)
2020 Presidential Elections Results (%) - Other
Ancestries Reported - Arab (%)
Ancestries Reported - Czech (%)
Ancestries Reported - Danish (%)
Ancestries Reported - Dutch (%)
Ancestries Reported - English (%)
Ancestries Reported - French (%)
Ancestries Reported - French Canadian (%)
Ancestries Reported - German (%)
Ancestries Reported - Greek (%)
Ancestries Reported - Hungarian (%)
Ancestries Reported - Irish (%)
Ancestries Reported - Italian (%)
Ancestries Reported - Lithuanian (%)
Ancestries Reported - Norwegian (%)
Ancestries Reported - Polish (%)
Ancestries Reported - Portuguese (%)
Ancestries Reported - Russian (%)
Ancestries Reported - Scotch-Irish (%)
Ancestries Reported - Scottish (%)
Ancestries Reported - Slovak (%)
Ancestries Reported - Subsaharan African (%)
Ancestries Reported - Swedish (%)
Ancestries Reported - Swiss (%)
Ancestries Reported - Ukrainian (%)
Ancestries Reported - United States (%)
Ancestries Reported - Welsh (%)
Ancestries Reported - West Indian (%)
Ancestries Reported - Other (%)
Educational Attainment - No schooling completed (%)
Educational Attainment - Less than high school (%)
Educational Attainment - High school or equivalent (%)
Educational Attainment - Less than 1 year of college (%)
Educational Attainment - 1 or more years of college (%)
Educational Attainment - Associate degree (%)
Educational Attainment - Bachelor's degree (%)
Educational Attainment - Master's degree (%)
Educational Attainment - Professional school degree (%)
Educational Attainment - Doctorate degree (%)
School Enrollment - Nursery, preschool (%)
School Enrollment - Kindergarten (%)
School Enrollment - Grade 1 to 4 (%)
School Enrollment - Grade 5 to 8 (%)
School Enrollment - Grade 9 to 12 (%)
School Enrollment - College undergrad (%)
School Enrollment - Graduate or professional (%)
School Enrollment - Not enrolled in school (%)
School enrollment - Public schools (%)
School enrollment - Private schools (%)
School enrollment - Not enrolled (%)
Median number of rooms in houses and condos
Median number of rooms in apartments
Housing units lacking complete plumbing facilities (%)
Housing units lacking complete kitchen facilities (%)
Density of houses
Urban houses (%)
Rural houses (%)
Households with people 60 years and over (%)
Households with people 65 years and over (%)
Households with people 75 years and over (%)
Households with one or more nonrelatives (%)
Households with no nonrelatives (%)
Population in households (%)
Family households (%)
Nonfamily households (%)
Population in families (%)
Family households with own children (%)
Median number of bedrooms in owner occupied houses
Mean number of bedrooms in owner occupied houses
Median number of bedrooms in renter occupied houses
Mean number of bedrooms in renter occupied houses
Median number of vehichles in owner occupied houses
Mean number of vehichles in owner occupied houses
Median number of vehichles in renter occupied houses
Mean number of vehichles in renter occupied houses
Mortgage status - with mortgage (%)
Mortgage status - with second mortgage (%)
Mortgage status - with home equity loan (%)
Mortgage status - with both second mortgage and home equity loan (%)
Mortgage status - without a mortgage (%)
Average family size
Average family size - White
Average family size - Black or African American
Average family size - Asian
Average family size - Hispanic or Latino
Average family size - American Indian and Alaska Native
Average family size - Multirace
Average family size - Other Race
Geographical mobility - Same house 1 year ago (%)
Geographical mobility - Moved within same county (%)
Geographical mobility - Moved from different county within same state (%)
Geographical mobility - Moved from different state (%)
Geographical mobility - Moved from abroad (%)
Place of birth - Born in state of residence (%)
Place of birth - Born in other state (%)
Place of birth - Native, outside of US (%)
Place of birth - Foreign born (%)
Housing units in structures - 1, detached (%)
Housing units in structures - 1, attached (%)
Housing units in structures - 2 (%)
Housing units in structures - 3 or 4 (%)
Housing units in structures - 5 to 9 (%)
Housing units in structures - 10 to 19 (%)
Housing units in structures - 20 to 49 (%)
Housing units in structures - 50 or more (%)
Housing units in structures - Mobile home (%)
Housing units in structures - Boat, RV, van, etc. (%)
House/condo owner moved in on average (years ago)
Renter moved in on average (years ago)
Year householder moved into unit - Moved in 1999 to March 2000 (%)
Year householder moved into unit - Moved in 1995 to 1998 (%)
Year householder moved into unit - Moved in 1990 to 1994 (%)
Year householder moved into unit - Moved in 1980 to 1989 (%)
Year householder moved into unit - Moved in 1970 to 1979 (%)
Year householder moved into unit - Moved in 1969 or earlier (%)
Means of transportation to work - Drove car alone (%)
Means of transportation to work - Carpooled (%)
Means of transportation to work - Public transportation (%)
Means of transportation to work - Bus or trolley bus (%)
Means of transportation to work - Streetcar or trolley car (%)
Means of transportation to work - Subway or elevated (%)
Means of transportation to work - Railroad (%)
Means of transportation to work - Ferryboat (%)
Means of transportation to work - Taxicab (%)
Means of transportation to work - Motorcycle (%)
Means of transportation to work - Bicycle (%)
Means of transportation to work - Walked (%)
Means of transportation to work - Other means (%)
Working at home (%)
Industry diversity
Most Common Industries - Agriculture, forestry, fishing and hunting, and mining (%)
Most Common Industries - Agriculture, forestry, fishing and hunting (%)
Most Common Industries - Mining, quarrying, and oil and gas extraction (%)
Most Common Industries - Construction (%)
Most Common Industries - Manufacturing (%)
Most Common Industries - Wholesale trade (%)
Most Common Industries - Retail trade (%)
Most Common Industries - Transportation and warehousing, and utilities (%)
Most Common Industries - Transportation and warehousing (%)
Most Common Industries - Utilities (%)
Most Common Industries - Information (%)
Most Common Industries - Finance and insurance, and real estate and rental and leasing (%)
Most Common Industries - Finance and insurance (%)
Most Common Industries - Real estate and rental and leasing (%)
Most Common Industries - Professional, scientific, and management, and administrative and waste management services (%)
Most Common Industries - Professional, scientific, and technical services (%)
Most Common Industries - Management of companies and enterprises (%)
Most Common Industries - Administrative and support and waste management services (%)
Most Common Industries - Educational services, and health care and social assistance (%)
Most Common Industries - Educational services (%)
Most Common Industries - Health care and social assistance (%)
Most Common Industries - Arts, entertainment, and recreation, and accommodation and food services (%)
Most Common Industries - Arts, entertainment, and recreation (%)
Most Common Industries - Accommodation and food services (%)
Most Common Industries - Other services, except public administration (%)
Most Common Industries - Public administration (%)
Occupation diversity
Most Common Occupations - Management, business, science, and arts occupations (%)
Most Common Occupations - Management, business, and financial occupations (%)
Most Common Occupations - Management occupations (%)
Most Common Occupations - Business and financial operations occupations (%)
Most Common Occupations - Computer, engineering, and science occupations (%)
Most Common Occupations - Computer and mathematical occupations (%)
Most Common Occupations - Architecture and engineering occupations (%)
Most Common Occupations - Life, physical, and social science occupations (%)
Most Common Occupations - Education, legal, community service, arts, and media occupations (%)
Most Common Occupations - Community and social service occupations (%)
Most Common Occupations - Legal occupations (%)
Most Common Occupations - Education, training, and library occupations (%)
Most Common Occupations - Arts, design, entertainment, sports, and media occupations (%)
Most Common Occupations - Healthcare practitioners and technical occupations (%)
Most Common Occupations - Health diagnosing and treating practitioners and other technical occupations (%)
Most Common Occupations - Health technologists and technicians (%)
Most Common Occupations - Service occupations (%)
Most Common Occupations - Healthcare support occupations (%)
Most Common Occupations - Protective service occupations (%)
Most Common Occupations - Fire fighting and prevention, and other protective service workers including supervisors (%)
Most Common Occupations - Law enforcement workers including supervisors (%)
Most Common Occupations - Food preparation and serving related occupations (%)
Most Common Occupations - Building and grounds cleaning and maintenance occupations (%)
Most Common Occupations - Personal care and service occupations (%)
Most Common Occupations - Sales and office occupations (%)
Most Common Occupations - Sales and related occupations (%)
Most Common Occupations - Office and administrative support occupations (%)
Most Common Occupations - Natural resources, construction, and maintenance occupations (%)
Most Common Occupations - Farming, fishing, and forestry occupations (%)
Most Common Occupations - Construction and extraction occupations (%)
Most Common Occupations - Installation, maintenance, and repair occupations (%)
Most Common Occupations - Production, transportation, and material moving occupations (%)
Most Common Occupations - Production occupations (%)
Most Common Occupations - Transportation occupations (%)
Most Common Occupations - Material moving occupations (%)
People in Group quarters - Institutionalized population (%)
People in Group quarters - Correctional institutions (%)
People in Group quarters - Federal prisons and detention centers (%)
People in Group quarters - Halfway houses (%)
People in Group quarters - Local jails and other confinement facilities (including police lockups) (%)
People in Group quarters - Military disciplinary barracks (%)
People in Group quarters - State prisons (%)
People in Group quarters - Other types of correctional institutions (%)
People in Group quarters - Nursing homes (%)
People in Group quarters - Hospitals/wards, hospices, and schools for the handicapped (%)
People in Group quarters - Hospitals/wards and hospices for chronically ill (%)
People in Group quarters - Hospices or homes for chronically ill (%)
People in Group quarters - Military hospitals or wards for chronically ill (%)
People in Group quarters - Other hospitals or wards for chronically ill (%)
People in Group quarters - Hospitals or wards for drug/alcohol abuse (%)
People in Group quarters - Mental (Psychiatric) hospitals or wards (%)
People in Group quarters - Schools, hospitals, or wards for the mentally retarded (%)
People in Group quarters - Schools, hospitals, or wards for the physically handicapped (%)
People in Group quarters - Institutions for the deaf (%)
People in Group quarters - Institutions for the blind (%)
People in Group quarters - Orthopedic wards and institutions for the physically handicapped (%)
People in Group quarters - Wards in general hospitals for patients who have no usual home elsewhere (%)
People in Group quarters - Wards in military hospitals for patients who have no usual home elsewhere (%)
People in Group quarters - Juvenile institutions (%)
People in Group quarters - Long-term care (%)
People in Group quarters - Homes for abused, dependent, and neglected children (%)
People in Group quarters - Residential treatment centers for emotionally disturbed children (%)
People in Group quarters - Training schools for juvenile delinquents (%)
People in Group quarters - Short-term care, detention or diagnostic centers for delinquent children (%)
People in Group quarters - Type of juvenile institution unknown (%)
People in Group quarters - Noninstitutionalized population (%)
People in Group quarters - College dormitories (includes college quarters off campus) (%)
People in Group quarters - Military quarters (%)
People in Group quarters - On base (%)
People in Group quarters - Barracks, unaccompanied personnel housing (UPH), (Enlisted/Officer), ;and similar group living quarters for military personnel (%)
People in Group quarters - Transient quarters for temporary residents (%)
People in Group quarters - Military ships (%)
People in Group quarters - Group homes (%)
People in Group quarters - Homes or halfway houses for drug/alcohol abuse (%)
People in Group quarters - Homes for the mentally ill (%)
People in Group quarters - Homes for the mentally retarded (%)
People in Group quarters - Homes for the physically handicapped (%)
People in Group quarters - Other group homes (%)
People in Group quarters - Religious group quarters (%)
People in Group quarters - Dormitories (%)
People in Group quarters - Agriculture workers' dormitories on farms (%)
People in Group quarters - Job Corps and vocational training facilities (%)
People in Group quarters - Other workers' dormitories (%)
People in Group quarters - Crews of maritime vessels (%)
People in Group quarters - Other nonhousehold living situations (%)
People in Group quarters - Other noninstitutional group quarters (%)
Residents speaking English at home (%)
Residents speaking English at home - Born in the United States (%)
Residents speaking English at home - Native, born elsewhere (%)
Residents speaking English at home - Foreign born (%)
Residents speaking Spanish at home (%)
Residents speaking Spanish at home - Born in the United States (%)
Residents speaking Spanish at home - Native, born elsewhere (%)
Residents speaking Spanish at home - Foreign born (%)
Residents speaking other language at home (%)
Residents speaking other language at home - Born in the United States (%)
Residents speaking other language at home - Native, born elsewhere (%)
Residents speaking other language at home - Foreign born (%)
Class of Workers - Employee of private company (%)
Class of Workers - Self-employed in own incorporated business (%)
Class of Workers - Private not-for-profit wage and salary workers (%)
Class of Workers - Local government workers (%)
Class of Workers - State government workers (%)
Class of Workers - Federal government workers (%)
Class of Workers - Self-employed workers in own not incorporated business and Unpaid family workers (%)
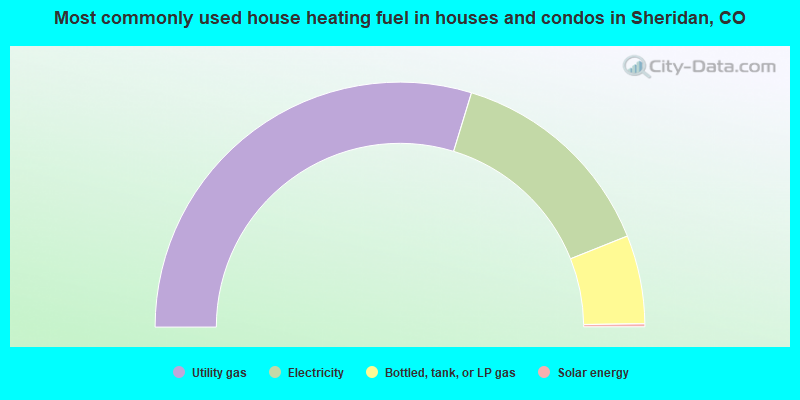
House heating fuel used in houses and condos - Utility gas (%)
House heating fuel used in houses and condos - Bottled, tank, or LP gas (%)
House heating fuel used in houses and condos - Electricity (%)
House heating fuel used in houses and condos - Fuel oil, kerosene, etc. (%)
House heating fuel used in houses and condos - Coal or coke (%)
House heating fuel used in houses and condos - Wood (%)
House heating fuel used in houses and condos - Solar energy (%)
House heating fuel used in houses and condos - Other fuel (%)
House heating fuel used in houses and condos - No fuel used (%)
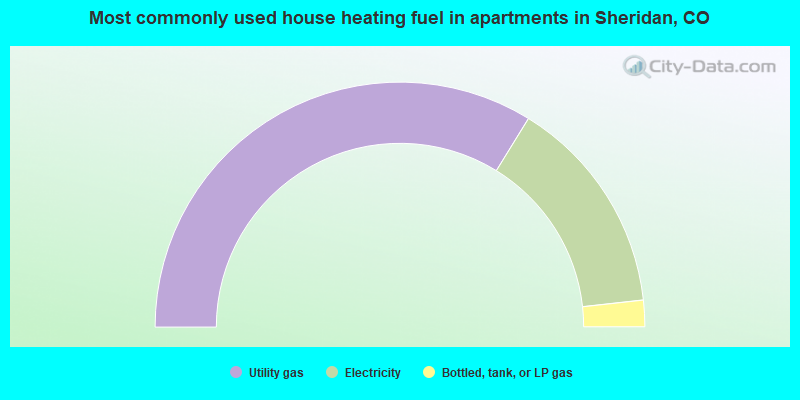
House heating fuel used in apartments - Utility gas (%)
House heating fuel used in apartments - Bottled, tank, or LP gas (%)
House heating fuel used in apartments - Electricity (%)
House heating fuel used in apartments - Fuel oil, kerosene, etc. (%)
House heating fuel used in apartments - Coal or coke (%)
House heating fuel used in apartments - Wood (%)
House heating fuel used in apartments - Solar energy (%)
House heating fuel used in apartments - Other fuel (%)
House heating fuel used in apartments - No fuel used (%)
Armed forces status - In Armed Forces (%)
Armed forces status - Civilian (%)
Armed forces status - Civilian - Veteran (%)
Armed forces status - Civilian - Nonveteran (%)
Fatal accidents locations in years 2005-2021
Fatal accidents locations in 2005
Fatal accidents locations in 2006
Fatal accidents locations in 2007
Fatal accidents locations in 2008
Fatal accidents locations in 2009
Fatal accidents locations in 2010
Fatal accidents locations in 2011
Fatal accidents locations in 2012
Fatal accidents locations in 2013
Fatal accidents locations in 2014
Fatal accidents locations in 2015
Fatal accidents locations in 2016
Fatal accidents locations in 2017
Fatal accidents locations in 2018
Fatal accidents locations in 2019
Fatal accidents locations in 2020
Fatal accidents locations in 2021
Alcohol use - People drinking some alcohol every month (%)
Alcohol use - People not drinking at all (%)
Alcohol use - Average days/month drinking alcohol
Alcohol use - Average drinks/week
Alcohol use - Average days/year people drink much
Audiometry - Average condition of hearing (%)
Audiometry - People that can hear a whisper from across a quiet room (%)
Audiometry - People that can hear normal voice from across a quiet room (%)
Audiometry - Ears ringing, roaring, buzzing (%)
Audiometry - Had a job exposure to loud noise (%)
Audiometry - Had off-work exposure to loud noise (%)
Blood Pressure & Cholesterol - Has high blood pressure (%)
Blood Pressure & Cholesterol - Checking blood pressure at home (%)
Blood Pressure & Cholesterol - Frequently checking blood cholesterol (%)
Blood Pressure & Cholesterol - Has high cholesterol level (%)
Consumer Behavior - Money monthly spent on food at supermarket/grocery store
Consumer Behavior - Money monthly spent on food at other stores
Consumer Behavior - Money monthly spent on eating out
Consumer Behavior - Money monthly spent on carryout/delivered foods
Consumer Behavior - Income spent on food at supermarket/grocery store (%)
Consumer Behavior - Income spent on food at other stores (%)
Consumer Behavior - Income spent on eating out (%)
Consumer Behavior - Income spent on carryout/delivered foods (%)
Current Health Status - General health condition (%)
Current Health Status - Blood donors (%)
Current Health Status - Has blood ever tested for HIV virus (%)
Current Health Status - Left-handed people (%)
Dermatology - People using sunscreen (%)
Diabetes - Diabetics (%)
Diabetes - Had a blood test for high blood sugar (%)
Diabetes - People taking insulin (%)
Diet Behavior & Nutrition - Diet health (%)
Diet Behavior & Nutrition - Milk product consumption (# of products/month)
Diet Behavior & Nutrition - Meals not home prepared (#/week)
Diet Behavior & Nutrition - Meals from fast food or pizza place (#/week)
Diet Behavior & Nutrition - Ready-to-eat foods (#/month)
Diet Behavior & Nutrition - Frozen meals/pizza (#/month)
Drug Use - People that ever used marijuana or hashish (%)
Drug Use - Ever used hard drugs (%)
Drug Use - Ever used any form of cocaine (%)
Drug Use - Ever used heroin (%)
Drug Use - Ever used methamphetamine (%)
Health Insurance - People covered by health insurance (%)
Kidney Conditions-Urology - Avg. # of times urinating at night
Medical Conditions - People with asthma (%)
Medical Conditions - People with anemia (%)
Medical Conditions - People with psoriasis (%)
Medical Conditions - People with overweight (%)
Medical Conditions - Elderly people having difficulties in thinking or remembering (%)
Medical Conditions - People who ever received blood transfusion (%)
Medical Conditions - People having trouble seeing even with glass/contacts (%)
Medical Conditions - People with arthritis (%)
Medical Conditions - People with gout (%)
Medical Conditions - People with congestive heart failure (%)
Medical Conditions - People with coronary heart disease (%)
Medical Conditions - People with angina pectoris (%)
Medical Conditions - People who ever had heart attack (%)
Medical Conditions - People who ever had stroke (%)
Medical Conditions - People with emphysema (%)
Medical Conditions - People with thyroid problem (%)
Medical Conditions - People with chronic bronchitis (%)
Medical Conditions - People with any liver condition (%)
Medical Conditions - People who ever had cancer or malignancy (%)
Mental Health - People who have little interest in doing things (%)
Mental Health - People feeling down, depressed, or hopeless (%)
Mental Health - People who have trouble sleeping or sleeping too much (%)
Mental Health - People feeling tired or having little energy (%)
Mental Health - People with poor appetite or overeating (%)
Mental Health - People feeling bad about themself (%)
Mental Health - People who have trouble concentrating on things (%)
Mental Health - People moving or speaking slowly or too fast (%)
Mental Health - People having thoughts they would be better off dead (%)
Oral Health - Average years since last visit a dentist
Oral Health - People embarrassed because of mouth (%)
Oral Health - People with gum disease (%)
Oral Health - General health of teeth and gums (%)
Oral Health - Average days a week using dental floss/device
Oral Health - Average days a week using mouthwash for dental problem
Oral Health - Average number of teeth
Pesticide Use - Households using pesticides to control insects (%)
Pesticide Use - Households using pesticides to kill weeds (%)
Physical Activity - People doing vigorous-intensity work activities (%)
Physical Activity - People doing moderate-intensity work activities (%)
Physical Activity - People walking or bicycling (%)
Physical Activity - People doing vigorous-intensity recreational activities (%)
Physical Activity - People doing moderate-intensity recreational activities (%)
Physical Activity - Average hours a day doing sedentary activities
Physical Activity - Average hours a day watching TV or videos
Physical Activity - Average hours a day using computer
Physical Functioning - People having limitations keeping them from working (%)
Physical Functioning - People limited in amount of work they can do (%)
Physical Functioning - People that need special equipment to walk (%)
Physical Functioning - People experiencing confusion/memory problems (%)
Physical Functioning - People requiring special healthcare equipment (%)
Prescription Medications - Average number of prescription medicines taking
Preventive Aspirin Use - Adults 40+ taking low-dose aspirin (%)
Reproductive Health - Vaginal deliveries (%)
Reproductive Health - Cesarean deliveries (%)
Reproductive Health - Deliveries resulted in a live birth (%)
Reproductive Health - Pregnancies resulted in a delivery (%)
Reproductive Health - Women breastfeeding newborns (%)
Reproductive Health - Women that had a hysterectomy (%)
Reproductive Health - Women that had both ovaries removed (%)
Reproductive Health - Women that have ever taken birth control pills (%)
Reproductive Health - Women taking birth control pills (%)
Reproductive Health - Women that have ever used Depo-Provera or injectables (%)
Reproductive Health - Women that have ever used female hormones (%)
Sexual Behavior - People 18+ that ever had sex (vaginal, anal, or oral) (%)
Sexual Behavior - Males 18+ that ever had vaginal sex with a woman (%)
Sexual Behavior - Males 18+ that ever performed oral sex on a woman (%)
Sexual Behavior - Males 18+ that ever had anal sex with a woman (%)
Sexual Behavior - Males 18+ that ever had any sex with a man (%)
Sexual Behavior - Females 18+ that ever had vaginal sex with a man (%)
Sexual Behavior - Females 18+ that ever performed oral sex on a man (%)
Sexual Behavior - Females 18+ that ever had anal sex with a man (%)
Sexual Behavior - Females 18+ that ever had any kind of sex with a woman (%)
Sexual Behavior - Average age people first had sex
Sexual Behavior - Average number of female sex partners in lifetime (males 18+)
Sexual Behavior - Average number of female vaginal sex partners in lifetime (males 18+)
Sexual Behavior - Average age people first performed oral sex on a woman (18+)
Sexual Behavior - Average number of woman performed oral sex on in lifetime (18+)
Sexual Behavior - Average number of male sex partners in lifetime (males 18+)
Sexual Behavior - Average number of male anal sex partners in lifetime (males 18+)
Sexual Behavior - Average age people first performed oral sex on a man (18+)
Sexual Behavior - Average number of male oral sex partners in lifetime (18+)
Sexual Behavior - People using protection when performing oral sex (%)
Sexual Behavior - Average number of times people have vaginal or anal sex a year
Sexual Behavior - People having sex without condom (%)
Sexual Behavior - Average number of male sex partners in lifetime (females 18+)
Sexual Behavior - Average number of male vaginal sex partners in lifetime (females 18+)
Sexual Behavior - Average number of female sex partners in lifetime (females 18+)
Sexual Behavior - Circumcised males 18+ (%)
Sleep Disorders - Average hours sleeping at night
Sleep Disorders - People that has trouble sleeping (%)
Smoking-Cigarette Use - People smoking cigarettes (%)
Taste & Smell - People 40+ having problems with smell (%)
Taste & Smell - People 40+ having problems with taste (%)
Taste & Smell - People 40+ that ever had wisdom teeth removed (%)
Taste & Smell - People 40+ that ever had tonsils teeth removed (%)
Taste & Smell - People 40+ that ever had a loss of consciousness because of a head injury (%)
Taste & Smell - People 40+ that ever had a broken nose or other serious injury to face or skull (%)
Taste & Smell - People 40+ that ever had two or more sinus infections (%)
Weight - Average height (inches)
Weight - Average weight (pounds)
Weight - Average BMI
Weight - People that are obese (%)
Weight - People that ever were obese (%)
Weight - People trying to lose weight (%)
2,936 48.3% White alone 2,633 43.3% Hispanic 258 4.2% Two or more races 176 2.9% Asian alone 96 1.6% Black alone 33 0.5% American Indian alone
Officers per 1,000 residents here:
5.44Colorado average:
2.14
Latest news from Sheridan, CO collected exclusively by city-data.com from local newspapers, TV, and radio stations
Ancestries: German (6.2%), Irish (5.9%), American (3.5%), English (2.7%), French (2.2%), Italian (1.7%).
Current Local Time:
Land area: 2.20 square miles.
Population density: 2,711 people per square mile (average).
666 residents are foreign born (5.9% Latin America , 3.0% Asia , 1.4% Europe ).
This city:
11.0%Colorado:
9.5%
Median real estate property taxes paid for housing units in 2000: Sheridan city:
0.7% ($769)Colorado:
0.7% ($1,132)
Nearest city with pop. 50,000+: Southwest Arapahoe, CO (3.7 miles
Nearest city with pop. 200,000+: Denver, CO
Nearest city with pop. 1,000,000+: Phoenix, AZ
Nearest cities:
Latitude: 39.65 N, Longitude: 105.02 W
Daytime population change due to commuting: +2,859 (+47.1%)Workers who live and work in this city: 369 (13.8%)
Property values in Sheridan, CO
Single-family new house construction building permits:
2021: 1 building , cost: $515,0002019: 13 buildings , average cost: $166,3002018: 10 buildings , average cost: $225,7002017: 20 buildings , average cost: $129,3002016: 21 buildings , average cost: $135,1002014: 1 building , cost: $104,0002012: 1 building , cost: $140,0002011: 2 buildings , average cost: $174,9002009: 2 buildings , average cost: $225,7002008: 2 buildings , average cost: $147,9002005: 4 buildings , average cost: $136,0002004: 3 buildings , average cost: $136,0002003: 5 buildings , average cost: $136,8002002: 11 buildings , average cost: $87,3002001: 6 buildings , average cost: $94,2002000: 8 buildings , average cost: $94,2001999: 4 buildings , average cost: $87,2001998: 4 buildings , average cost: $109,300Unemployment in December 2023:
Population change in the 1990s: +585 (+11.7%).
Most common occupations in Sheridan, CO (%)
Both Males Females
Building and grounds cleaning and maintenance occupations (5.7%)
Other sales and related occupations, including supervisors (5.3%)
Other office and administrative support workers, including supervisors (5.0%)
Electrical equipment mechanics and other installation, maintenance, and repair workers, including supervisors (3.9%)
Vehicle and mobile equipment mechanics, installers, and repairers (3.8%)
Customer service representatives (3.8%)
Other production occupations, including supervisors (3.5%)
Building and grounds cleaning and maintenance occupations (7.3%)
Vehicle and mobile equipment mechanics, installers, and repairers (6.0%)
Material recording, scheduling, dispatching, and distributing workers (5.7%)
Other sales and related occupations, including supervisors (5.6%)
Electrical equipment mechanics and other installation, maintenance, and repair workers, including supervisors (5.6%)
Carpenters (4.9%)
Construction laborers (4.7%)
Other office and administrative support workers, including supervisors (9.0%)
Secretaries and administrative assistants (7.9%)
Customer service representatives (7.5%)
Information and record clerks, except customer service representatives (7.4%)
Cashiers (6.8%)
Other sales and related occupations, including supervisors (4.9%)
Health technologists and technicians (3.7%)
Tornado activity:
Sheridan-area historical tornado activity is above Colorado state average. It is 23% greater than the overall U.S. average.
On 6/15/1988, a category F3 (max. wind speeds 158-206 mph) tornado 7.3 miles away from the Sheridan city center injured 7 people and caused between $5,000,000 and $50,000,000 in damages.
On 5/18/1975, a category F3 tornado 18.5 miles away from the city center .
Earthquake activity:
Sheridan-area historical earthquake activity is significantly above Colorado state average. It is 720% greater than the overall U.S. average. On 8/18/1959 at 06:37:13, a magnitude 7.7 (7.7 UK, Class: Major, Intensity: VIII - XII) earthquake occurred 446.3 miles away from the city center, causing $26,000,000 total damage On 10/18/1984 at 15:30:23, a magnitude 5.5 (5.4 MB, 5.1 MS, 5.5 ML, Class: Moderate, Intensity: VI - VII) earthquake occurred 192.1 miles away from Sheridan center On 8/23/2011 at 05:46:18, a magnitude 5.3 (5.3 MW, Depth: 2.5 mi) earthquake occurred 179.7 miles away from the city center On 10/28/1983 at 14:06:06, a magnitude 7.3 (6.2 MB, 7.3 MS, 7.0 MW) earthquake occurred 545.9 miles away from the city center, causing 2 deaths ( 2 shaking deaths) and 3 injuries, causing $15,000,000 total damage On 8/10/2005 at 22:08:22, a magnitude 5.0 (5.0 MW, Depth: 3.1 mi) earthquake occurred 187.2 miles away from the city center On 8/10/2005 at 22:08:22, a magnitude 5.0 (5.0 MB, 4.7 MS, 5.0 MW) earthquake occurred 189.2 miles away from Sheridan center Magnitude types: body-wave magnitude (MB), local magnitude (ML), surface-wave magnitude (MS), moment magnitude (MW) Natural disasters: The number of natural disasters in Arapahoe County (10) is smaller than the US average (15).Major Disasters (Presidential) Declared: 5Emergencies Declared: 4Floods: 5, Storms: 4, Landslides: 2, Mudslides: 2, Snows: 2, Fire: 1, Heavy Rain: 1, Hurricane: 1, Snowstorm: 1, Tornado: 1, Other: 1 (Note: some incidents may be assigned to more than one category). Hospitals and medical centers near Sheridan: AUTUMN HEIGHTS HEALTH CARE CENTER (Nursing Home, about 1 miles away; DENVER, CO)
BEST CARE INC (Home Health Center, about 2 miles away; ENGLEWOOD, CO)
HOME HEALTH CARE PROFESSIONALS INC (Home Health Center, about 2 miles away; ENGLEWOOD, CO)
INTERIM HEALTHCARE (Home Health Center, about 2 miles away; ENGLEWOOD, CO)
ENGLEWOOD DIALYSIS (DVA) (Dialysis Facility, about 2 miles away; ENGLEWOOD, CO)
ALL STATE HOME HEALTH (Home Health Center, about 2 miles away; ENGLEWOOD, CO)
SWEDISH MEDICAL CENTER (about 2 miles away; ENGLEWOOD, CO)
Amtrak station near Sheridan: 8 miles: DENVER (1701 WYNKOOP ST.) Services: ticket office, fully wheelchair accessible, enclosed waiting area, public restrooms, public payphones, full-service food facilities and snack bar, paid short-term parking, paid long-term parking, call for car rental service, taxi stand, public transit connection.
Colleges/universities with over 2000 students nearest to Sheridan:
Arapahoe Community College (about 3 miles; Littleton, CO ; Full-time enrollment: 6,619)
University of Denver (about 5 miles; Denver, CO ; FT enrollment: 9,621)
Colorado Christian University (about 6 miles; Lakewood, CO ; FT enrollment: 2,959)
Community College of Denver (about 7 miles; Denver, CO ; FT enrollment: 7,329)
Emily Griffith Technical College (about 7 miles; Denver, CO ; FT enrollment: 2,460)
Metropolitan State University of Denver (about 7 miles; Denver, CO ; FT enrollment: 17,242)
University of Colorado Denver (about 7 miles; Denver, CO ; FT enrollment: 14,727)
Notable locations in Sheridan: (A) , Oxford Santa Fe Business Park (B) , Broken Tee Golf Course (C) , Arapahoe Library District Sheridan Branch (D) , The Younger Generation Players (E) , Sheridan Police Department (F) , Sheridan City Hall (G) , Sheridan Municipal Court (H) , Denver Fire Department Station 36 (I) . Display/hide their locations on the map
Churches in Sheridan include: (A) , Faith Bible Chapel South (B) , Holy Name Catholic Parish (C) . Display/hide their locations on the map
Creek: (A) . Display/hide its location on the map
Arapahoe County has a predicted average indoor radon screening level greater than 4 pCi/L (pico curies per liter) - Highest Potential Average household size: This city:
2.5 peopleColorado:
2.5 people
Percentage of family households: This city:
60.7%Whole state:
63.9%
Percentage of households with unmarried partners: This city:
8.4%Whole state:
6.5%
Likely homosexual households (counted as self-reported same-sex unmarried-partner households)
Lesbian couples: 0.7% of all households Gay men: 0.2% of all households
14 people in residential treatment centers for emotionally disturbed children in 2000people in training schools for juvenile delinquents in 2000
For population 15 years and over in Sheridan:
Never married: 43.4%Now married: 37.6%Separated: 1.8%Widowed: 3.0%Divorced: 14.2% For population 25 years and over in Sheridan:
High school or higher: 84.0%Bachelor's degree or higher: 19.0%Graduate or professional degree: 8.4%Unemployed: 4.5%Mean travel time to work (commute): 30.4 minutes
Education Gini index (Inequality in education) Here:
12.2Colorado average:
11.1
Religion statistics for Sheridan, CO (based on Arapahoe County data)
Religion Adherents Congregations Catholic 69,031 13 Evangelical Protestant 64,204 178 Mainline Protestant 28,266 50 Other 26,495 53 Orthodox 1,780 4 Black Protestant 1,061 4 None 381,166 -
Source: Clifford Grammich, Kirk Hadaway, Richard Houseal, Dale E.Jones, Alexei Krindatch, Richie Stanley and Richard H.Taylor. 2012. 2010 U.S.Religion Census: Religious Congregations & Membership Study. Association of Statisticians of American Religious Bodies. Jones, Dale E., et al. 2002. Congregations and Membership in the United States 2000. Nashville, TN: Glenmary Research Center. Graphs represent county-level data
Food Environment Statistics: Number of grocery stores : 80Arapahoe County :
1.47 / 10,000 pop.State :
1.50 / 10,000 pop.
Number of supercenters and club stores : 8This county :
0.15 / 10,000 pop.Colorado :
0.15 / 10,000 pop.
Number of convenience stores (no gas) : 21Arapahoe County :
0.39 / 10,000 pop.Colorado :
0.45 / 10,000 pop.
Number of convenience stores (with gas) : 133This county :
2.45 / 10,000 pop.Colorado :
3.13 / 10,000 pop.
Number of full-service restaurants : 377This county :
6.94 / 10,000 pop.Colorado :
8.99 / 10,000 pop.
Adult diabetes rate : This county :
6.0%Colorado :
5.3%
Adult obesity rate : Arapahoe County :
19.5%Colorado :
18.4%
Low-income preschool obesity rate : Health and Nutrition: Healthy diet rate : Sheridan:
48.4%Colorado:
49.4%
Average overall health of teeth and gums : Sheridan:
46.8%State:
47.8%
Average BMI : This city:
28.8Colorado:
28.5
People feeling badly about themselves : People not drinking alcohol at all : Sheridan:
11.3%Colorado:
9.7%
Average hours sleeping at night : This city:
6.8Colorado:
6.8
Overweight people : This city:
34.7%Colorado:
33.3%
General health condition : This city:
55.7%Colorado:
57.3%
Average condition of hearing : This city:
79.3%Colorado:
80.2%
More about Health and Nutrition of Sheridan, CO Residents
Local government employment and payroll (March 2022)
Function
Full-time employees
Monthly full-time payroll
Average yearly full-time wage
Part-time employees
Monthly part-time payroll
Police Protection - Officers
24 $203,404 $101,702 0 $0 Financial Administration
13 $105,812 $97,673 3 $7,060 Police - Other
9 $60,481 $80,641 0 $0 Streets and Highways
5 $28,920 $69,408 0 $0 Judicial and Legal
2 $11,508 $69,048 3 $1,277 Other Government Administration
0 $0 8 $6,607
Totals for Government
53 $410,125 $92,858 14 $14,944
Sheridan government finances - Expenditure in 2021 (per resident):
Construction - Regular Highways: $179,000 ($29.98)
Current Operations - Housing and Community Development: $7,210,000 ($1207.71)
Police Protection: $4,993,000 ($836.35)Central Staff Services: $2,498,000 ($418.43)Local Fire Protection: $2,149,000 ($359.97)Parks and Recreation: $780,000 ($130.65)General - Other: $454,000 ($76.05)Judicial and Legal Services: $388,000 ($64.99)Sewerage: $350,000 ($58.63)General Public Buildings: $171,000 ($28.64)Financial Administration: $134,000 ($22.45)Health - Other: $102,000 ($17.09)General - Interest on Debt: $6,814,000 ($1141.37)
Intergovernmental to Local - Other - Housing and Community Development: $2,206,000 ($369.51)
Other Capital Outlay - Parks and Recreation: $513,000 ($85.93)
Police Protection: $238,000 ($39.87)Regular Highways: $118,000 ($19.77)Sewerage: $34,000 ($5.70)
Sheridan government finances - Revenue in 2021 (per resident):
Local Intergovernmental - General Local Government Support: $2,199,000 ($368.34)
Other: $648,000 ($108.54)Public Welfare: $39,000 ($6.53)Highways: $33,000 ($5.53)Miscellaneous - General Revenue - Other: $3,257,000 ($545.56)
Fines and Forfeits: $1,212,000 ($203.02)Interest Earnings: $116,000 ($19.43)Sale of Property: $9,000 ($1.51)Donations From Private Sources: $7,000 ($1.17)Revenue - Water Utilities: $100,000 ($16.75)
State Intergovernmental - General Local Government Support: $769,000 ($128.81)
Other: $733,000 ($122.78)Highways: $158,000 ($26.47)Public Welfare: $33,000 ($5.53)Tax - General Sales and Gross Receipts: $12,630,000 ($2115.58)
Property: $5,989,000 ($1003.18)Public Utilities Sales: $350,000 ($58.63)Occupation and Business License - Other: $232,000 ($38.86)Other License: $37,000 ($6.20)Amusements Sales: $23,000 ($3.85)Alcoholic Beverage License: $19,000 ($3.18)
Sheridan government finances - Debt in 2021 (per resident):
Long Term Debt - Beginning Outstanding - Unspecified Public Purpose: $170,339,000 ($28532.50)
Outstanding Unspecified Public Purpose: $165,524,000 ($27725.96)Retired Unspecified Public Purpose: $7,088,000 ($1187.27)Issue, Unspecified Public Purpose: $2,274,000 ($380.90)
Sheridan government finances - Cash and Securities in 2021 (per resident):
Other Funds - Cash and Securities: $10,504,000 ($1759.46)
Sinking Funds - Cash and Securities: $11,350,000 ($1901.17)
12.28% of this county's 2021 resident taxpayers lived in other counties in 2020 ($73,180 average adjusted gross income )
Here:
12.28%Colorado average:
11.28%
0.04% of residents moved from foreign countries ($191 average AGI )Arapahoe County:
0.04%Colorado average:
0.05%
Top counties from which taxpayers relocated into this county between 2020 and 2021:
12.70% of this county's 2020 resident taxpayers moved to other counties in 2021 ($75,361 average adjusted gross income )
Here:
12.70%Colorado average:
11.05%
0.02% of residents moved to foreign countries ($156 average AGI )Arapahoe County:
0.02%Colorado average:
0.03%
Top counties to which taxpayers relocated from this county between 2020 and 2021:
Businesses in Sheridan, CO
Name Count Name Count
7-Eleven 1 RadioShack 1 Carl\s Jr. 1 Starbucks 1 Chick-Fil-A 1 Subway 1 Costco 1 T-Mobile 2 InTown Suites 1 Target 1 Panera Bread 1
Strongest AM radio stations in Sheridan:
KADZ (1550 AM; 10 kW; ARVADA, CO; Owner: ABC, INC.)
KDDZ (1690 AM; 10 kW; ARVADA, CO; Owner: ABC, INC.)
KCUV (1510 AM; 25 kW; LITTLETON, CO; Owner: PEOPLE WIRELESS, INC.)
KCKK (1600 AM; 5 kW; LAKEWOOD, CO; Owner: JEFFERSON-PILOT COMMUNICATIONS COMPANY OF COLORADO)
KBNO (1280 AM; 5 kW; DENVER, CO; Owner: LATINO COMMUNICATIONS, LLC)
KOA (850 AM; 50 kW; DENVER, CO; Owner: JACOR BROADCASTING OF COLORADO, INC.)
KCFR (1340 AM; 1 kW; DENVER, CO; Owner: PUBLIC BROADCASTING OF COLORADO, INC.)
KEZW (1430 AM; 10 kW; AURORA, CO; Owner: ENTERCOM DENVER LICENSE, LLC)
KMXA (1090 AM; 50 kW; AURORA, CO; Owner: ENTRAVISION HOLDINGS, LLC)
KLTT (670 AM; 50 kW; COMMERCE CITY, CO; Owner: KLZ RADIO, INC.)
KKZN (760 AM; 50 kW; THORNTON, CO; Owner: JACOR BROADCASTING OF COLORADO, INC.)
KLVZ (1220 AM; 1 kW; DENVER, CO; Owner: KLZ RADIO, INC.)
KNRC (1150 AM; 10 kW; ENGLEWOOD, CO; Owner: NRC BROADCASTING, INC.)
Strongest FM radio stations in Sheridan:
KQMT (99.5 FM; DENVER, CO; Owner: ENTERCOM DENVER LICENSE, LLC)
KQKS (107.5 FM; LAKEWOOD, CO; Owner: JEFFERSON-PILOT COMMUNICATIONS COMPANY OF COLORADO)
KALC (105.9 FM; DENVER, CO; Owner: ENTERCOM DENVER LICENSE, LLC)
KBPI (106.7 FM; DENVER, CO; Owner: JACOR BROADCASTING OF COLORADO, INC.)
KXKL-FM (105.1 FM; DENVER, CO; Owner: INFINITY RADIO OPERATIONS INC.)
KOSI (101.1 FM; DENVER, CO; Owner: ENTERCOM DENVER LICENSE, LLC)
KFMD (95.7 FM; DENVER, CO; Owner: CITICASTERS LICENSES, L.P.)
KRFX (103.5 FM; DENVER, CO; Owner: JACOR BROADCASTING OF COLORADO, INC.)
KLDV (91.1 FM; MORRISON, CO; Owner: EDUCATIONAL MEDIA FOUNDATION)
KIMN (100.3 FM; DENVER, CO; Owner: INFINITY RADIO OPERATIONS INC.)
KVOD (90.1 FM; DENVER, CO; Owner: PUBLIC BROADCASTING OF COLORADO, INC)
KUVO (89.3 FM; DENVER, CO; Owner: DENVER EDUCATIONAL BROADCASTING)
K209DE (89.7 FM; GOLDEN, CO; Owner: WAY-FM MEDIA GROUP, INC.)
KYGO-FM (98.5 FM; DENVER, CO; Owner: JEFFERSON-PILOT COMMUNICATIONS COMPANY OF COLORADO)
KXPK (96.5 FM; EVERGREEN, CO; Owner: ENTRAVISION HOLDINGS, LLC)
KBCO-FM (97.3 FM; BOULDER, CO; Owner: CITICASTERS LICENSES, L.P.)
KJMN (92.1 FM; CASTLE ROCK, CO; Owner: ENTRAVISION HOLDINGS, LLC)
KRKS-FM (94.7 FM; LAFAYETTE, CO; Owner: SALEM MEDIA OF COLORADO, INC)
KJCD (104.3 FM; LONGMONT, CO; Owner: JEFFERSON-PILOT COMMUNICATIONS COMPANY OF COLORADO)
KDJM (92.5 FM; BROOMFIELD, CO; Owner: INFINITY RADIO OPERATIONS INC.)
TV broadcast stations around Sheridan:
KMGH-TV (Channel 7; DENVER, CO; Owner: MCGRAW-HILL BROADCASTING COMPANY, INC.)
KRMA-TV (Channel 6; DENVER, CO; Owner: ROCKY MOUNTAIN PUBLIC BROADCASTING NETWORK, INC.)
K48FW (Channel 48; DENVER, CO; Owner: TRINITY BROADCASTING NETWORK)
KUSA-TV (Channel 9; DENVER, CO; Owner: MULTIMEDIA HOLDINGS CORPORATION)
KDEO-LP (Channel 38; AURORA, CO; Owner: PETER B. VAN DE SANDE)
KTVD (Channel 20; DENVER, CO; Owner: TWENVER BROADCAST, INC.)
KCNC-TV (Channel 4; DENVER, CO; Owner: CBS TELEVISION STATIONS INC.)
KDEV-LP (Channel 62; AURORA, CO; Owner: TIGER EYE BROADCASTING CORPORATION)
KWGN-TV (Channel 2; DENVER, CO; Owner: KWGN INC.)
KMAS-LP (Channel 63; DENVER, CO; Owner: TELEMUNDO OF STEAMBOAT SPRINGS COLO. LIC. CORP.)
KPXC-TV (Channel 59; DENVER, CO; Owner: PAXSON DENVER LICENSE, INC.)
KDVR (Channel 31; DENVER, CO; Owner: FOX TELEVISION STATIONS, INC.)
KDEN (Channel 25; LONGMONT, CO; Owner: LONGMONT CHANNEL 25, INC.)
KRMT (Channel 41; DENVER, CO; Owner: WORD OF GOD FELLOWSHIP, INC.)
KDVT-LP (Channel 36; DENVER, CO; Owner: ENTRAVISION HOLDINGS, LLC)
KWHD (Channel 53; CASTLE ROCK, CO; Owner: LESEA BROADCASTING CORPORATION)
KCEC (Channel 50; DENVER, CO; Owner: ENTRAVISION HOLDINGS, LLC)
K66FB (Channel 66; DENVER, CO; Owner: TRINITY BROADCASTING NETWORK)
National Bridge Inventory (NBI) Statistics 15 Number of bridges177ft / 53.9m Total length $5,068,000 Total costs375,635 Total average daily traffic16,559 Total average daily truck traffic
New bridges - historical statistics
6 1960-1969 1 1980-1989 2 2000-2009 6 2010-2019
See full National Bridge Inventory statistics for Sheridan, CO
FCC Registered Microwave Towers: 15 (
See the full list of FCC Registered Microwave Towers in this town )
FCC Registered Amateur Radio Licenses: 5
Call Sign: KA0MFM, Licensee ID: L01122104, Grant Date: 02/25/2006, Expiration Date: 02/25/2016, Cancellation Date: 02/27/2018, Registrant: Marie F Gerritz, 4111 S Eliot St, Sheridan, CO 80110Call Sign: WA4FMA, Licensee ID: L01277884, Grant Date: 05/01/2007, Expiration Date: 07/29/2017, Cancellation Date: 07/30/2019, Registrant: James F Gerritz, 4111 S Eliot St, Sheridan, CO 80110-4314Call Sign: KD0VCG, Licensee ID: L01781339, Grant Date: 04/16/2013, Expiration Date: 04/16/2023, Certifier: Randy C Powell, Registrant: Randy C Powell, 3800 S Julian St D26, Sheridan, CO 80236Call Sign: KE0YCE, Licensee ID: L02299629, Grant Date: 10/17/2019, Expiration Date: 10/17/2029, Certifier: Zachery S Mell, Registrant: Zachery S Mell, 3450 S Platte River Dr Apt 7203, Sheridan, CO 80110Call Sign: KF0EXG, Licensee ID: L02434472, Grant Date: 03/29/2021, Expiration Date: 03/29/2031, Certifier: William L Paddock Jr, Registrant: William L Paddock Jr, 2650 W Hampden Ave, Sheridan, CO 80110-1906FAA Registered Aircraft: 1
Aircraft: BEECH B-60 (Category: Land, Engines: 2, Seats: 6, Weight: Up to 12,499 Pounds, Speed: 112 mph), Engine: LYCOMING TI0-541 SER (310 HP) (Reciprocating)N-Number: 78GK, N78GK, N-78GK, Serial Number: P401, Year manufactured: 1976, Airworthiness Date: 09/29/1976, Certificate Issue Date: 01/23/2002Registrant (LLC): Twin Lakes LLC, 3340 S Zuni St, Sheridan, CO 80110
Home Mortgage Disclosure Act Aggregated Statistics For Year 2009(Based on 1 full and 4 partial tracts) A) FHA, FSA/RHS & VA B) Conventional C) Refinancings D) Home Improvement Loans F) Non-occupant Loans on G) Loans On Manufactured Number Average Value Number Average Value Number Average Value Number Average Value Number Average Value Number Average Value
LOANS ORIGINATED 42 $159,648 25 $120,424 85 $152,201 3 $48,263 10 $116,858 1 $77,840 APPLICATIONS APPROVED, NOT ACCEPTED 1 $155,490 5 $95,712 11 $154,456 2 $24,375 2 $82,070 2 $26,000 APPLICATIONS DENIED 8 $105,214 2 $142,435 45 $158,064 5 $65,754 5 $134,282 1 $21,360 APPLICATIONS WITHDRAWN 2 $134,100 5 $289,330 20 $148,954 1 $113,840 2 $53,735 0 $0 FILES CLOSED FOR INCOMPLETENESS 0 $0 1 $84,860 4 $172,715 0 $0 0 $0 0 $0
Aggregated Statistics For Year 2008(Based on 1 full and 4 partial tracts) A) FHA, FSA/RHS & VA B) Conventional C) Refinancings D) Home Improvement Loans F) Non-occupant Loans on G) Loans On Manufactured Number Average Value Number Average Value Number Average Value Number Average Value Number Average Value Number Average Value
LOANS ORIGINATED 31 $167,358 37 $111,594 64 $152,063 7 $23,261 25 $104,678 2 $16,500 APPLICATIONS APPROVED, NOT ACCEPTED 2 $233,010 10 $124,982 6 $163,170 1 $6,090 5 $120,664 0 $0 APPLICATIONS DENIED 5 $159,264 12 $109,292 48 $163,651 12 $72,418 12 $124,878 1 $15,000 APPLICATIONS WITHDRAWN 2 $170,720 5 $125,198 16 $166,976 1 $101,910 4 $116,678 0 $0 FILES CLOSED FOR INCOMPLETENESS 0 $0 1 $209,060 4 $164,768 1 $23,760 0 $0 0 $0
Aggregated Statistics For Year 2007(Based on 1 full and 4 partial tracts) A) FHA, FSA/RHS & VA B) Conventional C) Refinancings D) Home Improvement Loans E) Loans on Dwellings For 5+ Families F) Non-occupant Loans on G) Loans On Manufactured Number Average Value Number Average Value Number Average Value Number Average Value Number Average Value Number Average Value Number Average Value
LOANS ORIGINATED 15 $161,740 78 $130,177 104 $141,933 13 $50,513 4 $1,448,742 31 $127,647 3 $32,000 APPLICATIONS APPROVED, NOT ACCEPTED 0 $0 10 $130,691 15 $142,372 3 $42,790 0 $0 4 $157,788 1 $48,000 APPLICATIONS DENIED 3 $155,333 22 $121,959 80 $160,707 10 $38,912 0 $0 13 $130,941 2 $50,835 APPLICATIONS WITHDRAWN 0 $0 6 $109,848 40 $147,419 5 $74,254 0 $0 4 $113,490 0 $0 FILES CLOSED FOR INCOMPLETENESS 0 $0 2 $118,380 13 $161,774 2 $118,980 0 $0 1 $181,870 0 $0
Aggregated Statistics For Year 2006(Based on 1 full and 4 partial tracts) A) FHA, FSA/RHS & VA B) Conventional C) Refinancings D) Home Improvement Loans F) Non-occupant Loans on G) Loans On Manufactured Number Average Value Number Average Value Number Average Value Number Average Value Number Average Value Number Average Value
LOANS ORIGINATED 8 $171,171 112 $110,271 160 $127,852 22 $46,262 36 $133,086 3 $32,960 APPLICATIONS APPROVED, NOT ACCEPTED 1 $136,770 17 $93,484 32 $143,982 2 $19,705 8 $134,484 2 $67,495 APPLICATIONS DENIED 1 $172,340 32 $104,272 119 $152,959 21 $68,510 11 $157,073 3 $44,963 APPLICATIONS WITHDRAWN 2 $119,140 17 $125,067 78 $159,669 4 $91,742 8 $122,536 1 $15,000 FILES CLOSED FOR INCOMPLETENESS 0 $0 2 $122,405 14 $184,621 1 $41,960 4 $171,635 0 $0
Aggregated Statistics For Year 2005(Based on 1 full and 4 partial tracts) A) FHA, FSA/RHS & VA B) Conventional C) Refinancings D) Home Improvement Loans E) Loans on Dwellings For 5+ Families F) Non-occupant Loans on G) Loans On Manufactured Number Average Value Number Average Value Number Average Value Number Average Value Number Average Value Number Average Value Number Average Value
LOANS ORIGINATED 15 $179,876 143 $111,378 203 $132,394 14 $62,766 1 $1,139,560 41 $135,969 3 $55,597 APPLICATIONS APPROVED, NOT ACCEPTED 2 $130,220 18 $116,314 26 $136,524 5 $40,596 0 $0 5 $100,174 0 $0 APPLICATIONS DENIED 1 $219,930 50 $108,360 134 $146,771 25 $52,863 0 $0 15 $146,436 5 $20,668 APPLICATIONS WITHDRAWN 0 $0 30 $130,794 92 $145,771 4 $149,278 0 $0 12 $124,617 1 $15,440 FILES CLOSED FOR INCOMPLETENESS 1 $115,950 8 $112,018 16 $160,908 1 $104,970 0 $0 1 $207,370 0 $0
Aggregated Statistics For Year 2004(Based on 1 full and 4 partial tracts) A) FHA, FSA/RHS & VA B) Conventional C) Refinancings D) Home Improvement Loans E) Loans on Dwellings For 5+ Families F) Non-occupant Loans on G) Loans On Manufactured Number Average Value Number Average Value Number Average Value Number Average Value Number Average Value Number Average Value Number Average Value
LOANS ORIGINATED 32 $176,969 102 $120,013 211 $137,811 15 $46,039 3 $2,078,113 33 $150,725 5 $38,490 APPLICATIONS APPROVED, NOT ACCEPTED 2 $156,155 21 $116,520 54 $134,843 4 $30,205 0 $0 3 $139,067 2 $42,035 APPLICATIONS DENIED 6 $191,002 36 $106,763 136 $149,546 22 $40,309 0 $0 8 $138,946 5 $36,826 APPLICATIONS WITHDRAWN 1 $222,290 12 $147,628 81 $147,015 3 $72,627 0 $0 6 $165,320 0 $0 FILES CLOSED FOR INCOMPLETENESS 1 $225,640 5 $89,468 15 $194,381 0 $0 0 $0 3 $119,307 0 $0
Aggregated Statistics For Year 2003(Based on 1 full and 4 partial tracts) A) FHA, FSA/RHS & VA B) Conventional C) Refinancings D) Home Improvement Loans E) Loans on Dwellings For 5+ Families F) Non-occupant Loans on Number Average Value Number Average Value Number Average Value Number Average Value Number Average Value Number Average Value
LOANS ORIGINATED 52 $170,780 60 $132,779 393 $134,863 19 $25,846 4 $780,282 45 $140,745 APPLICATIONS APPROVED, NOT ACCEPTED 1 $113,440 10 $146,661 61 $124,924 4 $37,565 0 $0 6 $155,130 APPLICATIONS DENIED 6 $186,913 20 $134,146 109 $142,043 19 $19,613 0 $0 8 $106,632 APPLICATIONS WITHDRAWN 3 $169,100 8 $178,641 90 $148,598 1 $19,400 0 $0 5 $152,652 FILES CLOSED FOR INCOMPLETENESS 1 $182,680 2 $154,235 13 $146,785 1 $53,830 0 $0 1 $101,940
Aggregated Statistics For Year 2002(Based on 1 full and 4 partial tracts) A) FHA, FSA/RHS & VA B) Conventional C) Refinancings D) Home Improvement Loans E) Loans on Dwellings For 5+ Families F) Non-occupant Loans on Number Average Value Number Average Value Number Average Value Number Average Value Number Average Value Number Average Value
LOANS ORIGINATED 44 $168,654 52 $145,759 288 $132,591 27 $27,364 3 $509,907 35 $128,323 APPLICATIONS APPROVED, NOT ACCEPTED 1 $146,420 13 $123,637 39 $118,224 5 $15,220 0 $0 7 $132,601 APPLICATIONS DENIED 2 $132,575 15 $106,145 90 $128,077 19 $15,311 2 $682,615 8 $105,912 APPLICATIONS WITHDRAWN 3 $156,470 4 $140,155 77 $146,858 5 $20,802 0 $0 2 $121,600 FILES CLOSED FOR INCOMPLETENESS 1 $146,980 2 $203,620 25 $145,548 1 $65,870 0 $0 2 $145,880
Aggregated Statistics For Year 2001(Based on 1 full and 4 partial tracts) A) FHA, FSA/RHS & VA B) Conventional C) Refinancings D) Home Improvement Loans E) Loans on Dwellings For 5+ Families F) Non-occupant Loans on Number Average Value Number Average Value Number Average Value Number Average Value Number Average Value Number Average Value
LOANS ORIGINATED 56 $158,274 55 $153,169 279 $121,207 27 $24,389 2 $936,425 31 $120,092 APPLICATIONS APPROVED, NOT ACCEPTED 2 $118,440 10 $101,277 33 $160,505 3 $20,527 0 $0 3 $107,283 APPLICATIONS DENIED 5 $163,108 19 $98,219 107 $115,170 19 $20,194 0 $0 5 $152,440 APPLICATIONS WITHDRAWN 3 $122,420 8 $163,600 68 $114,404 5 $54,362 0 $0 4 $141,485 FILES CLOSED FOR INCOMPLETENESS 0 $0 2 $103,115 18 $168,472 0 $0 0 $0 1 $118,000
Aggregated Statistics For Year 2000(Based on 1 full and 4 partial tracts) A) FHA, FSA/RHS & VA B) Conventional C) Refinancings D) Home Improvement Loans E) Loans on Dwellings For 5+ Families F) Non-occupant Loans on Number Average Value Number Average Value Number Average Value Number Average Value Number Average Value Number Average Value
LOANS ORIGINATED 41 $143,995 72 $130,241 113 $112,994 28 $20,393 4 $736,458 16 $103,264 APPLICATIONS APPROVED, NOT ACCEPTED 2 $95,225 19 $63,113 26 $92,973 10 $25,005 0 $0 3 $109,193 APPLICATIONS DENIED 4 $120,808 34 $62,350 65 $98,473 27 $19,109 0 $0 3 $142,177 APPLICATIONS WITHDRAWN 3 $170,343 9 $124,932 31 $96,891 1 $38,390 0 $0 2 $141,505 FILES CLOSED FOR INCOMPLETENESS 1 $138,090 5 $72,130 11 $146,857 0 $0 0 $0 0 $0
Aggregated Statistics For Year 1999(Based on 1 full and 4 partial tracts) A) FHA, FSA/RHS & VA B) Conventional C) Refinancings D) Home Improvement Loans E) Loans on Dwellings For 5+ Families F) Non-occupant Loans on Number Average Value Number Average Value Number Average Value Number Average Value Number Average Value Number Average Value
LOANS ORIGINATED 38 $125,363 64 $99,715 178 $86,989 25 $18,227 4 $558,608 20 $98,710 APPLICATIONS APPROVED, NOT ACCEPTED 0 $0 14 $73,198 38 $76,007 9 $20,761 0 $0 3 $84,103 APPLICATIONS DENIED 3 $130,540 48 $56,015 78 $78,903 24 $23,791 0 $0 6 $57,138 APPLICATIONS WITHDRAWN 2 $135,770 8 $88,750 54 $89,962 0 $0 0 $0 3 $66,787 FILES CLOSED FOR INCOMPLETENESS 0 $0 3 $112,200 13 $101,331 2 $35,630 0 $0 0 $0
Detailed HMDA statistics for the following Tracts:
0055.51
, 0055.52 , 0055.53 , 0060.00 , 0062.00
Private Mortgage Insurance Companies Aggregated Statistics For Year 2009(Based on 1 full and 4 partial tracts) A) Conventional B) Refinancings C) Non-occupant Loans on Number Average Value Number Average Value Number Average Value
LOANS ORIGINATED 3 $145,400 3 $159,033 0 $0 APPLICATIONS APPROVED, NOT ACCEPTED 2 $115,270 1 $225,390 1 $76,720 APPLICATIONS DENIED 0 $0 0 $0 0 $0 APPLICATIONS WITHDRAWN 0 $0 0 $0 0 $0 FILES CLOSED FOR INCOMPLETENESS 1 $85,490 0 $0 0 $0
Aggregated Statistics For Year 2008(Based on 1 full and 4 partial tracts) A) Conventional B) Refinancings C) Non-occupant Loans on Number Average Value Number Average Value Number Average Value
LOANS ORIGINATED 9 $140,158 11 $185,818 3 $141,210 APPLICATIONS APPROVED, NOT ACCEPTED 4 $150,702 2 $220,070 2 $103,625 APPLICATIONS DENIED 2 $87,055 0 $0 2 $63,080 APPLICATIONS WITHDRAWN 1 $165,860 1 $93,430 0 $0 FILES CLOSED FOR INCOMPLETENESS 0 $0 0 $0 0 $0
Aggregated Statistics For Year 2007(Based on 1 full and 4 partial tracts) A) Conventional B) Refinancings C) Non-occupant Loans on Number Average Value Number Average Value Number Average Value
LOANS ORIGINATED 30 $154,309 15 $180,593 4 $158,048 APPLICATIONS APPROVED, NOT ACCEPTED 2 $215,605 2 $171,105 1 $135,710 APPLICATIONS DENIED 0 $0 1 $139,540 0 $0 APPLICATIONS WITHDRAWN 1 $106,450 0 $0 0 $0 FILES CLOSED FOR INCOMPLETENESS 0 $0 0 $0 0 $0
Aggregated Statistics For Year 2006(Based on 1 full and 4 partial tracts) A) Conventional B) Refinancings C) Non-occupant Loans on Number Average Value Number Average Value Number Average Value
LOANS ORIGINATED 6 $189,177 7 $181,217 1 $77,900 APPLICATIONS APPROVED, NOT ACCEPTED 2 $191,195 2 $188,220 0 $0 APPLICATIONS DENIED 0 $0 0 $0 0 $0 APPLICATIONS WITHDRAWN 0 $0 1 $207,000 0 $0 FILES CLOSED FOR INCOMPLETENESS 0 $0 0 $0 0 $0
Aggregated Statistics For Year 2005(Based on 1 full and 4 partial tracts) A) Conventional B) Refinancings C) Non-occupant Loans on Number Average Value Number Average Value Number Average Value
LOANS ORIGINATED 7 $158,131 12 $172,809 1 $230,050 APPLICATIONS APPROVED, NOT ACCEPTED 0 $0 4 $198,178 0 $0 APPLICATIONS DENIED 0 $0 0 $0 0 $0 APPLICATIONS WITHDRAWN 1 $77,710 1 $228,820 0 $0 FILES CLOSED FOR INCOMPLETENESS 0 $0 1 $115,960 0 $0
Aggregated Statistics For Year 2004(Based on 1 full and 4 partial tracts) A) Conventional B) Refinancings C) Non-occupant Loans on Number Average Value Number Average Value Number Average Value
LOANS ORIGINATED 10 $175,491 11 $169,555 2 $175,695 APPLICATIONS APPROVED, NOT ACCEPTED 2 $125,880 4 $151,622 0 $0 APPLICATIONS DENIED 0 $0 0 $0 0 $0 APPLICATIONS WITHDRAWN 1 $163,550 2 $147,090 0 $0 FILES CLOSED FOR INCOMPLETENESS 0 $0 0 $0 0 $0
Aggregated Statistics For Year 2003(Based on 1 full and 4 partial tracts) A) Conventional B) Refinancings C) Non-occupant Loans on Number Average Value Number Average Value Number Average Value
LOANS ORIGINATED 15 $209,157 32 $169,056 5 $182,112 APPLICATIONS APPROVED, NOT ACCEPTED 1 $285,360 11 $162,694 0 $0 APPLICATIONS DENIED 0 $0 0 $0 0 $0 APPLICATIONS WITHDRAWN 3 $422,693 3 $122,827 1 $585,000 FILES CLOSED FOR INCOMPLETENESS 0 $0 0 $0 0 $0
Aggregated Statistics For Year 2002(Based on 1 full and 4 partial tracts) A) Conventional B) Refinancings C) Non-occupant Loans on Number Average Value Number Average Value Number Average Value
LOANS ORIGINATED 14 $158,796 28 $169,084 3 $129,793 APPLICATIONS APPROVED, NOT ACCEPTED 0 $0 6 $156,685 1 $142,200 APPLICATIONS DENIED 0 $0 4 $174,095 1 $96,600 APPLICATIONS WITHDRAWN 1 $69,870 3 $148,493 1 $87,950 FILES CLOSED FOR INCOMPLETENESS 0 $0 1 $102,000 0 $0
Aggregated Statistics For Year 2001(Based on 1 full and 4 partial tracts) A) Conventional B) Refinancings C) Non-occupant Loans on Number Average Value Number Average Value Number Average Value
LOANS ORIGINATED 22 $158,260 26 $151,269 7 $144,141 APPLICATIONS APPROVED, NOT ACCEPTED 4 $166,345 6 $137,533 0 $0 APPLICATIONS DENIED 0 $0 2 $120,205 0 $0 APPLICATIONS WITHDRAWN 0 $0 1 $186,330 0 $0 FILES CLOSED FOR INCOMPLETENESS 0 $0 0 $0 0 $0
Aggregated Statistics For Year 2000(Based on 1 full and 4 partial tracts) A) Conventional B) Refinancings C) Non-occupant Loans on Number Average Value Number Average Value Number Average Value
LOANS ORIGINATED 22 $133,489 13 $133,698 5 $106,542 APPLICATIONS APPROVED, NOT ACCEPTED 2 $161,895 1 $148,920 0 $0 APPLICATIONS DENIED 0 $0 2 $139,060 0 $0 APPLICATIONS WITHDRAWN 0 $0 1 $88,690 0 $0 FILES CLOSED FOR INCOMPLETENESS 1 $106,480 0 $0 0 $0
Aggregated Statistics For Year 1999(Based on 1 full and 4 partial tracts) A) Conventional B) Refinancings C) Non-occupant Loans on Number Average Value Number Average Value Number Average Value
LOANS ORIGINATED 22 $126,925 16 $106,345 3 $116,133 APPLICATIONS APPROVED, NOT ACCEPTED 1 $67,900 2 $94,750 0 $0 APPLICATIONS DENIED 1 $78,460 1 $90,830 0 $0 APPLICATIONS WITHDRAWN 1 $57,190 0 $0 0 $0 FILES CLOSED FOR INCOMPLETENESS 0 $0 1 $110,960 0 $0
Detailed PMIC statistics for the following Tracts:
0055.51
, 0055.52 , 0055.53 , 0060.00 , 0062.00 Sheridan compared to Colorado state average:
Median household income below state average. Unemployed percentage significantly below state average. Black race population percentage below state average. Hispanic race population percentage above state average. Median age below state average. Length of stay since moving in significantly above state average. Number of rooms per house below state average. Percentage of population with a bachelor's degree or higher below state average.
#17 on the list of "Top 101 cities with the highest number of police officers per 1000 residents (population 5,000+)"
#55 on the list of "Top 101 cities with largest percentage of males in occupations: building and grounds cleaning and maintenance occupations (population 5,000+)"
#63 on the list of "Top 101 cities with the largest percentage of people in residential treatment centers for emotionally disturbed children (population 1,000+)"
#81 on the list of "Top 101 cities with the highest number of auto thefts per 100,000 residents, excludes tourist destinations and others with a lot of outsiders visiting based on city industries data (population 5,000+)"
#89 on the list of "Top 101 cities with largest percentage of females in industries: information (population 5,000+)"
#101 on the list of "Top 101 cities with the most residents born in Bangladesh (population 500+)"
#11 on the list of "Top 101 counties with the largest increase in the number of infant deaths per 1000 residents 2000-2006 to 2007-2013 (pop. 50,000+)"
#19 on the list of "Top 101 counties with the highest Ozone (1-hour) air pollution readings in 2012 (ppm)"
#40 on the list of "Top 101 counties with the highest percentage of residents that exercised in the past month"
#46 on the list of "Top 101 counties with the highest percentage of residents relocating from other counties between 2010 and 2011 (pop. 50,000+)"
#47 on the list of "Top 101 counties with the best general health status score of residents (1-5), 3 years of data"
There is 1 pilot and no other airmen in this city.
Top Patent Applicants
Brandon Richard Halper (1)
Jesse Baker (1)
Karen Gathman (1)
John William Keffler (1)
Stuart Adam Jay (1)
Total of 5 patent applications in 2008-2024.
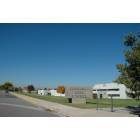
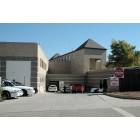
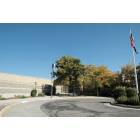
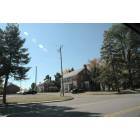
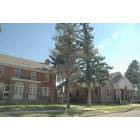
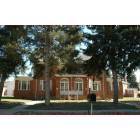
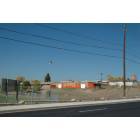
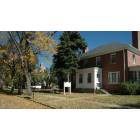
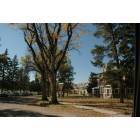
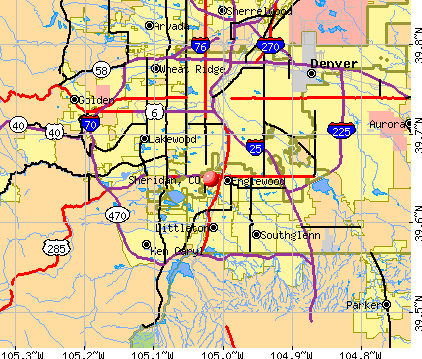


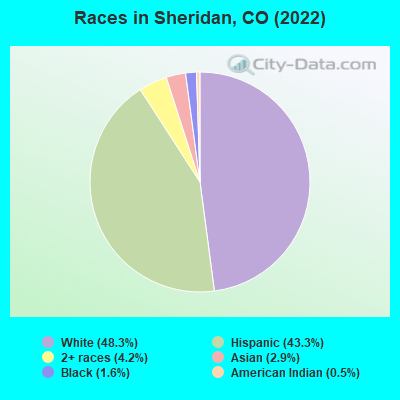
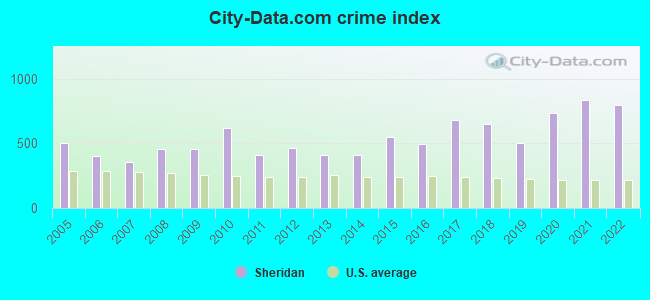
 Recent articles from our blog. Our writers, many of them Ph.D. graduates or candidates, create easy-to-read articles on a wide variety of topics.

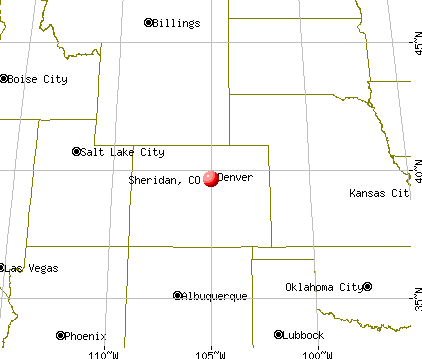
 , pop. 182,524).
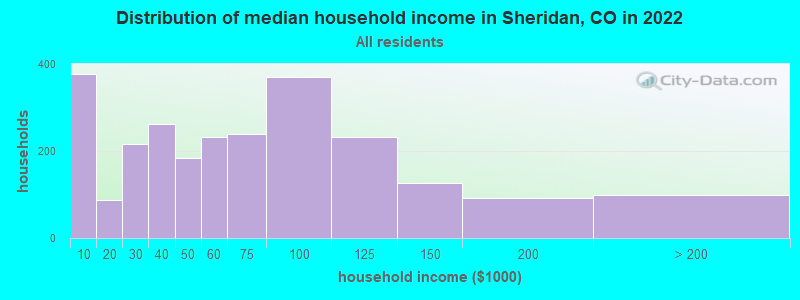
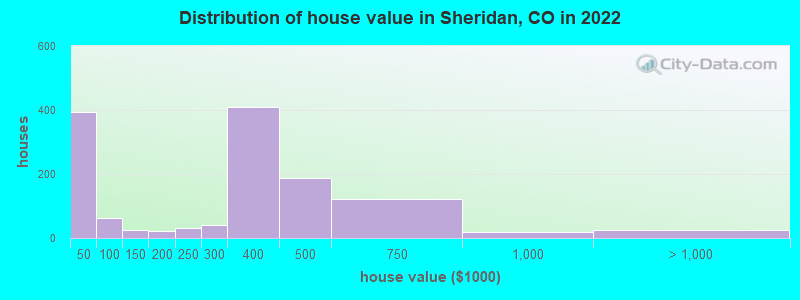
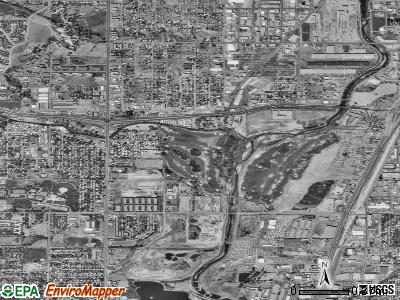
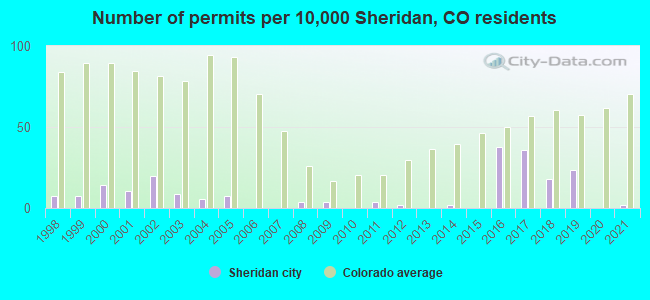
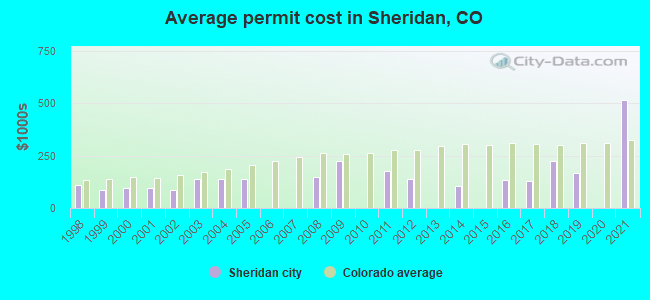
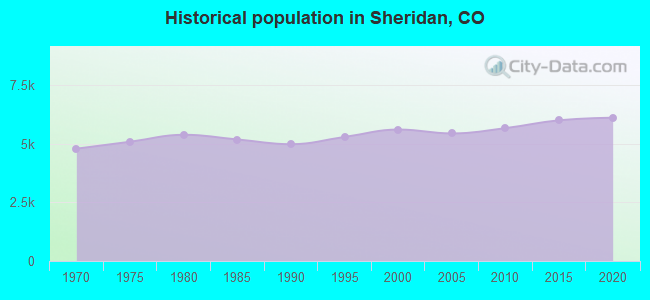
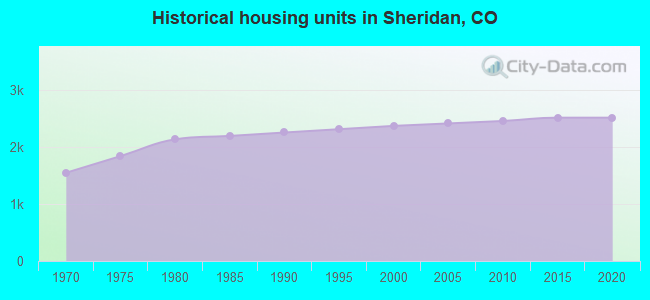
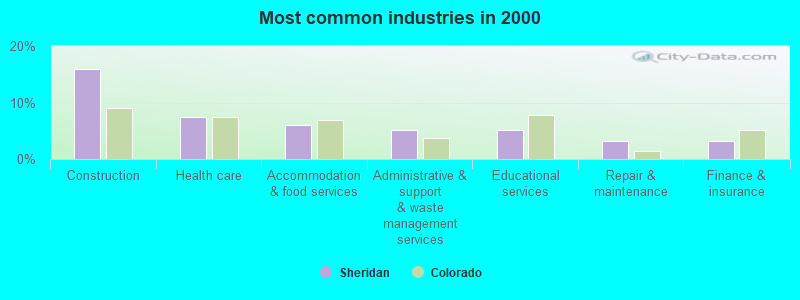

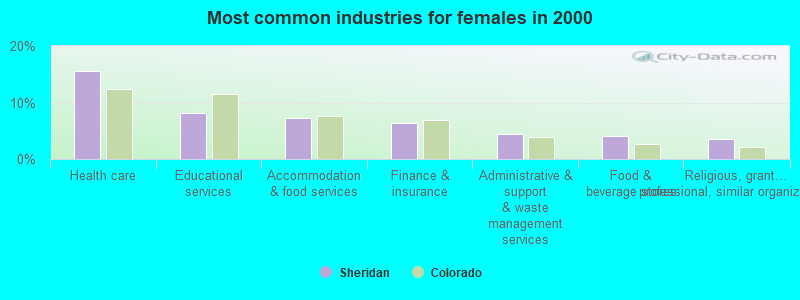
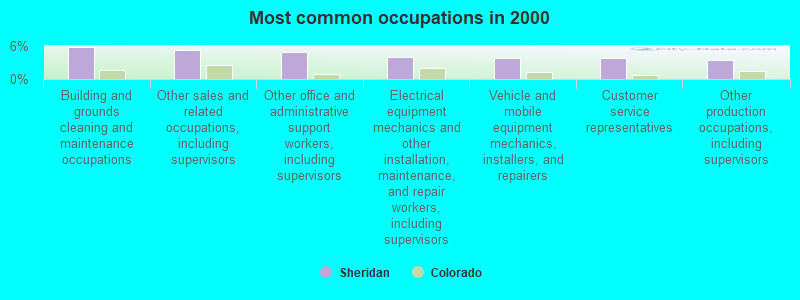
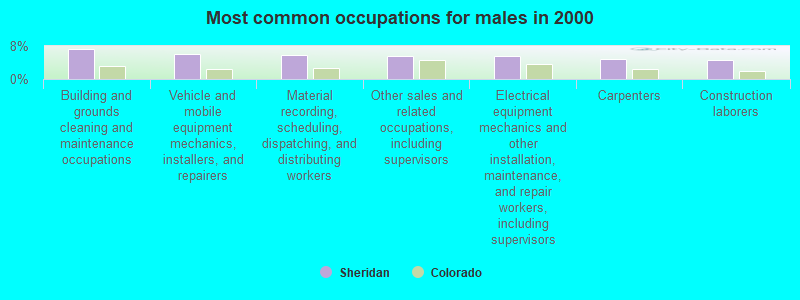
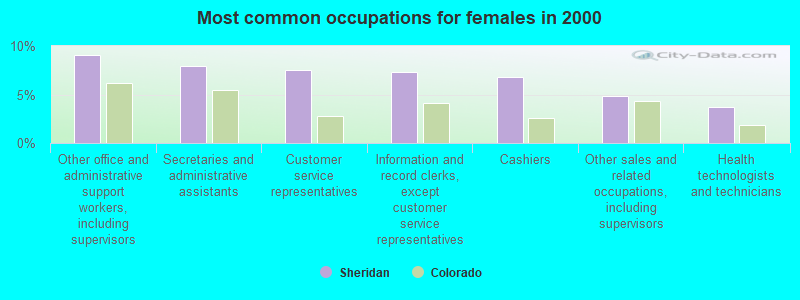


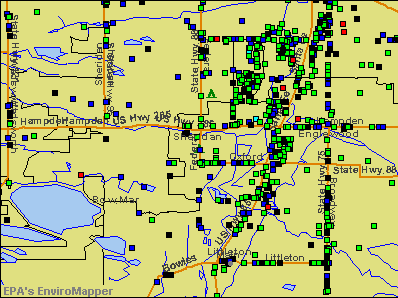

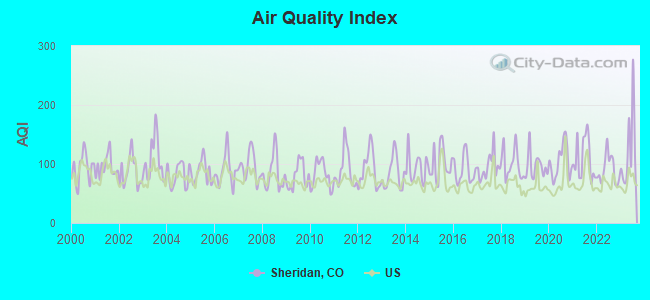
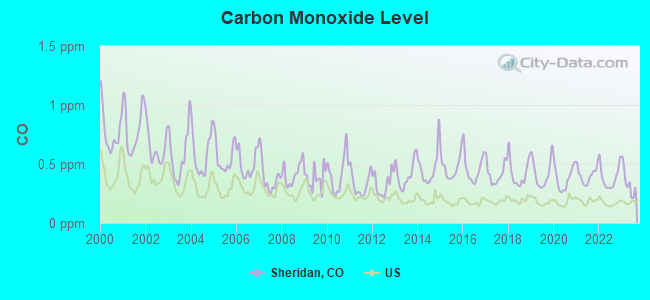
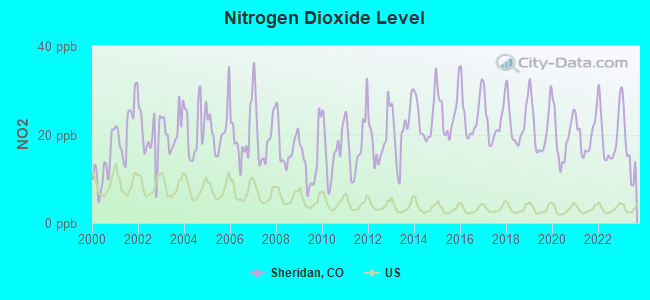
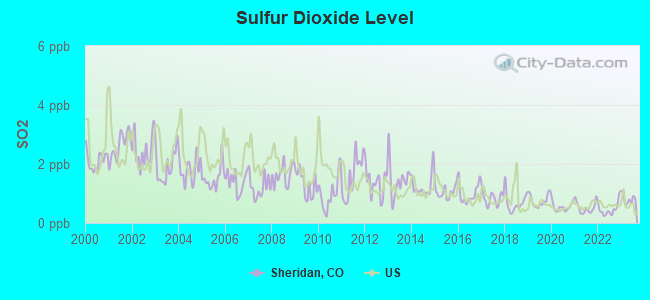
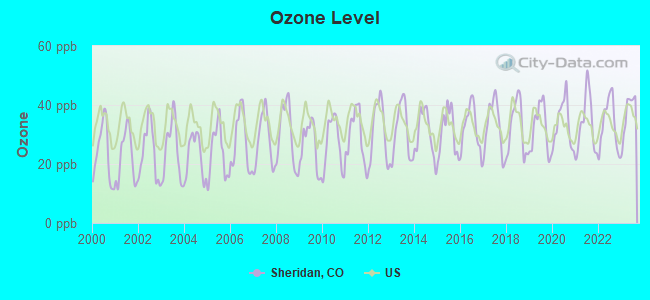
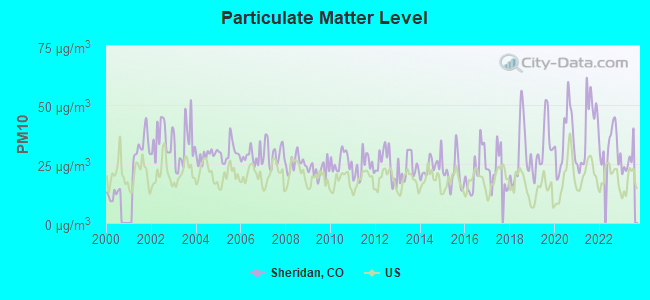
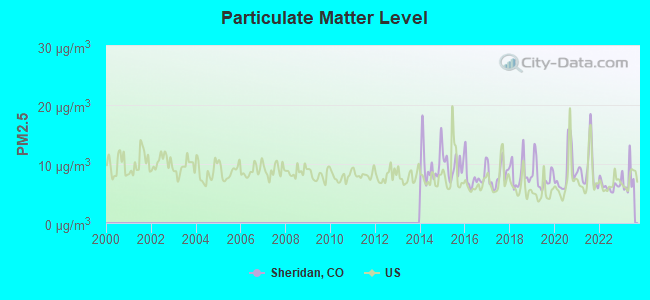
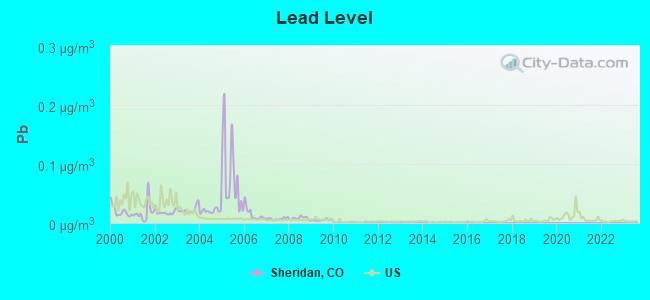
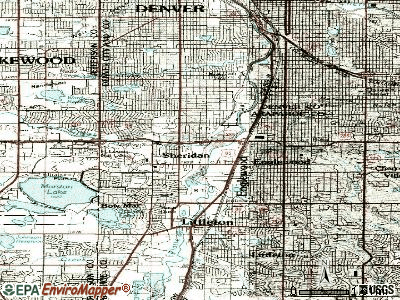
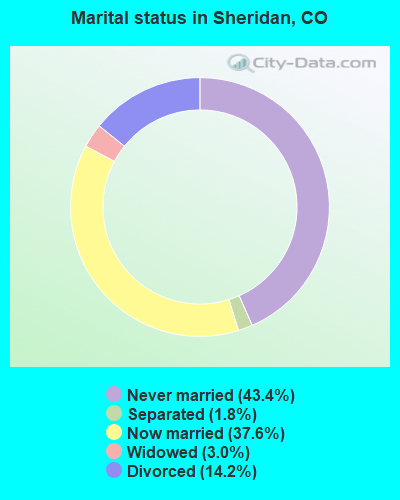
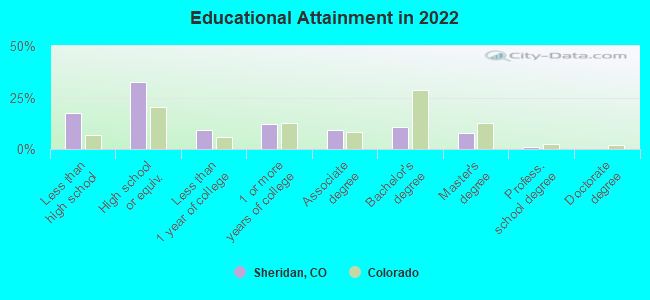
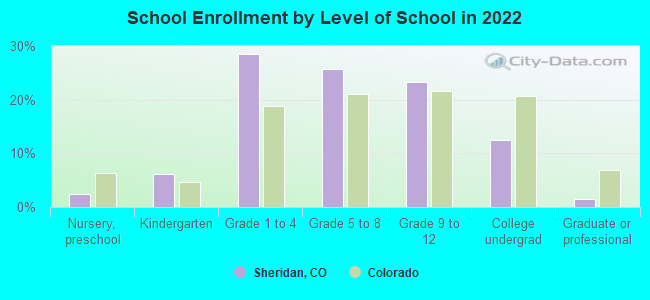
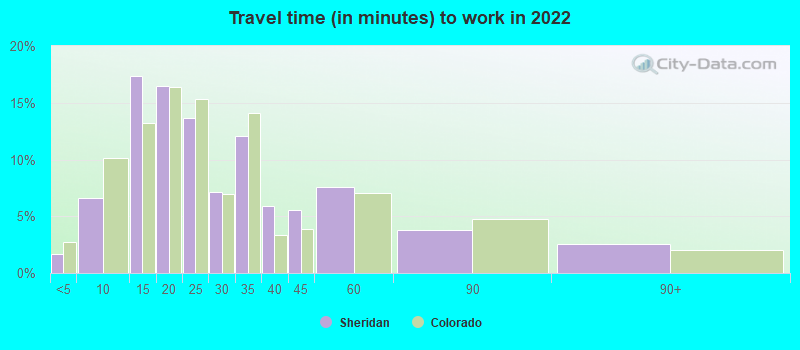
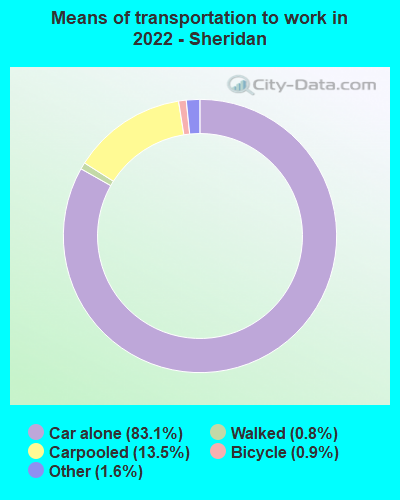
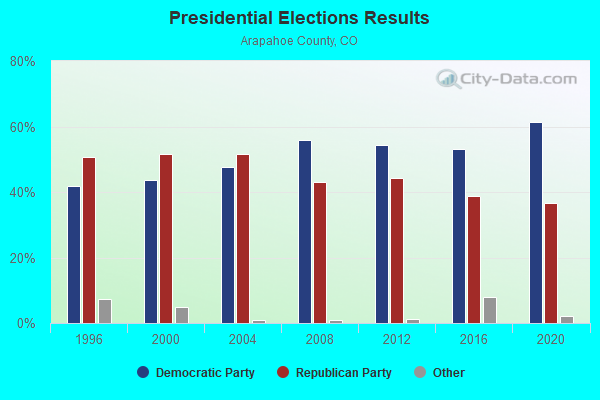
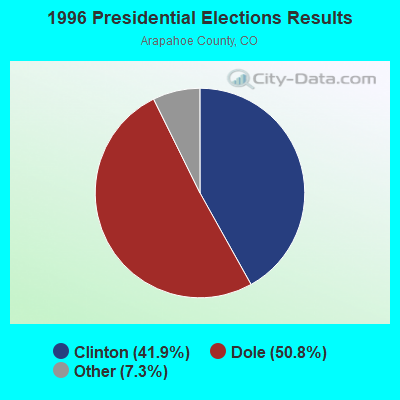
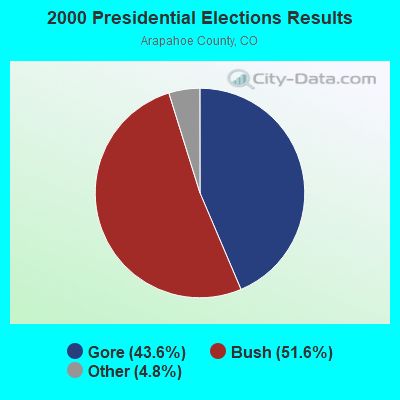
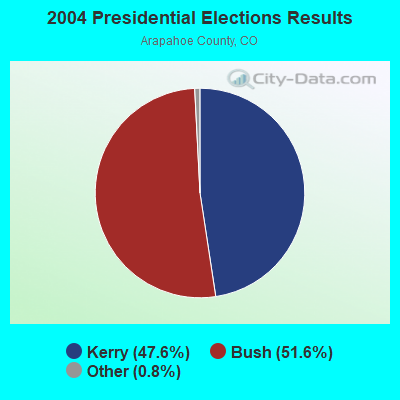
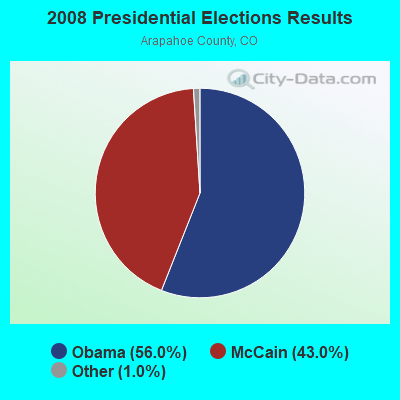

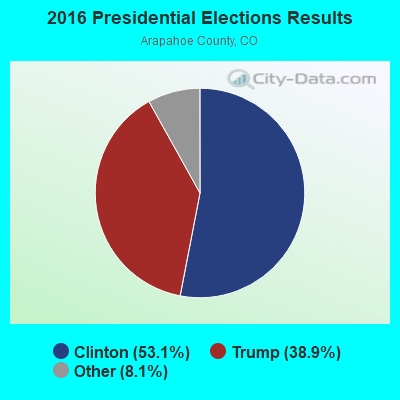
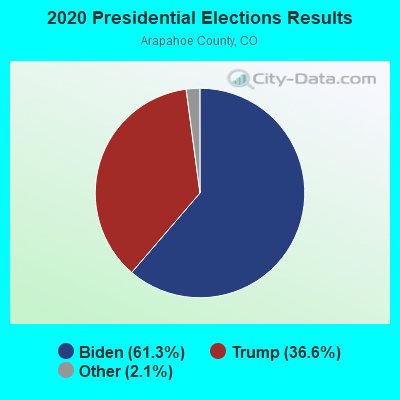
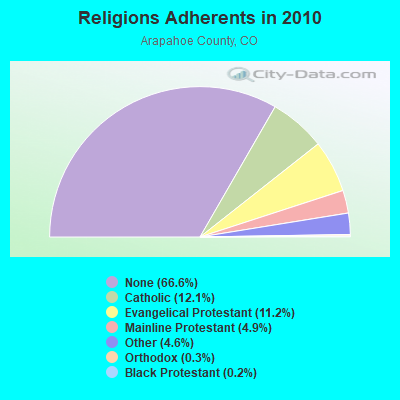
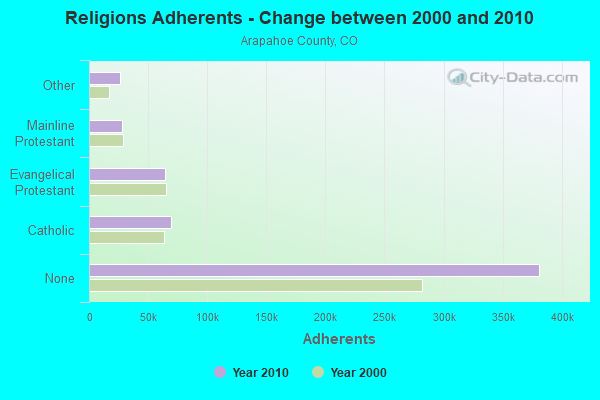
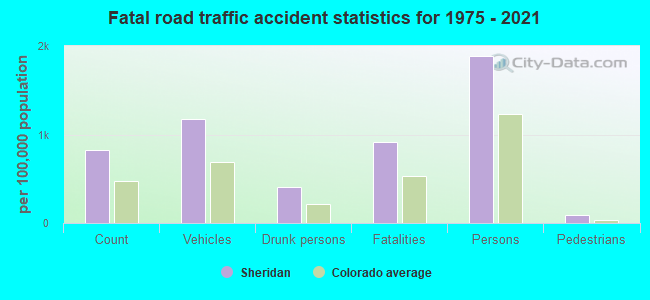
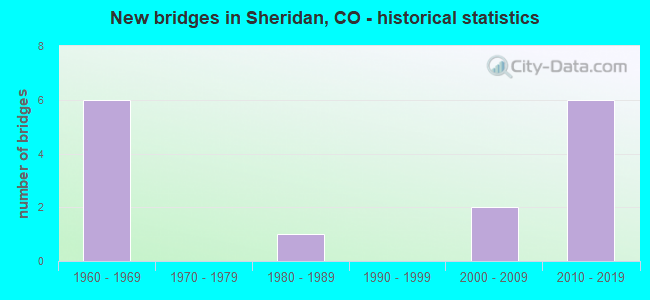
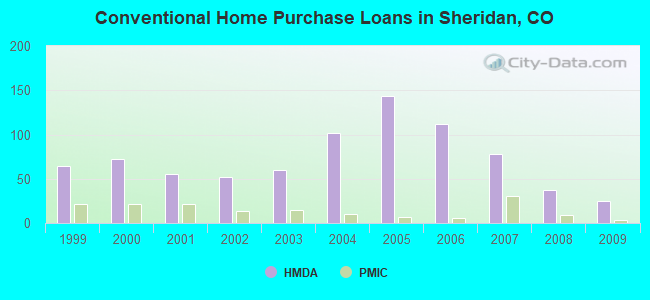
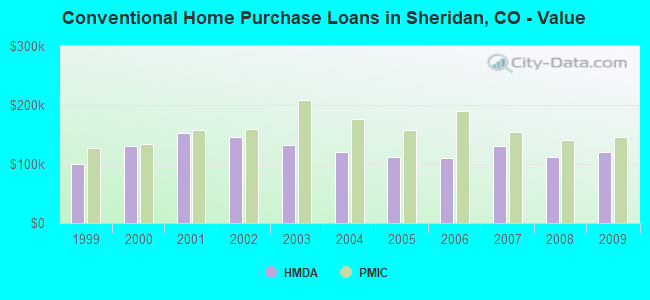
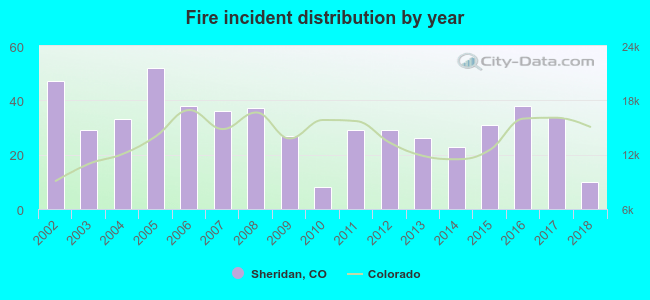 According to the data from the years 2002 - 2018 the average number of fires per year is 31. The highest number of reported fire incidents - 52 took place in 2005, and the least - 8 in 2010. The data has a declining trend.
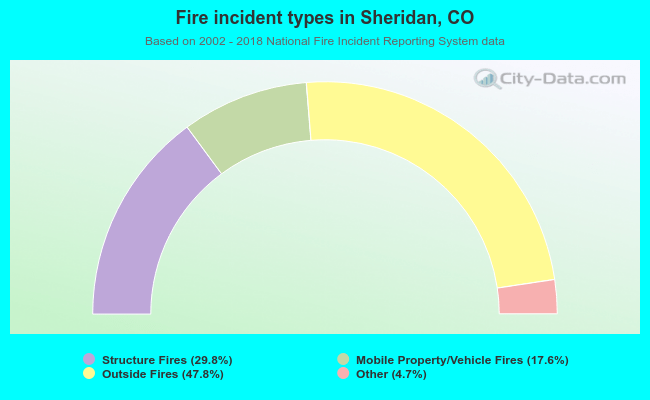 When looking into fire subcategories, the most reports belonged to: Outside Fires (47.8%), and Structure Fires (29.8%).