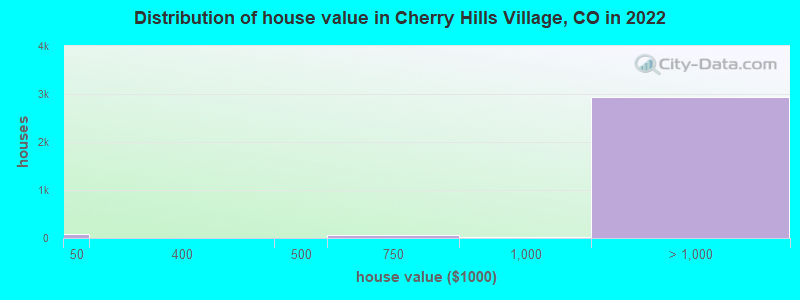
Estimated median house or condo value in 2022: over $1,000,000 (it was $886,200 in 2000)
Cherry Hills Village:
over $1,000,000
CO:
$531,100
Mean prices in 2022:all housing units: over $1,000,000; detached houses: over $1,000,000March 2022 cost of living index in Cherry Hills Village: 101.0 (near average, U.S. average is 100)
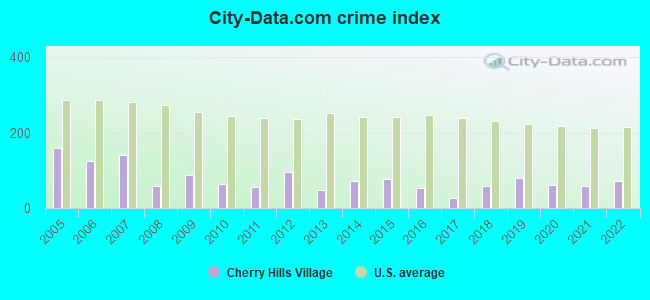
The City-Data.com crime index weighs serious crimes and violent crimes more heavily. Higher means more crime, U.S. average is 246.1. It adjusts for the number of visitors and daily workers commuting into cities.
Latest news from Cherry Hills Village, CO collected exclusively by city-data.com from local newspapers, TV, and radio stations
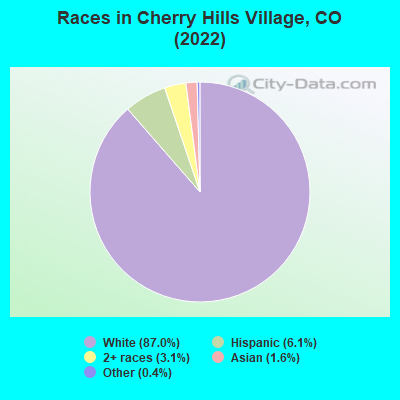
Ancestries: English (15.4%), American (11.6%), German (10.1%), Irish (9.0%), European (8.6%), Russian (2.9%).
Current Local Time: MST time zone
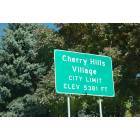
Elevation: 5395 feet
Land area: 6.22 square miles.
Population density: 1,016 people per square mile (low).
335 residents are foreign born (1.9% Asia, 1.5% Europe, 1.1% North America).
This city:
5.2%
Colorado:
9.5%
Median real estate property taxes paid for housing units with mortgages in 2022: $10,738 (0.5%) Median real estate property taxes paid for housing units with no mortgage in 2022: $10,104 (0.5%)
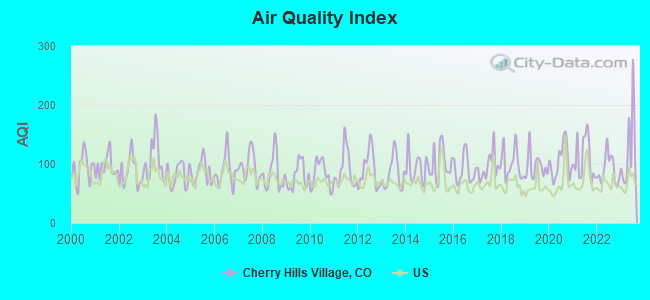
Air Quality Index (AQI) level in 2023 was 123. This is significantly worse than average.
City:
123
U.S.:
73
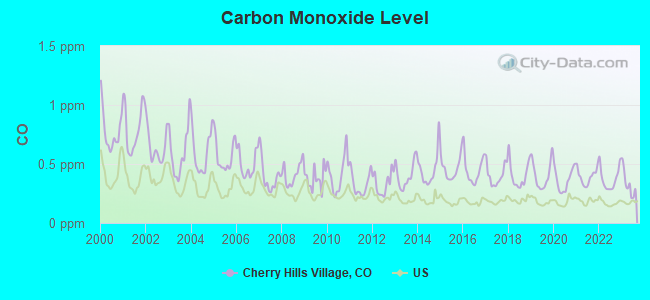
Carbon Monoxide (CO) [ppm] level in 2023 was 0.335. This is worse than average.Closest monitor was 1.5 miles away from the city center.
City:
0.335
U.S.:
0.251
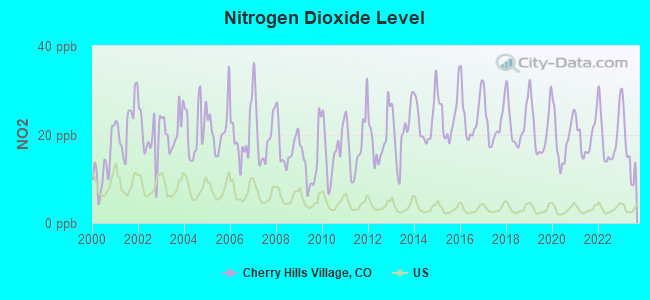
Nitrogen Dioxide (NO2) [ppb] level in 2023 was 16.9. This is significantly worse than average.Closest monitor was 7.5 miles away from the city center.
City:
16.9
U.S.:
5.1
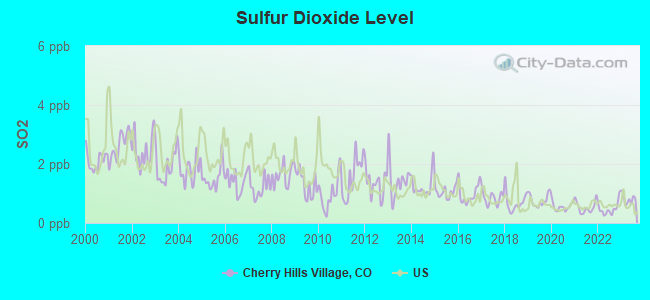
Sulfur Dioxide (SO2) [ppb] level in 2023 was 0.825. This is significantly better than average.Closest monitor was 3.9 miles away from the city center.
City:
0.825
U.S.:
1.515
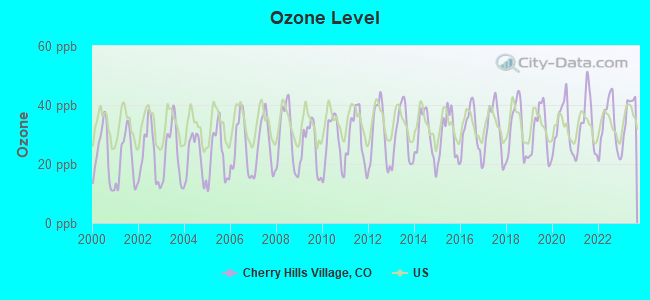
Ozone [ppb] level in 2023 was 36.8. This is about average.Closest monitor was 3.0 miles away from the city center.
City:
36.8
U.S.:
33.3
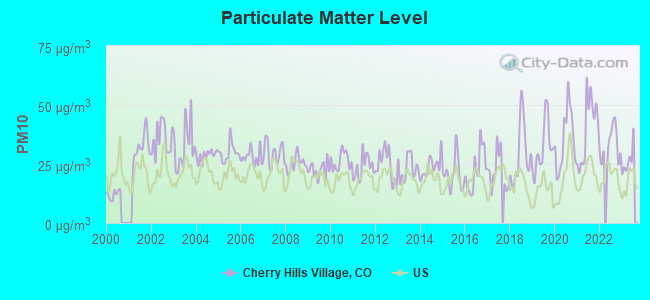
Particulate Matter (PM10) [µg/m3] level in 2023 was 26.4. This is worse than average.Closest monitor was 2.3 miles away from the city center.
City:
26.4
U.S.:
19.2
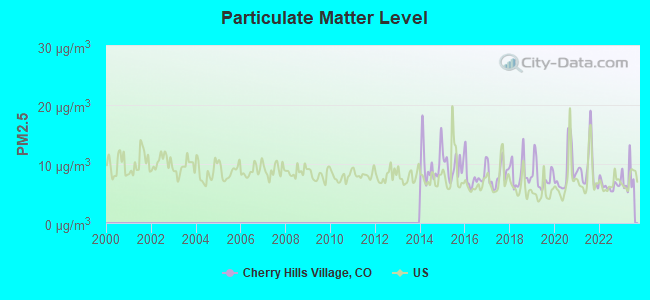
Particulate Matter (PM2.5) [µg/m3] level in 2023 was 7.61. This is about average.Closest monitor was 4.5 miles away from the city center.
City:
7.61
U.S.:
8.11
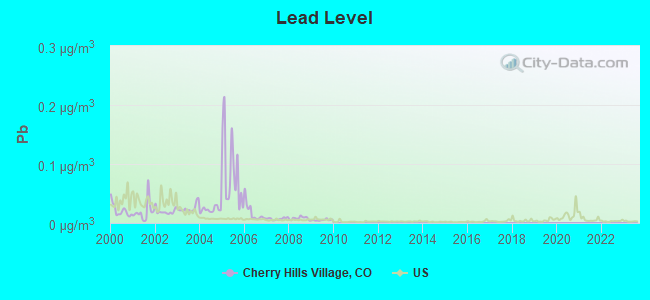
Lead (Pb) [µg/m3] level in 2009 was 0.00502. This is significantly better than average.Closest monitor was 2.3 miles away from the city center.
City:
0.00502
U.S.:
0.00931
Tornado activity:
Cherry Hills Village-area historical tornado activity is above Colorado state average. It is 27% greater than the overall U.S. average.
On 6/15/1988, a category F3 (max. wind speeds 158-206 mph) tornado 6.5 miles away from the Cherry Hills Village city center injured 7 peopleand causedbetween $5,000,000 and $50,000,000 in damages.
On 5/18/1975, a category F3 tornado 16.1 miles away from the city center .
Earthquake activity:
Cherry Hills Village-area historical earthquake activity is significantly above Colorado state average. It is 713% greater than the overall U.S. average.
On 8/18/1959 at 06:37:13, a magnitude 7.7 (7.7 UK, Class: Major, Intensity: VIII - XII) earthquake occurred 449.2 miles away from Cherry Hills Village center, causing $26,000,000 total damage On 10/18/1984 at 15:30:23, a magnitude 5.5 (5.4 MB, 5.1 MS, 5.5 ML, Class: Moderate, Intensity: VI - VII) earthquake occurred 193.5 miles away from the city center On 8/23/2011 at 05:46:18, a magnitude 5.3 (5.3 MW, Depth: 2.5 mi) earthquake occurred 178.6 miles away from the city center On 10/28/1983 at 14:06:06, a magnitude 7.3 (6.2 MB, 7.3 MS, 7.0 MW) earthquake occurred 549.4 miles away from the city center, causing 2 deaths (2 shaking deaths) and 3 injuries, causing $15,000,000 total damage On 8/10/2005 at 22:08:22, a magnitude 5.0 (5.0 MW, Depth: 3.1 mi) earthquake occurred 186.2 miles away from Cherry Hills Village center On 8/10/2005 at 22:08:22, a magnitude 5.0 (5.0 MB, 4.7 MS, 5.0 MW) earthquake occurred 188.2 miles away from the city center Magnitude types: body-wave magnitude (MB), local magnitude (ML), surface-wave magnitude (MS), moment magnitude (MW)
Natural disasters:
The number of natural disasters in Arapahoe County (10) is smaller than the US average (15). Major Disasters (Presidential) Declared: 5 Emergencies Declared: 4
Causes of natural disasters: Floods: 5, Storms: 4, Landslides: 2, Mudslides: 2, Snows: 2, Fire: 1, Heavy Rain: 1, Hurricane: 1, Snowstorm: 1, Tornado: 1, Other: 1 (Note: some incidents may be assigned to more than one category).
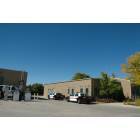
Hospitals and medical centers near Cherry Hills Village:
JULIA TEMPLE HEALTHCARE CENTER (Nursing Home, about 2 miles away; ENGLEWOOD, CO)
KINDRED TRANSITIONAL CARE AND REHABILITATION-CHERRY (Nursing Home, about 2 miles away; ENGLEWOOD, CO)
PEARL STREET HEALTH AND REHABILITATION CENTER (Nursing Home, about 2 miles away; ENGLEWOOD, CO)
SWEDISH MEDICAL CENTER Acute Care Hospitals (about 3 miles away; ENGLEWOOD, CO)
ENGLEWOOD DIALYSIS (DVA) (Dialysis Facility, about 3 miles away; ENGLEWOOD, CO)
SUITES AT CLERMONT PARK CARE CENTER (Nursing Home, about 3 miles away; DENVER, CO)
ORCHARD PARK HEALTH CARE CENTER (Nursing Home, about 3 miles away; LITTLETON, CO)
Amtrak station near Cherry Hills Village:
9 miles: DENVER (1701 WYNKOOP ST.) . Services: ticket office, fully wheelchair accessible, enclosed waiting area, public restrooms, public payphones, full-service food facilities and snack bar, paid short-term parking, paid long-term parking, call for car rental service, taxi stand, public transit connection.
Colleges/universities with over 2000 students nearest to Cherry Hills Village:
Colorado State University-Global Campus (about 4 miles; Greenwood Village, CO; Full-time enrollment: 3,642)
University of Denver (about 5 miles; Denver, CO; FT enrollment: 9,621)
Arapahoe Community College (about 5 miles; Littleton, CO; FT enrollment: 6,619)
Jones International University (about 6 miles; Centennial, CO; FT enrollment: 2,556)
Emily Griffith Technical College (about 8 miles; Denver, CO; FT enrollment: 2,460)
Community College of Denver (about 8 miles; Denver, CO; FT enrollment: 7,329)
Metropolitan State University of Denver (about 8 miles; Denver, CO; FT enrollment: 17,242)
Public elementary/middle school in Cherry Hills Village:
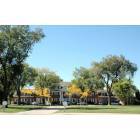
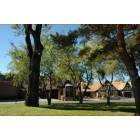
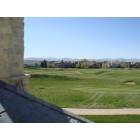
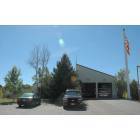
Notable locations in Cherry Hills Village: Cherry Hills Country Club (A), Glennmoor Country Club (B), Cherry Hills Village City Hall (C), Cherry Hills Village Police Department (D), South Metro Fire Rescue Authority Station 38 (E). Display/hide their locations on the map
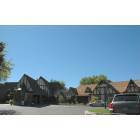
Churches in Cherry Hills Village include: Bethany Lutheran Church (A), First Plymouth Congregational Church (B), Colorado Community Church Englewood Campus (C), Denver First Church of the Nazarene (D), Church of Jesus Christ of Latter - Day Saints (E). Display/hide their locations on the map
Lakes and reservoirs: Buell Lake (A), Blackmer Number 1 Reservoir (B), Skeel Ranch Reservoir (C), Cherry Hills Lake (D), Blackmer Lake (E). Display/hide their locations on the map
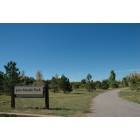
Parks in Cherry Hills Village include: Woody Hollow Park (1), Hopkins Farm (2), Dahlia Hollow Park (3), Three Pond Park (4). Display/hide their locations on the map
Arapahoe County has a predicted average indoor radon screening level greater than 4 pCi/L (pico curies per liter) - Highest Potential
Average household size:
This city:
3.0 people
Colorado:
2.5 people
Percentage of family households:
This city:
87.6%
Whole state:
63.9%
Percentage of households with unmarried partners:
This city:
1.8%
Whole state:
6.5%
Likely homosexual households (counted as self-reported same-sex unmarried-partner households)
Lesbian couples: 0.2% of all households
Gay men: 0.2% of all households
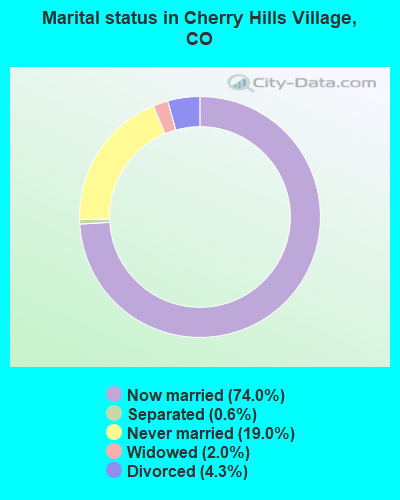
For population 15 years and over in Cherry Hills Village:
Never married: 19.0%
Now married: 74.0%
Separated: 0.6%
Widowed: 2.0%
Divorced: 4.3%
For population 25 years and over in Cherry Hills Village:
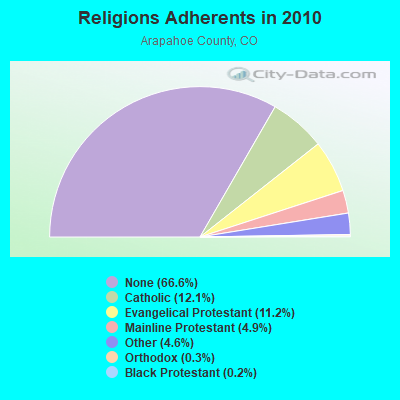
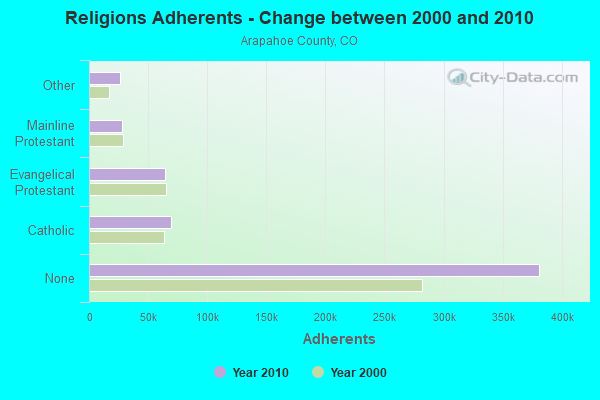
Religion statistics for Cherry Hills Village, CO (based on Arapahoe County data)
Religion
Adherents
Congregations
Catholic
69,031
13
Evangelical Protestant
64,204
178
Mainline Protestant
28,266
50
Other
26,495
53
Orthodox
1,780
4
Black Protestant
1,061
4
None
381,166
-
Source: Clifford Grammich, Kirk Hadaway, Richard Houseal, Dale E.Jones, Alexei Krindatch, Richie Stanley and Richard H.Taylor. 2012. 2010 U.S.Religion Census: Religious Congregations & Membership Study. Association of Statisticians of American Religious Bodies. Jones, Dale E., et al. 2002. Congregations and Membership in the United States 2000. Nashville, TN: Glenmary Research Center. Graphs represent county-level data
86,288Total future (year 2040) average daily traffic
FCC Registered Amateur Radio Licenses:
2
Call Sign: KT3M, Licensee ID: L00796851, Grant Date: 08/19/2014, Expiration Date: 08/20/2024, Certifier: Rob Donziger, Registrant: Rob Donziger, 4000 South Ash St., Cherry Hills Village, CO 80113
Call Sign: WA3IPE, Licensee ID: L00549570, Grant Date: 07/16/2016, Expiration Date: 07/16/2026, Certifier: Richard A Spritz, Registrant: Richard A Spritz, 3701 S Lafayette St, Cherry Hills Village, CO 80113
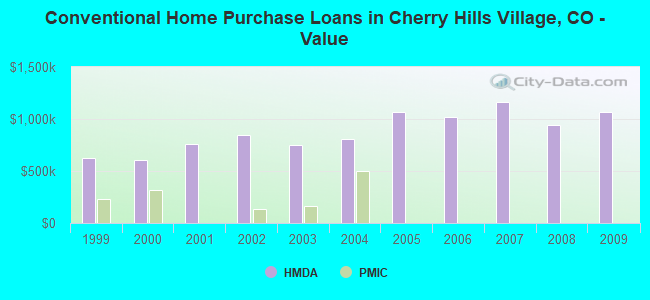
Home Mortgage Disclosure Act Aggregated Statistics For Year 2009 (Based on 2 full tracts)
A) FHA, FSA/RHS & VA Home Purchase Loans
B) Conventional Home Purchase Loans
C) Refinancings
D) Home Improvement Loans
F) Non-occupant Loans on < 5 Family Dwellings (A B C & D)
Number
Average Value
Number
Average Value
Number
Average Value
Number
Average Value
Number
Average Value
LOANS ORIGINATED
1
$640,000
56
$1,071,875
275
$667,898
6
$501,167
4
$1,531,250
APPLICATIONS APPROVED, NOT ACCEPTED
0
$0
12
$1,730,833
32
$566,688
0
$0
2
$500,000
APPLICATIONS DENIED
1
$264,000
11
$887,727
78
$1,086,756
5
$363,000
5
$592,600
APPLICATIONS WITHDRAWN
1
$196,000
4
$1,217,500
28
$667,857
3
$131,667
1
$87,000
FILES CLOSED FOR INCOMPLETENESS
0
$0
2
$712,500
9
$1,435,444
0
$0
1
$650,000
Aggregated Statistics For Year 2008 (Based on 2 full tracts)
A) FHA, FSA/RHS & VA Home Purchase Loans
B) Conventional Home Purchase Loans
C) Refinancings
D) Home Improvement Loans
F) Non-occupant Loans on < 5 Family Dwellings (A B C & D)
Number
Average Value
Number
Average Value
Number
Average Value
Number
Average Value
Number
Average Value
LOANS ORIGINATED
0
$0
80
$946,575
102
$935,627
5
$628,200
13
$1,396,846
APPLICATIONS APPROVED, NOT ACCEPTED
1
$217,000
5
$1,863,400
9
$1,236,889
2
$60,000
1
$1,200,000
APPLICATIONS DENIED
0
$0
13
$990,462
30
$1,400,433
5
$223,400
2
$1,071,500
APPLICATIONS WITHDRAWN
0
$0
9
$1,340,889
24
$711,083
3
$450,000
3
$297,667
FILES CLOSED FOR INCOMPLETENESS
0
$0
2
$1,300,000
4
$1,675,250
3
$170,333
1
$1,000,000
Aggregated Statistics For Year 2007 (Based on 2 full tracts)
B) Conventional Home Purchase Loans
C) Refinancings
D) Home Improvement Loans
F) Non-occupant Loans on < 5 Family Dwellings (A B C & D)
Number
Average Value
Number
Average Value
Number
Average Value
Number
Average Value
LOANS ORIGINATED
85
$1,159,729
123
$1,208,463
5
$728,000
4
$1,243,250
APPLICATIONS APPROVED, NOT ACCEPTED
14
$855,214
19
$1,137,947
1
$900,000
1
$650,000
APPLICATIONS DENIED
20
$1,195,200
45
$1,483,667
8
$542,500
1
$2,340,000
APPLICATIONS WITHDRAWN
11
$1,006,545
26
$1,149,385
4
$901,750
1
$1,995,000
FILES CLOSED FOR INCOMPLETENESS
1
$1,000,000
10
$1,051,700
0
$0
0
$0
Aggregated Statistics For Year 2006 (Based on 2 full tracts)
B) Conventional Home Purchase Loans
C) Refinancings
D) Home Improvement Loans
E) Loans on Dwellings For 5+ Families
F) Non-occupant Loans on < 5 Family Dwellings (A B C & D)
Number
Average Value
Number
Average Value
Number
Average Value
Number
Average Value
Number
Average Value
LOANS ORIGINATED
115
$1,017,643
140
$919,579
8
$1,042,500
0
$0
16
$1,149,125
APPLICATIONS APPROVED, NOT ACCEPTED
17
$1,062,765
15
$805,933
0
$0
1
$125,000
1
$960,000
APPLICATIONS DENIED
30
$1,143,767
39
$860,128
1
$10,000
0
$0
5
$696,200
APPLICATIONS WITHDRAWN
15
$1,672,800
27
$1,030,926
1
$1,500,000
0
$0
2
$906,500
FILES CLOSED FOR INCOMPLETENESS
10
$1,143,700
11
$591,818
0
$0
0
$0
0
$0
Aggregated Statistics For Year 2005 (Based on 2 full tracts)
A) FHA, FSA/RHS & VA Home Purchase Loans
B) Conventional Home Purchase Loans
C) Refinancings
D) Home Improvement Loans
F) Non-occupant Loans on < 5 Family Dwellings (A B C & D)
Number
Average Value
Number
Average Value
Number
Average Value
Number
Average Value
Number
Average Value
LOANS ORIGINATED
0
$0
114
$1,067,693
199
$883,588
9
$774,778
10
$1,349,500
APPLICATIONS APPROVED, NOT ACCEPTED
0
$0
25
$1,078,080
16
$857,250
1
$6,000
0
$0
APPLICATIONS DENIED
0
$0
25
$1,233,560
47
$1,313,043
2
$305,000
2
$886,500
APPLICATIONS WITHDRAWN
1
$148,000
18
$650,722
47
$921,787
0
$0
1
$500,000
FILES CLOSED FOR INCOMPLETENESS
0
$0
7
$816,429
14
$814,143
0
$0
0
$0
Aggregated Statistics For Year 2004 (Based on 2 full tracts)
B) Conventional Home Purchase Loans
C) Refinancings
D) Home Improvement Loans
E) Loans on Dwellings For 5+ Families
F) Non-occupant Loans on < 5 Family Dwellings (A B C & D)
Number
Average Value
Number
Average Value
Number
Average Value
Number
Average Value
Number
Average Value
LOANS ORIGINATED
146
$808,705
234
$806,038
11
$463,727
1
$1,214,000
12
$859,417
APPLICATIONS APPROVED, NOT ACCEPTED
21
$910,048
29
$828,483
4
$193,250
0
$0
1
$540,000
APPLICATIONS DENIED
22
$992,091
52
$1,265,769
5
$155,000
0
$0
1
$115,000
APPLICATIONS WITHDRAWN
21
$783,619
35
$986,800
0
$0
0
$0
0
$0
FILES CLOSED FOR INCOMPLETENESS
3
$1,613,333
9
$860,222
1
$120,000
0
$0
1
$3,960,000
Aggregated Statistics For Year 2003 (Based on 2 full tracts)
A) FHA, FSA/RHS & VA Home Purchase Loans
B) Conventional Home Purchase Loans
C) Refinancings
D) Home Improvement Loans
F) Non-occupant Loans on < 5 Family Dwellings (A B C & D)
Number
Average Value
Number
Average Value
Number
Average Value
Number
Average Value
Number
Average Value
LOANS ORIGINATED
5
$212,200
103
$750,194
552
$615,424
8
$243,875
7
$266,286
APPLICATIONS APPROVED, NOT ACCEPTED
0
$0
8
$573,875
46
$557,957
0
$0
1
$535,000
APPLICATIONS DENIED
0
$0
22
$800,091
86
$731,488
3
$65,000
2
$1,342,500
APPLICATIONS WITHDRAWN
3
$105,667
12
$702,417
44
$786,000
1
$32,000
1
$1,275,000
FILES CLOSED FOR INCOMPLETENESS
0
$0
4
$696,000
20
$484,450
0
$0
0
$0
Aggregated Statistics For Year 2002 (Based on 2 full tracts)
A) FHA, FSA/RHS & VA Home Purchase Loans
B) Conventional Home Purchase Loans
C) Refinancings
D) Home Improvement Loans
F) Non-occupant Loans on < 5 Family Dwellings (A B C & D)
Number
Average Value
Number
Average Value
Number
Average Value
Number
Average Value
Number
Average Value
LOANS ORIGINATED
1
$142,000
106
$846,689
593
$633,214
9
$103,778
11
$762,000
APPLICATIONS APPROVED, NOT ACCEPTED
0
$0
14
$718,071
61
$602,705
1
$113,000
1
$539,000
APPLICATIONS DENIED
0
$0
14
$551,071
53
$603,509
3
$181,333
3
$362,667
APPLICATIONS WITHDRAWN
0
$0
17
$865,176
64
$568,938
2
$314,000
4
$1,401,000
FILES CLOSED FOR INCOMPLETENESS
0
$0
2
$1,150,000
10
$597,700
1
$300,000
0
$0
Aggregated Statistics For Year 2001 (Based on 2 full tracts)
A) FHA, FSA/RHS & VA Home Purchase Loans
B) Conventional Home Purchase Loans
C) Refinancings
D) Home Improvement Loans
F) Non-occupant Loans on < 5 Family Dwellings (A B C & D)
Number
Average Value
Number
Average Value
Number
Average Value
Number
Average Value
Number
Average Value
LOANS ORIGINATED
0
$0
101
$756,030
379
$568,340
16
$146,625
6
$528,833
APPLICATIONS APPROVED, NOT ACCEPTED
0
$0
9
$668,778
27
$624,593
6
$99,167
0
$0
APPLICATIONS DENIED
0
$0
11
$622,545
44
$755,636
1
$50,000
1
$1,439,000
APPLICATIONS WITHDRAWN
1
$236,000
11
$620,000
28
$485,536
4
$163,750
2
$378,000
FILES CLOSED FOR INCOMPLETENESS
0
$0
5
$621,600
16
$570,812
4
$232,500
0
$0
Aggregated Statistics For Year 2000 (Based on 2 full tracts)
B) Conventional Home Purchase Loans
C) Refinancings
D) Home Improvement Loans
F) Non-occupant Loans on < 5 Family Dwellings (A B C & D)
Number
Average Value
Number
Average Value
Number
Average Value
Number
Average Value
LOANS ORIGINATED
104
$605,269
94
$520,330
19
$1,428,789
4
$722,750
APPLICATIONS APPROVED, NOT ACCEPTED
16
$671,000
12
$590,417
8
$101,875
2
$292,500
APPLICATIONS DENIED
23
$739,783
38
$582,289
14
$113,929
1
$860,000
APPLICATIONS WITHDRAWN
9
$917,333
12
$894,583
3
$168,000
2
$919,500
FILES CLOSED FOR INCOMPLETENESS
4
$458,000
2
$500,000
0
$0
0
$0
Aggregated Statistics For Year 1999 (Based on 2 full tracts)
A) FHA, FSA/RHS & VA Home Purchase Loans
B) Conventional Home Purchase Loans
C) Refinancings
D) Home Improvement Loans
F) Non-occupant Loans on < 5 Family Dwellings (A B C & D)
#8 on the list of "Top 101 cities with the most residents born in Other South Eastern Asia (population 500+)"
#10 on the list of "Top 101 cities with largest percentage of males in occupations: legal occupations (population 5,000+)"
#11 on the list of "Top 101 cities with the highest cost per building permit(population 5,000+)"
#13 on the list of "Top 101 cities with largest percentage of males in industries: real estate and rental and leasing (population 5,000+)"
#23 on the list of "Top 101 cities with largest percentage of males in occupations: health diagnosing and treating practitioners and other technical occupations (population 5,000+)"
#24 on the list of "Top 100 cities with highest median household income"
#28 on the list of "Top 101 cities with largest percentage of females in occupations: legal occupations (population 5,000+)"
#37 on the list of "Top 100 cities with highest median house value"
#38 on the list of "Top 101 cities with the lowest percentage of single-parent households, population 5,000+"
#38 on the list of "Top 101 cities with the most people having professional degrees (population 500+)"
#40 on the list of "Top 101 cities with largest percentage of females in occupations: arts, design, entertainment, sports, and media occupations (population 5,000+)"
#40 on the list of "Top 100 best educated cities (highest percentage of bachelor degree holding residents) (pop. 5,000+)"
#43 on the list of "Top 101 cities with largest percentage of males in industries: professional, scientific, and technical services (population 5,000+)"
#45 on the list of "Top 101 cities with largest percentage of females in industries: professional, scientific, and technical services (population 5,000+)"
#52 on the list of "Top 101 cities with the largest percentage of high school students in private schools (500+ students)"
#55 on the list of "Top 101 cities with largest percentage of females in industries: real estate and rental and leasing (population 5,000+)"
#55 on the list of "Top 100 cities with biggest houses (pop. 5,000+)"
#62 on the list of "Top 101 cities with the largest city-data.com crime index increase from 2011 to 2012 (population 5,000+)"
#67 on the list of "Top 101 cities with largest percentage of males in occupations: business and financial operations occupations (population 5,000+)"
#73 on the list of "Top 101 cities with the highest percentage of workers working at home, population 5,000+"
#11 on the list of "Top 101 counties with the largest increase in the number of infant deaths per 1000 residents 2000-2006 to 2007-2013 (pop. 50,000+)"
#19 on the list of "Top 101 counties with the highest Ozone (1-hour) air pollution readings in 2012 (ppm)"
#40 on the list of "Top 101 counties with the highest percentage of residents that exercised in the past month"
#46 on the list of "Top 101 counties with the highest percentage of residents relocating from other counties between 2010 and 2011 (pop. 50,000+)"
#47 on the list of "Top 101 counties with the best general health status score of residents (1-5), 3 years of data"


 Recent articles from our blog. Our writers, many of them Ph.D. graduates or candidates, create easy-to-read articles on a wide variety of topics.

 , pop. 182,524).