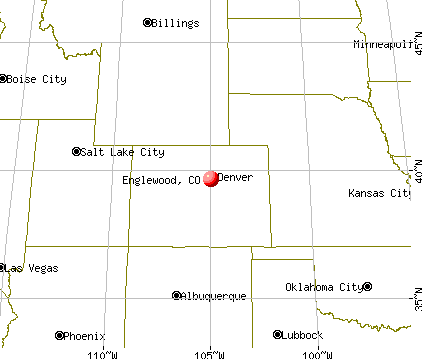
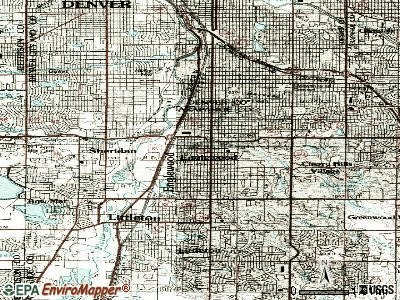
Englewood, Colorado
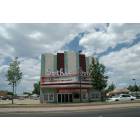
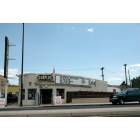
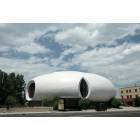
Englewood: Theater
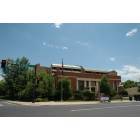
Englewood: Post Office
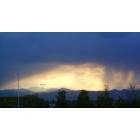
Englewood: Sun setting over Englewood
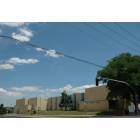
Englewood: Middle School
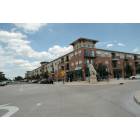
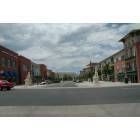
Englewood: Downtown Block
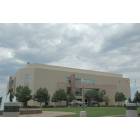
Englewood: Surplus
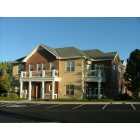
Englewood: 68 Inverness Ln E, 80112
Englewood: Municipal Bldg
Englewood
Englewood
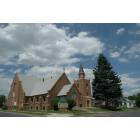
Englewood: Church
- see
21
more - add
your
Submit your own pictures of this city and show them to the world
- OSM Map
- General Map
- Google Map
- MSN Map
Population change since 2000: +6.0%
 |
| Males: 16,661 | |
| Females: 16,981 |
| Median resident age: | 36.6 years |
| Colorado median age: | 37.7 years |
Zip codes: 80120.
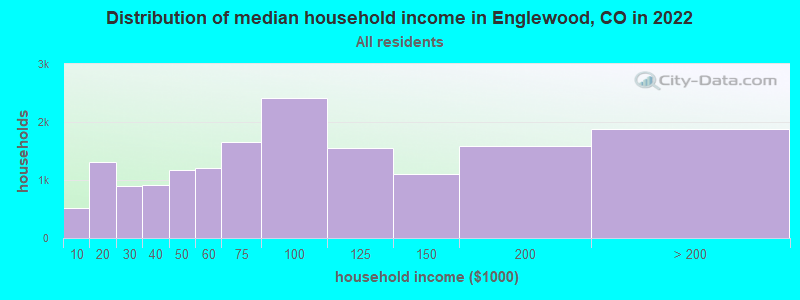
| Englewood: | $80,658 |
| CO: | $89,302 |
Estimated per capita income in 2022: $51,065 (it was $20,904 in 2000)
Englewood city income, earnings, and wages data
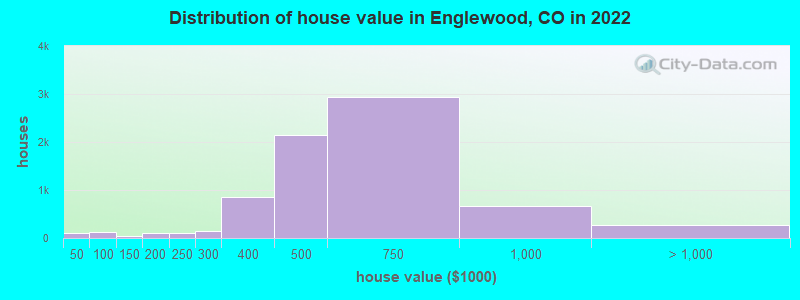
Estimated median house or condo value in 2022: $539,942 (it was $143,300 in 2000)
| Englewood: | $539,942 |
| CO: | $531,100 |
Mean prices in 2022: all housing units: $593,703; detached houses: $624,251; townhouses or other attached units: $604,470; in 2-unit structures: $287,622; in 5-or-more-unit structures: $319,481; mobile homes: $60,675
Median gross rent in 2022: $1,529.
(7.6% for White Non-Hispanic residents, 16.0% for Black residents, 8.9% for Hispanic or Latino residents, 13.3% for American Indian residents, 5.7% for other race residents, 13.0% for two or more races residents)
Detailed information about poverty and poor residents in Englewood, CO


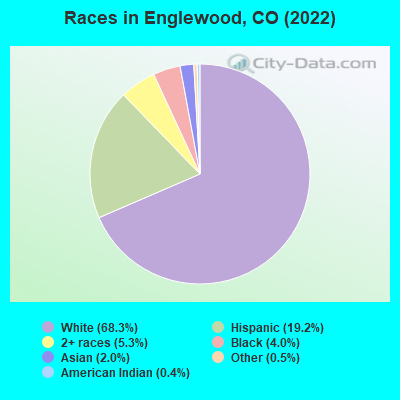
- 23,02368.3%White alone
- 6,46819.2%Hispanic
- 1,7885.3%Two or more races
- 1,3594.0%Black alone
- 6722.0%Asian alone
- 1550.5%Other race alone
- 1510.4%American Indian alone
- 220.07%Native Hawaiian and Other
Pacific Islander alone
According to our research of Colorado and other state lists, there were 70 registered sex offenders living in Englewood, Colorado as of May 08, 2024.
The ratio of all residents to sex offenders in Englewood is 479 to 1.
The ratio of registered sex offenders to all residents in this city is near the state average.
Type |
2009 |
2010 |
2011 |
2012 |
2013 |
2014 |
2015 |
2016 |
2017 |
2018 |
2019 |
2020 |
2021 |
2022 |
|---|---|---|---|---|---|---|---|---|---|---|---|---|---|---|
| Murders (per 100,000) | 3 (9.2) | 1 (3.3) | 0 (0.0) | 0 (0.0) | 1 (3.2) | 0 (0.0) | 1 (3.0) | 1 (3.0) | 1 (2.9) | 0 (0.0) | 1 (2.8) | 1 (2.8) | 2 (5.6) | 4 (12.0) |
| Rapes (per 100,000) | 16 (48.9) | 16 (52.9) | 14 (45.5) | 12 (38.3) | 12 (38.2) | 8 (25.1) | 10 (30.3) | 15 (44.6) | 8 (23.0) | 11 (31.4) | 10 (28.4) | 9 (25.4) | 19 (53.3) | 37 (110.6) |
| Robberies (per 100,000) | 28 (85.5) | 27 (89.2) | 34 (110.5) | 27 (86.1) | 22 (69.9) | 23 (72.3) | 17 (51.5) | 20 (59.4) | 23 (66.3) | 27 (77.1) | 19 (53.9) | 15 (42.3) | 44 (123.5) | 45 (134.5) |
| Assaults (per 100,000) | 163 (497.7) | 101 (333.8) | 20 (65.0) | 22 (70.2) | 19 (60.4) | 33 (103.7) | 22 (66.6) | 41 (121.8) | 40 (115.2) | 50 (142.7) | 44 (124.7) | 69 (194.6) | 184 (516.4) | 186 (556.0) |
| Burglaries (per 100,000) | 226 (690.1) | 254 (839.5) | 217 (705.0) | 220 (701.6) | 190 (604.1) | 231 (726.1) | 182 (550.9) | 159 (472.4) | 234 (674.2) | 174 (496.7) | 109 (309.0) | 168 (473.7) | 259 (726.9) | 323 (965.6) |
| Thefts (per 100,000) | 1,425 (4,351) | 1,520 (5,024) | 1,329 (4,317) | 1,406 (4,484) | 1,277 (4,060) | 1,395 (4,385) | 1,260 (3,814) | 1,274 (3,785) | 1,416 (4,080) | 1,645 (4,696) | 1,441 (4,085) | 1,543 (4,351) | 1,587 (4,454) | 1,441 (4,308) |
| Auto thefts (per 100,000) | 230 (702.3) | 194 (641.2) | 164 (532.8) | 180 (574.0) | 158 (502.3) | 143 (449.5) | 163 (493.4) | 253 (751.7) | 302 (870.1) | 327 (933.5) | 303 (859.0) | 409 (1,153) | 584 (1,639) | 628 (1,877) |
| Arson (per 100,000) | 14 (42.7) | 8 (26.4) | 12 (39.0) | 8 (25.5) | 1 (3.2) | 6 (18.9) | 9 (27.2) | 6 (17.8) | 10 (28.8) | 10 (28.5) | 13 (36.9) | 21 (59.2) | 17 (47.7) | 20 (59.8) |
| City-Data.com crime index | 461.1 | 453.5 | 347.2 | 344.9 | 314.8 | 324.7 | 289.6 | 328.4 | 347.1 | 374.1 | 323.2 | 377.0 | 554.4 | 654.0 |
The City-Data.com crime index weighs serious crimes and violent crimes more heavily. Higher means more crime, U.S. average is 246.1. It adjusts for the number of visitors and daily workers commuting into cities.

Crime rate in Englewood detailed stats: murders, rapes, robberies, assaults, burglaries, thefts, arson
Full-time law enforcement employees in 2021, including police officers: 111 (74 officers - 64 male; 10 female).
| Officers per 1,000 residents here: | 2.08 |
| Colorado average: | 2.14 |
 Recent articles from our blog. Our writers, many of them Ph.D. graduates or candidates, create easy-to-read articles on a wide variety of topics.


Latest news from Englewood, CO collected exclusively by city-data.com from local newspapers, TV, and radio stations
Ancestries: German (10.0%), Irish (7.7%), English (7.4%), American (6.7%), European (5.2%), Italian (2.6%).
Current Local Time: MST time zone
Incorporated on 5/9/1903
Elevation: 5369 feet
Land area: 6.55 square miles.
Population density: 5,134 people per square mile (average).
2,428 residents are foreign born (3.6% Latin America, 1.2% Asia, 1.0% Europe, 0.8% Africa).
| This city: | 7.2% |
| Colorado: | 9.5% |
Median real estate property taxes paid for housing units with mortgages in 2022: $2,156 (0.4%)
Median real estate property taxes paid for housing units with no mortgage in 2022: $1,879 (0.4%)
Nearest city with pop. 50,000+: Southwest Arapahoe, CO (2.7 miles  , pop. 182,524).
Nearest city with pop. 200,000+: Denver, CO (5.7 miles , pop. 554,636).
Nearest city with pop. 1,000,000+: Phoenix, AZ (577.4 miles , pop. 1,321,045).
Nearest cities:
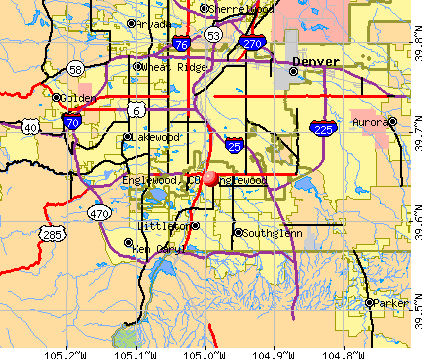
), ), Latitude: 39.65 N, Longitude: 104.99 W
Daytime population change due to commuting: +6,311 (+18.7%)
Workers who live and work in this city: 6,742 (32.9%)
Property values in Englewood, CO
Englewood tourist attractions:
- Art in the Suburbs of Denver
- Denver Area Hotel Featuring Numerous Amenities
- Family Golf Super Center - Englewood, CO - Great family entertainment or quick afternoon round of golf
- Gothic Theatre - Englewood, CO - Refurbished gothic venue for concerts and entertainment
- Fiddler's Green Amphitheatre - Englewood, CO - State of the art concert venue in Greenwood Village
Englewood, Colorado accommodation & food services, waste management - Economy and Business Data
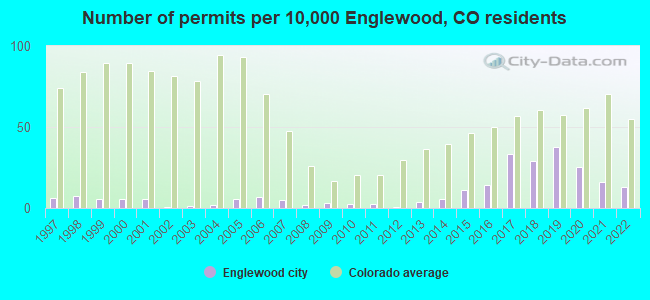
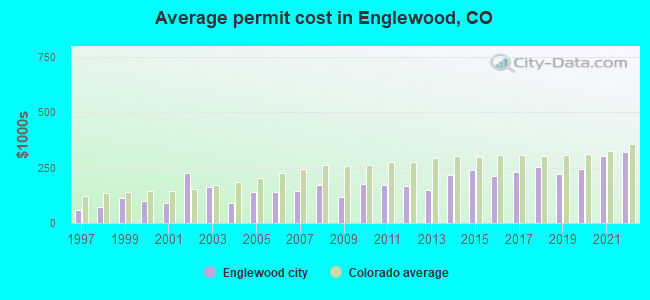
Single-family new house construction building permits:
- 2022: 41 buildings, average cost: $320,900
- 2021: 50 buildings, average cost: $301,300
- 2020: 81 buildings, average cost: $243,900
- 2019: 120 buildings, average cost: $219,900
- 2018: 92 buildings, average cost: $251,600
- 2017: 105 buildings, average cost: $229,800
- 2016: 45 buildings, average cost: $211,900
- 2015: 36 buildings, average cost: $240,200
- 2014: 17 buildings, average cost: $218,300
- 2013: 11 buildings, average cost: $150,300
- 2012: 2 buildings, average cost: $165,000
- 2011: 7 buildings, average cost: $171,400
- 2010: 7 buildings, average cost: $175,800
- 2009: 9 buildings, average cost: $116,700
- 2008: 6 buildings, average cost: $172,300
- 2007: 15 buildings, average cost: $146,000
- 2006: 22 buildings, average cost: $142,100
- 2005: 17 buildings, average cost: $140,900
- 2004: 6 buildings, average cost: $91,000
- 2003: 3 buildings, average cost: $163,900
- 2002: 2 buildings, average cost: $226,800
- 2001: 18 buildings, average cost: $89,400
- 2000: 17 buildings, average cost: $98,100
- 1999: 18 buildings, average cost: $115,400
- 1998: 24 buildings, average cost: $73,900
- 1997: 20 buildings, average cost: $56,800
| Here: | 3.2% |
| Colorado: | 3.2% |
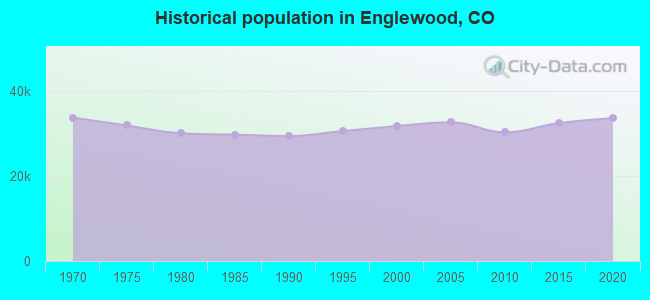
Population change in the 1990s: +1,645 (+5.5%).
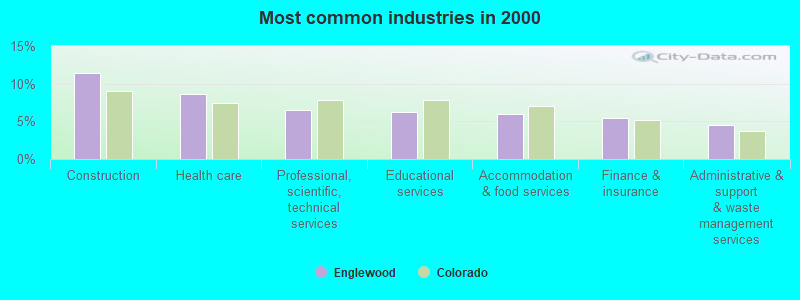
- Construction (11.4%)
- Health care (8.6%)
- Professional, scientific, technical services (6.5%)
- Educational services (6.3%)
- Accommodation & food services (5.9%)
- Finance & insurance (5.4%)
- Administrative & support & waste management services (4.5%)
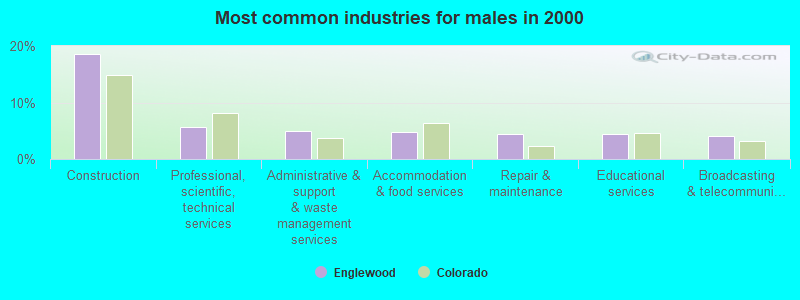
- Construction (18.6%)
- Professional, scientific, technical services (5.6%)
- Administrative & support & waste management services (5.0%)
- Accommodation & food services (4.8%)
- Repair & maintenance (4.4%)
- Educational services (4.3%)
- Broadcasting & telecommunications (4.0%)
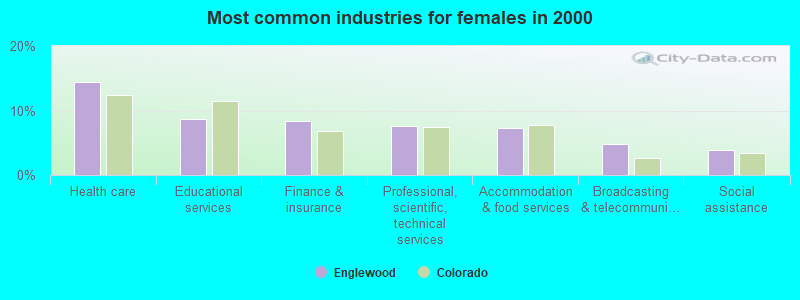
- Health care (14.5%)
- Educational services (8.7%)
- Finance & insurance (8.4%)
- Professional, scientific, technical services (7.7%)
- Accommodation & food services (7.3%)
- Broadcasting & telecommunications (4.7%)
- Social assistance (3.9%)
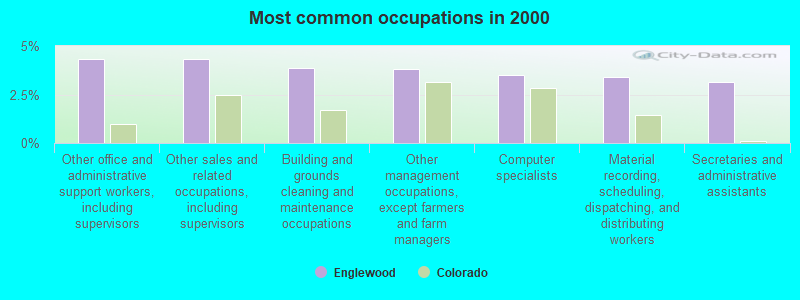
- Other office and administrative support workers, including supervisors (4.3%)
- Other sales and related occupations, including supervisors (4.3%)
- Building and grounds cleaning and maintenance occupations (3.8%)
- Other management occupations, except farmers and farm managers (3.8%)
- Computer specialists (3.5%)
- Material recording, scheduling, dispatching, and distributing workers (3.4%)
- Secretaries and administrative assistants (3.1%)
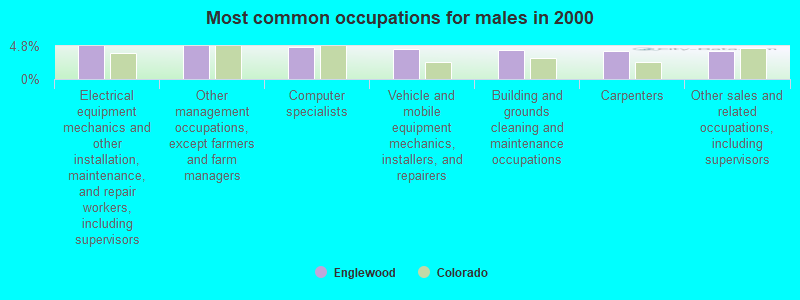
- Electrical equipment mechanics and other installation, maintenance, and repair workers, including supervisors (4.8%)
- Other management occupations, except farmers and farm managers (4.8%)
- Computer specialists (4.6%)
- Vehicle and mobile equipment mechanics, installers, and repairers (4.3%)
- Building and grounds cleaning and maintenance occupations (4.2%)
- Carpenters (4.1%)
- Other sales and related occupations, including supervisors (4.0%)
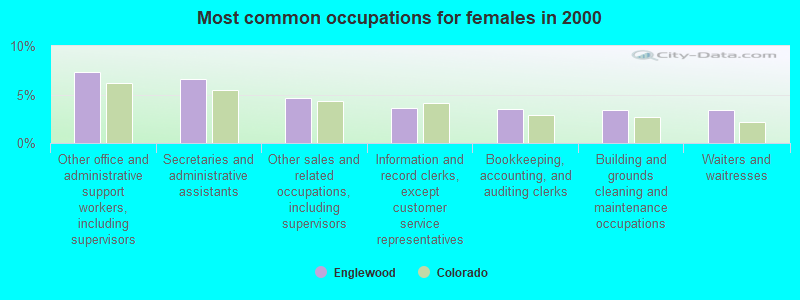
- Other office and administrative support workers, including supervisors (7.4%)
- Secretaries and administrative assistants (6.5%)
- Other sales and related occupations, including supervisors (4.7%)
- Information and record clerks, except customer service representatives (3.6%)
- Bookkeeping, accounting, and auditing clerks (3.5%)
- Building and grounds cleaning and maintenance occupations (3.4%)
- Waiters and waitresses (3.4%)
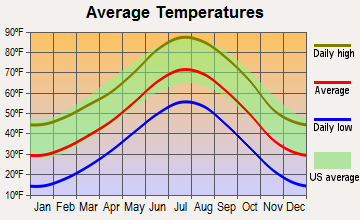
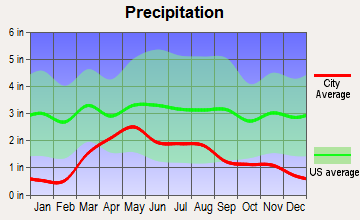
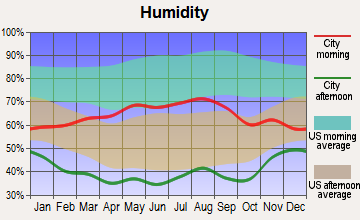
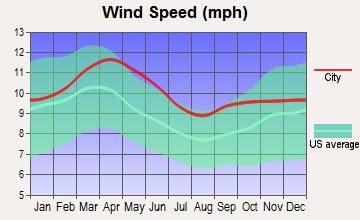
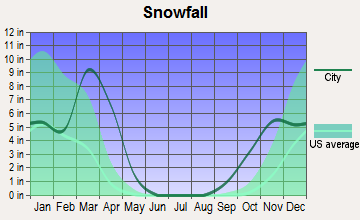
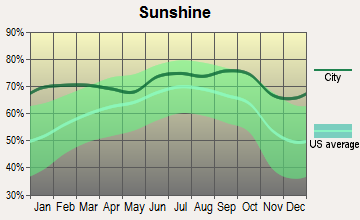
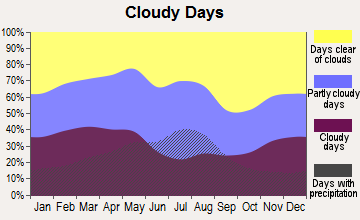
Average climate in Englewood, Colorado
Based on data reported by over 4,000 weather stations
|
|

(lower is better)
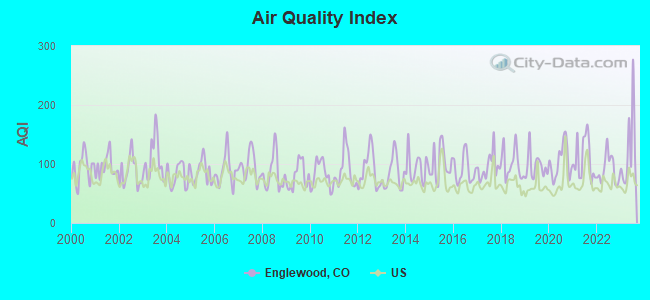
Air Quality Index (AQI) level in 2023 was 123. This is significantly worse than average.
| City: | 123 |
| U.S.: | 73 |
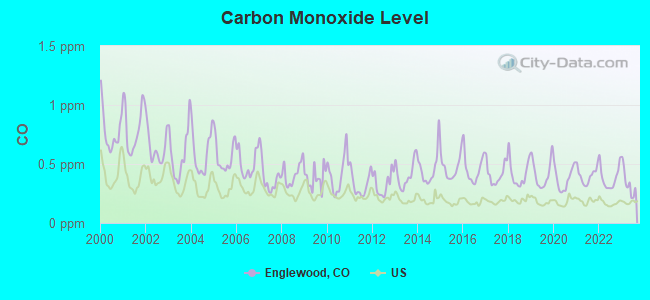
Carbon Monoxide (CO) [ppm] level in 2023 was 0.342. This is worse than average. Closest monitor was 0.4 miles away from the city center.
| City: | 0.342 |
| U.S.: | 0.251 |
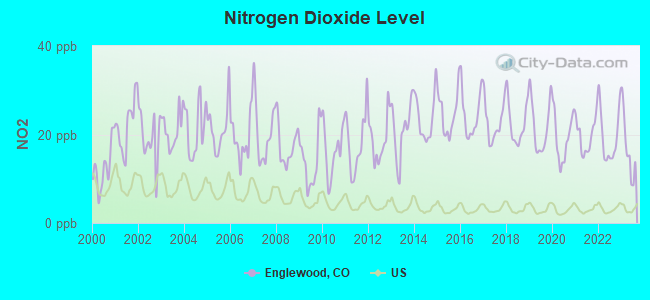
Nitrogen Dioxide (NO2) [ppb] level in 2023 was 17.0. This is significantly worse than average. Closest monitor was 6.0 miles away from the city center.
| City: | 17.0 |
| U.S.: | 5.1 |
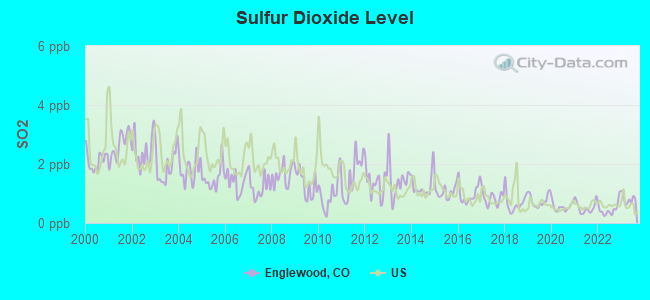
Sulfur Dioxide (SO2) [ppb] level in 2023 was 0.819. This is significantly better than average. Closest monitor was 2.3 miles away from the city center.
| City: | 0.819 |
| U.S.: | 1.515 |
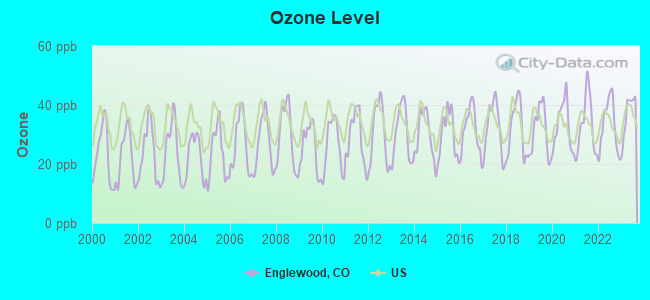
Ozone [ppb] level in 2023 was 36.9. This is about average. Closest monitor was 0.8 miles away from the city center.
| City: | 36.9 |
| U.S.: | 33.3 |
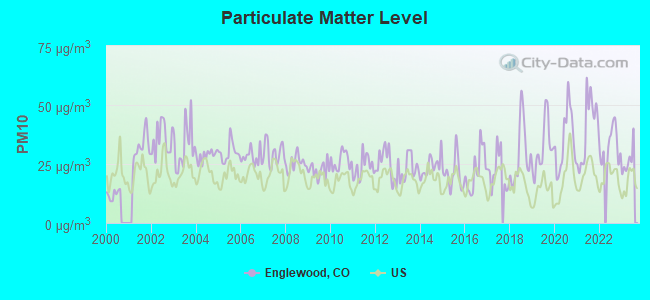
Particulate Matter (PM10) [µg/m3] level in 2023 was 26.4. This is worse than average. Closest monitor was 1.3 miles away from the city center.
| City: | 26.4 |
| U.S.: | 19.2 |
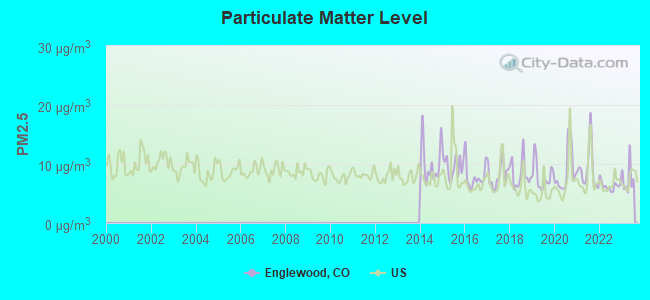
Particulate Matter (PM2.5) [µg/m3] level in 2023 was 7.54. This is about average. Closest monitor was 3.3 miles away from the city center.
| City: | 7.54 |
| U.S.: | 8.11 |
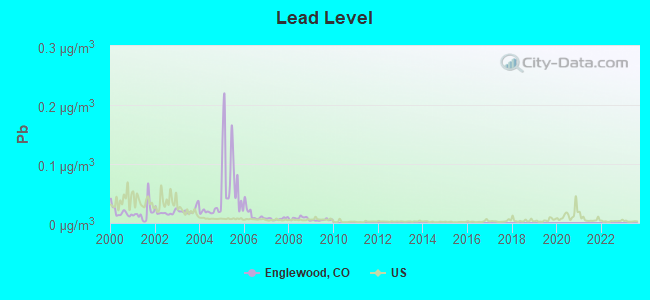
Lead (Pb) [µg/m3] level in 2009 was 0.00502. This is significantly better than average. Closest monitor was 1.3 miles away from the city center.
| City: | 0.00502 |
| U.S.: | 0.00931 |
Tornado activity:
Englewood-area historical tornado activity is above Colorado state average. It is 25% greater than the overall U.S. average.
On 6/15/1988, a category F3 (max. wind speeds 158-206 mph) tornado 6.6 miles away from the Englewood city center injured 7 people and caused between $5,000,000 and $50,000,000 in damages.
On 5/18/1975, a category F3 tornado 17.5 miles away from the city center .
Earthquake activity:
Englewood-area historical earthquake activity is significantly above Colorado state average. It is 717% greater than the overall U.S. average.On 8/18/1959 at 06:37:13, a magnitude 7.7 (7.7 UK, Class: Major, Intensity: VIII - XII) earthquake occurred 447.2 miles away from the city center, causing $26,000,000 total damage
On 10/18/1984 at 15:30:23, a magnitude 5.5 (5.4 MB, 5.1 MS, 5.5 ML, Class: Moderate, Intensity: VI - VII) earthquake occurred 192.4 miles away from the city center
On 8/23/2011 at 05:46:18, a magnitude 5.3 (5.3 MW, Depth: 2.5 mi) earthquake occurred 179.4 miles away from the city center
On 10/28/1983 at 14:06:06, a magnitude 7.3 (6.2 MB, 7.3 MS, 7.0 MW) earthquake occurred 547.1 miles away from the city center, causing 2 deaths (2 shaking deaths) and 3 injuries, causing $15,000,000 total damage
On 8/10/2005 at 22:08:22, a magnitude 5.0 (5.0 MW, Depth: 3.1 mi) earthquake occurred 186.9 miles away from Englewood center
On 8/10/2005 at 22:08:22, a magnitude 5.0 (5.0 MB, 4.7 MS, 5.0 MW) earthquake occurred 189.0 miles away from the city center
Magnitude types: body-wave magnitude (MB), local magnitude (ML), surface-wave magnitude (MS), moment magnitude (MW)
Natural disasters:
The number of natural disasters in Arapahoe County (10) is smaller than the US average (15).Major Disasters (Presidential) Declared: 5
Emergencies Declared: 4
Causes of natural disasters: Floods: 5, Storms: 4, Landslides: 2, Mudslides: 2, Snows: 2, Fire: 1, Heavy Rain: 1, Hurricane: 1, Snowstorm: 1, Tornado: 1, Other: 1 (Note: some incidents may be assigned to more than one category).
Main business address for: CSG SYSTEMS INTERNATIONAL INC (SERVICES-COMPUTER PROCESSING & DATA PREPARATION), SPORTS AUTHORITY INC /DE/ (RETAIL-MISCELLANEOUS SHOPPING GOODS STORES), FUND AMERICA INVESTORS CORP II (ASSET-BACKED SECURITIES), UNITED ARTISTS THEATRE CIRCUIT INC /MD/ (SERVICES-MOTION PICTURE THEATERS), LIBERTY MEDIA CORP /DE/ (CABLE & OTHER PAY TELEVISION SERVICES), NEXTMEDIA OPERATING INC (RADIO BROADCASTING STATIONS), AMERICAN CABLE TV INVESTORS 5 LTD (RADIO TELEPHONE COMMUNICATIONS), REGAL ENTERTAINMENT GROUP (SERVICES-MOTION PICTURE THEATERS) and 25 other public companies.
Hospitals and medical centers in Englewood:
- SWEDISH MEDICAL CENTER (Proprietary, 501 E HAMPDEN AVENUE)
- JULIA TEMPLE HEALTHCARE CENTER (3401 SOUTH LAFAYETTE STREET)
- KINDRED TRANSITIONAL CARE AND REHABILITATION-CHERRY (3575 SOUTH WASHINGTON STREET)
- PEARL STREET HEALTH AND REHABILITATION CENTER (3636 SOUTH PEARL STREET)
- ENGLEWOOD DIALYSIS (DVA) (3247 S LINCOLN ST)
- LONETREE DIALYSIS (DVA) (9777 PYRAMID CT STE 140)
- ALL STATE HOME HEALTH (3157 S BROADWAY)
- BEST CARE INC (888 WEST ITHACA AVE)
- HOME HEALTH CARE PROFESSIONALS INC (3680 SOUTH GALAPAGO STREET #102)
- INTERIM HEALTHCARE (333 W HAMPDEN AVENUE #705)
Heliports located in Englewood:
See details about Heliports located in Englewood, COAmtrak station near Englewood:
- 8 miles: DENVER (1701 WYNKOOP ST.) . Services: ticket office, fully wheelchair accessible, enclosed waiting area, public restrooms, public payphones, full-service food facilities and snack bar, paid short-term parking, paid long-term parking, call for car rental service, taxi stand, public transit connection.
Colleges/universities with over 2000 students nearest to Englewood:
- Arapahoe Community College (about 4 miles; Littleton, CO; Full-time enrollment: 6,619)
- University of Denver (about 4 miles; Denver, CO; FT enrollment: 9,621)
- Colorado State University-Global Campus (about 6 miles; Greenwood Village, CO; FT enrollment: 3,642)
- Emily Griffith Technical College (about 7 miles; Denver, CO; FT enrollment: 2,460)
- Community College of Denver (about 7 miles; Denver, CO; FT enrollment: 7,329)
- Metropolitan State University of Denver (about 7 miles; Denver, CO; FT enrollment: 17,242)
- University of Colorado Denver (about 7 miles; Denver, CO; FT enrollment: 14,727)
Public high schools in Englewood:
- ENGLEWOOD HIGH SCHOOL (Students: 818, Location: 3800 SOUTH LOGAN STREET, Grades: 9-12)
- COLORADO'S FINEST ALTERNATIVE HIGH SCHOOL (Students: 540, Location: 2323 WEST BAKER, Grades: 9-12)
- ENGLEWOOD LEADERSHIP ACADEMY (Students: 58, Location: 3800 S. LOGAN, Grades: 6-9)
- COLORADO CONNECTIONS ACADEMY (Location: 8 INVERNESS DRIVE E SUITE 240, Grades: KG-12)
Private high schools in Englewood:
- ST MARY'S ACADEMY (Students: 686, Location: 4545 S UNIVERSITY BLVD, Grades: KG-12)
- KENT DENVER SCHOOL (Students: 674, Location: 4000 E QUINCY AVE, Grades: 6-12)
- HUMANEX ACADEMY (Students: 48, Location: 2700 S ZUNI ST, Grades: 6-12)
- THE JOSHUA SCHOOL (Students: 34, Location: 2303 E DARTMOUTH AVE, Grades: PK-12)
Public elementary/middle schools in Englewood:
- COTTONWOOD CREEK ELEMENTARY SCHOOL (Students: 600, Location: 11200 EAST ORCHARD AVENUE, Grades: PK-5)
- ENGLEWOOD MIDDLE SCHOOL (Students: 520, Location: 300 WEST CHENANGO, Grades: 7-8)
- DRY CREEK ELEMENTARY SCHOOL (Students: 391, Location: 7686 EAST HINSDALE AVENUE, Grades: PK-5)
- CLAYTON ELEMENTARY SCHOOL (Students: 352, Location: 4600 SOUTH FOX STREET, Grades: KG-6)
- SHERIDAN ELEMENTARY (Students: 337, Location: 3700 SOUTH KNOX COURT, Grades: KG-2)
- CHERRELYN ELEMENTARY SCHOOL (Students: 259, Location: 4500 SOUTH LINCOLN STREET, Grades: KG-6)
- WM E BISHOP ELEMENTARY SCHOOL (Students: 233, Location: 3100 SOUTH ELATI STREET, Grades: KG-6)
- CHARLES HAY WORLD SCHOOL (Students: 209, Location: 3195 SOUTH LAFAYETTE STREET, Grades: KG-6)
- FORT LOGAN NORTHGATE (Location: 4107 SOUTH FEDERAL BOULEVARD, Grades: 3-8)
Private elementary/middle schools in Englewood:
Libraries in Englewood:
- ARAPAHOE LIBRARY DISTRICT (Operating income: $22,787,768; Location: 12855 E. ADAM AIRCRAFT CIRCLE; 449,239 books; 58,890 audio materials; 98,886 video materials; 26 other licensed databases; 810 print serial subscriptions)
- ENGLEWOOD PUBLIC LIBRARY (Operating income: $1,294,640; Location: 1000 ENGLEWOOD PARKWAY; 100,552 books; 5,585 audio materials; 3,787 video materials; 21 local licensed databases; 307 print serial subscriptions)
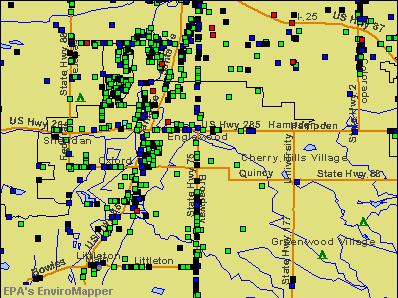
Points of interest:
Notable locations in Englewood: Littleton/Englewood Wastewater Treatment Plant (A), Englewood High School Stadium (B), Englewood Fire Department Jefferson Station (C), Englewood Municipal Court (D), Englewood City Hall (E), Englewood Police Department (F), Museum of Outdoor Arts (G), Swedish Medical Center Library (H), Englewood Public Library (I), The Gothic Theatre (J), Englewood Fire Department Tejon Station (K), Englewood Fire Department Acoma Station (L). Display/hide their locations on the map
Shopping Center: Brookridge Shopping Center (1). Display/hide its location on the map
Main business address in Englewood: SPORTS AUTHORITY INC /DE/ (A). Display/hide its location on the map
Churches in Englewood include: Seventh - Day Adventist Reformed Church (A), Saint Mark Coptic Orthodox Church (B), Saint Louis Catholic Church (C), Mayflower Congregational Church (D), Korean Emmanuel United Methodist Church (E), Immanuel Lutheran Church (F), First Baptist Church of Englewood (G), Englewood United Methodist Church (H), First Presbyterian Church of Englewood (I). Display/hide their locations on the map
Reservoir: Belisle Reservoir (A). Display/hide its location on the map
Creeks: Little Dry Creek (A), Big Dry Creek (B). Display/hide their locations on the map
Parks in Englewood include: Barde Park (1), Belleview Park (2), David W Brown House (3), Englewood Depot (4), Bates-Logan Park (5), Cushing Park (6), Elsie Duncan Park (7), Jason Park (8), Miller Field (9). Display/hide their locations on the map
Tourist attractions: C B Air (Museums; 7913 South Peoria), Smoky Hill Branch (Cultural Attractions- Events- & Facilities; 5430 South Biscay Circle), Museum of Outdoors Arts (Cultural Attractions- Events- & Facilities; 1000 Englewood Parkway), Family Sports Center - Family Sports Center Ice Arena (Amusement & Theme Parks; 6959 South Peoria Street), Amf Belleview Lanes (Amusement & Theme Parks; 4900 South Federal Boulevard), Amusement Emporium (Amusement & Theme Parks; 6880 South Emporia Street), Lane CO Consulting Inc (Amusement & Theme Parks; 8400 East Prentice Avenue), Monkey Bizness (Amusement & Theme Parks; 9950 East Easter Avenue), On-Site Sports (Amusement & Theme Parks; 8400 East Prentice Avenue).
Hotels: Guest Research Inc (8490 East Crescent Parkway Suite 365), Garden Terrace Restaurant (200 Inverness Drive West), A Helping Hand (4950 South Yosemite Street Suite F2), Candlewood Suites (6780 South Galena Street), Holiday Inn Denver South (7770 South Peoria Street), Four U Motel (3850 South Broadway), LA Quinta - Inns- Tech Center (7077 South Clinton Street), Inverness Hotel & Conference Center (200 Inverness Dr. West), Hampton Inn Denver-Southeast (9231 East Arapahoe Road).
Court: Englewood City - Municipal Court- Court Hearings Information (1000 Englewood Parkway).
Birthplace of: Rajeev Ram - Male tennis player, Abby Waner - Basketball player, Amy Van Dyken - Swimmer, Chris Narveson - 2005 Major League Baseball player (St. Louis Cardinals, born: Dec 20, 1981), Marshall Reed - Film actor, Sean Tufts - 2005 NFL player (Carolina Panthers, born: Mar 26, 1982), Tommie Hill - Football player, David Eugene Edwards - Alternative country singer, Geoff Paukovich - Ice hockey player, Logan Miller - Actor.
Drinking water stations with addresses in Englewood and their reported violations in the past:
ENGLEWOOD CITY OF (Population served: 46,541, Surface water):Past health violations:MERIDIAN MD (Population served: 15,500, Groundwater):Past monitoring violations:
- MCL, Monthly (TCR) - In JUN-2012, Contaminant: Coliform. Follow-up actions: St Public Notif requested (JUL-26-2012), St Violation/Reminder Notice (JUL-26-2012), St Public Notif received (AUG-30-2012)
- Follow-up Or Routine LCR Tap M/R - In OCT-01-2007, Contaminant: Lead and Copper Rule. Follow-up actions: St Public Notif requested (FEB-01-2008), St Violation/Reminder Notice (FEB-01-2008), St Public Notif received (JUN-09-2008), St Compliance achieved (JAN-28-2009)
- One minor monitoring violation
- One regular monitoring violation
Past monitoring violations:INVERNESS WSD (Population served: 13,000, Purch surface water):
- Monitoring and Reporting (DBP) - Between APR-2008 and JUN-2008, Contaminant: Chlorine. Follow-up actions: St Compliance achieved (SEP-03-2008)
- One regular monitoring violation
Past monitoring violations:COTTONWOOD WSD (Population served: 10,867, Groundwater):
- Monitoring, Repeat Major (TCR) - In JUN-2008, Contaminant: Coliform (TCR). Follow-up actions: St Public Notif requested (JUL-29-2008), St Violation/Reminder Notice (JUL-29-2008), St Compliance achieved (MAR-04-2009)
- Monitoring and Reporting (DBP) - Between JUL-2006 and SEP-2006, Contaminant: Chlorine. Follow-up actions: St Violation/Reminder Notice (DEC-18-2006), St Compliance achieved (JAN-30-2007)
- 2 routine major monitoring violations
- 41 regular monitoring violations
Past monitoring violations:CLEARWATER MD (Population served: 200, Groundwater):
- Monitoring and Reporting (DBP) - Between JAN-2013 and DEC-2013, Contaminant: Total Haloacetic Acids (HAA5). Follow-up actions: St Public Notif requested (NOV-13-2013), St Violation/Reminder Notice (NOV-13-2013), St Compliance achieved (NOV-27-2013)
- Monitoring and Reporting (DBP) - Between JAN-2013 and DEC-2013, Contaminant: TTHM. Follow-up actions: St Public Notif requested (NOV-13-2013), St Violation/Reminder Notice (NOV-13-2013), St Compliance achieved (NOV-27-2013)
- One minor monitoring violation
- 4 regular monitoring violations
Past monitoring violations:STANLEY HOUSE (Serves ND, Population served: 70, Purch surface water):
- Monitoring and Reporting (DBP) - Between OCT-2009 and DEC-2009, Contaminant: Chlorine. Follow-up actions: St Public Notif requested (FEB-10-2010), St Violation/Reminder Notice (FEB-10-2010), St Compliance achieved (MAR-18-2010)
- Follow-up Or Routine LCR Tap M/R - In OCT-01-2008, Contaminant: Lead and Copper Rule. Follow-up actions: St Compliance achieved (DEC-29-2008)
- Monitoring and Reporting (DBP) - Between JAN-2008 and MAR-2008, Contaminant: Chlorine. Follow-up actions: St Public Notif requested (MAY-09-2008), St Violation/Reminder Notice (MAY-09-2008), St Compliance achieved (SEP-03-2008)
- Monitoring and Reporting (DBP) - Between JUL-2006 and SEP-2006, Contaminant: Chlorine. Follow-up actions: St Violation/Reminder Notice (DEC-18-2006), St Compliance achieved (JAN-30-2007)
- 2 routine major monitoring violations
- 11 regular monitoring violations
Past monitoring violations:
- One routine major monitoring violation
Drinking water stations with addresses in Englewood that have no violations reported:
- CHERRY CREEK VILLAGE WD (Population served: 7,500, Primary Water Source Type: Purch surface water)
- JOINT WATER PURIFICATION PLANT (Population served: 0, Primary Water Source Type: Groundwater)
| This city: | 2.1 people |
| Colorado: | 2.5 people |
| This city: | 48.8% |
| Whole state: | 63.9% |
| This city: | 8.5% |
| Whole state: | 6.5% |
Likely homosexual households (counted as self-reported same-sex unmarried-partner households)
- Lesbian couples: 0.5% of all households
- Gay men: 0.4% of all households
People in group quarters in Englewood in 2010:
- 238 people in nursing facilities/skilled-nursing facilities
- 30 people in emergency and transitional shelters (with sleeping facilities) for people experiencing homelessness
- 18 people in workers' group living quarters and job corps centers
- 5 people in group homes intended for adults
People in group quarters in Englewood in 2000:
- 576 people in nursing homes
- 46 people in other noninstitutional group quarters
- 29 people in homes for the mentally ill
- 23 people in orthopedic wards and institutions for the physically handicapped
- 23 people in residential treatment centers for emotionally disturbed children
- 21 people in college dormitories (includes college quarters off campus)
- 10 people in homes or halfway houses for drug/alcohol abuse
Banks with most branches in Englewood (2011 data):
- Wells Fargo Bank, National Association: Bellview And Federal Branch, Tech Center Branch, Arapahoe And Quebec, Meridian Branch, Englewood Branch. Info updated 2011/04/05: Bank assets: $1,161,490.0 mil, Deposits: $905,653.0 mil, headquarters in Sioux Falls, SD, positive income, 6395 total offices, Holding Company: Wells Fargo & Company
- Bank of the West: Englewood - Broadway, Arapahoe Plaza, Greenwood Village, Englewood - Hampden Branch. Info updated 2009/11/16: Bank assets: $62,408.3 mil, Deposits: $43,995.2 mil, headquarters in San Francisco, CA, positive income, 647 total offices, Holding Company: Bnp Paribas
- JPMorgan Chase Bank, National Association: Englewood Branch, County Line Branch, Lincoln Blvd And Peoria Branch. Info updated 2011/11/10: Bank assets: $1,811,678.0 mil, Deposits: $1,190,738.0 mil, headquarters in Columbus, OH, positive income, International Specialization, 5577 total offices, Holding Company: Jpmorgan Chase & Co.
- U.S. Bank National Association: Arapahoe Road Branch, Southeast Branch, Englewood King Soopers Branch. Info updated 2012/01/30: Bank assets: $330,470.8 mil, Deposits: $236,091.5 mil, headquarters in Cincinnati, OH, positive income, 3121 total offices, Holding Company: U.S. Bancorp
- Guaranty Bank and Trust Company: Meridian Branch, Cherry Hills Branch, Denver Tech Center Branch. Info updated 2010/12/21: Bank assets: $1,687.8 mil, Deposits: $1,331.8 mil, headquarters in Denver, CO, positive income, Commercial Lending Specialization, 34 total offices, Holding Company: Guaranty Bancorp
- KeyBank National Association: 9250 East Arapahoe Road Branch at 9250 East Arapahoe Road, branch established on 1983/09/19; Tech Center Branch at 5950 South Willow Drive, branch established on 1980/11/17. Info updated 2008/03/03: Bank assets: $86,198.8 mil, Deposits: $64,214.8 mil, headquarters in Cleveland, OH, positive income, Commercial Lending Specialization, 1067 total offices, Holding Company: Keycorp
- Commerce Bank: Denver Tech Center Branch at 8450 East Crescent Parkway, Suite 150, branch established on 2012/02/01. Info updated 2011/07/07: Bank assets: $20,493.6 mil, Deposits: $16,805.3 mil, headquarters in Kansas City, MO, positive income, 206 total offices, Holding Company: Commerce Bancshares, Inc.
- State Bank of Downs: Berkley Bank at 7887 East Belleview Avenue, branch established on 2008/02/27. Info updated 2007/10/01: Bank assets: $58.3 mil, Deposits: $45.9 mil, headquarters in Downs, KS, positive income, Agricultural Specialization, 2 total offices, Holding Company: B Bank, Inc.
- Millennium Bank: Milllennium Bank Of South Denver at 209 West Hampden Avenue, branch established on 2006/07/18. Info updated 2006/11/03: Bank assets: $256.7 mil, Deposits: $228.6 mil, headquarters in Edwards, CO, negative income in the last year, Commercial Lending Specialization, 8 total offices, Holding Company: Millennium Bancorp, Inc.
- 13 other banks with 13 local branches
For population 15 years and over in Englewood:
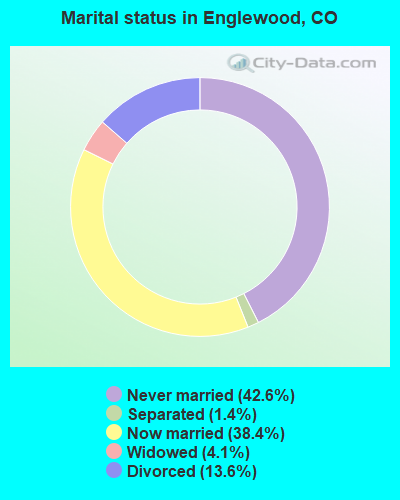
- Never married: 42.6%
- Now married: 38.4%
- Separated: 1.4%
- Widowed: 4.1%
- Divorced: 13.6%
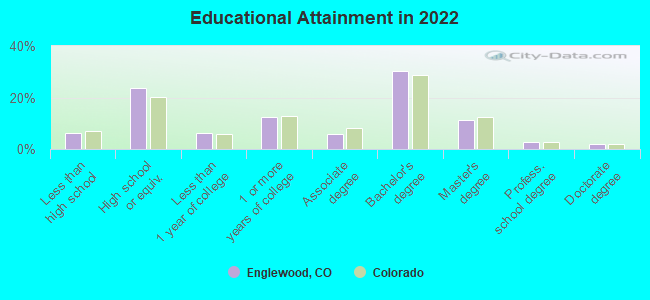
For population 25 years and over in Englewood:
- High school or higher: 93.3%
- Bachelor's degree or higher: 44.3%
- Graduate or professional degree: 15.0%
- Unemployed: 4.0%
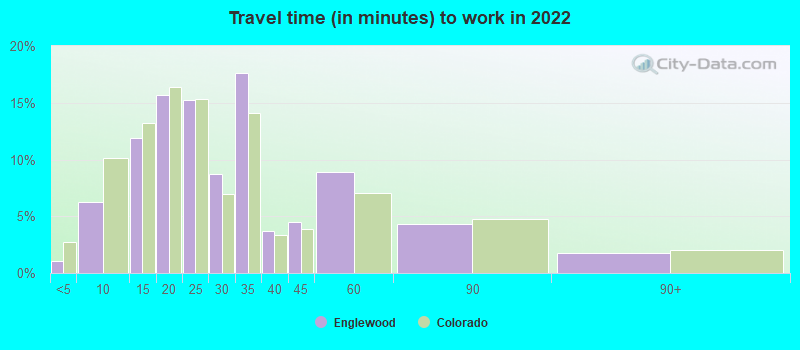
- Mean travel time to work (commute): 18.4 minutes

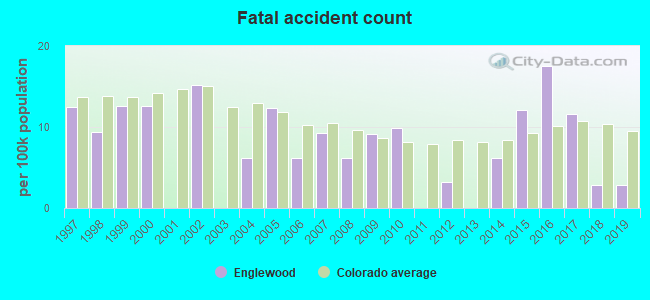
| Here: | 10.8 |
| Colorado average: | 11.1 |

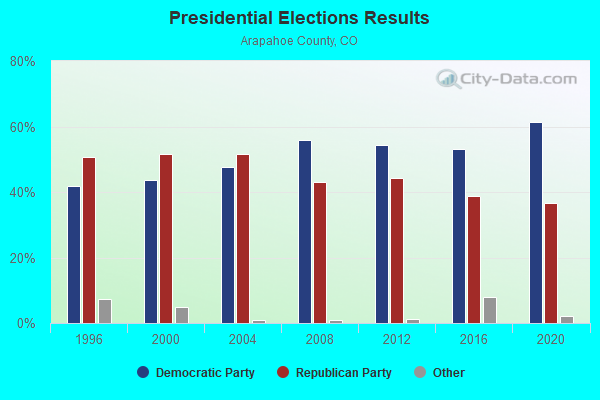
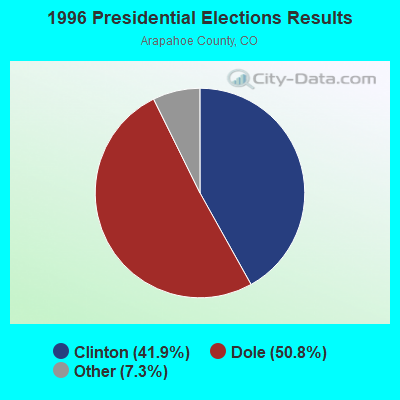
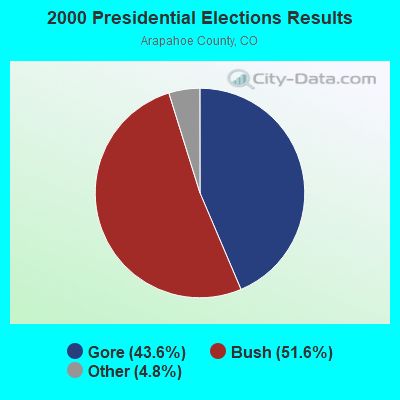
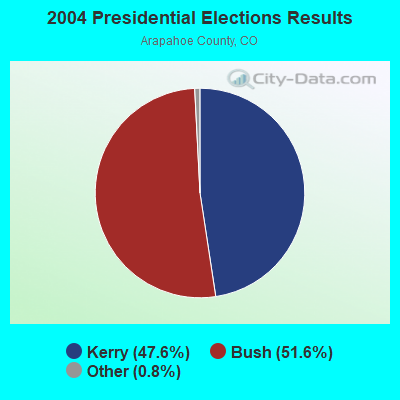
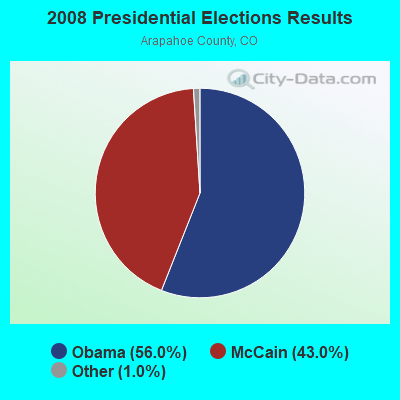

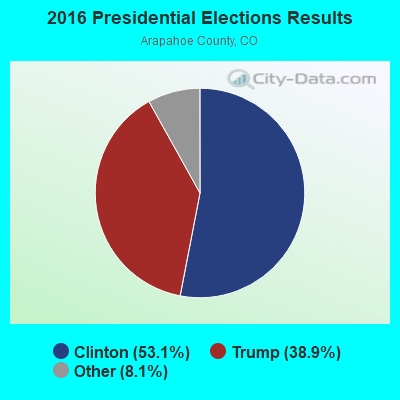
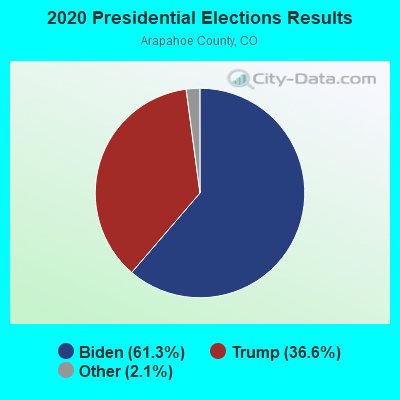
Graphs represent county-level data. Detailed 2008 Election Results
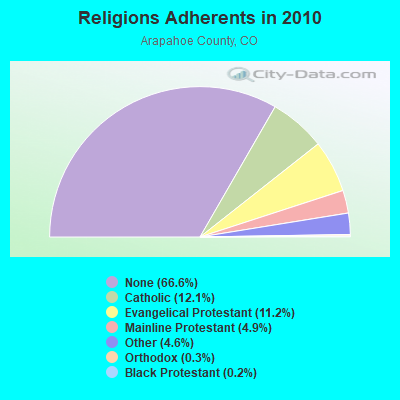
Religion statistics for Englewood, CO (based on Arapahoe County data)
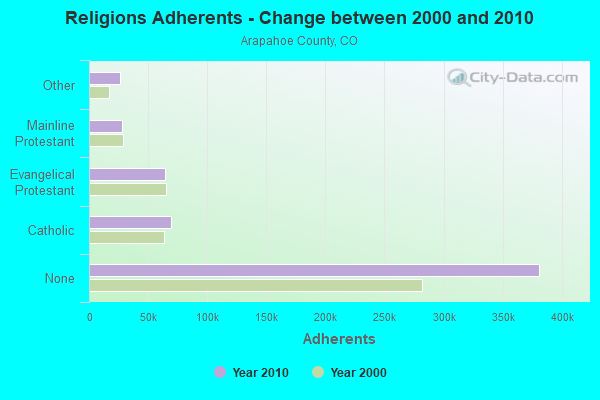
| Religion | Adherents | Congregations |
|---|---|---|
| Catholic | 69,031 | 13 |
| Evangelical Protestant | 64,204 | 178 |
| Mainline Protestant | 28,266 | 50 |
| Other | 26,495 | 53 |
| Orthodox | 1,780 | 4 |
| Black Protestant | 1,061 | 4 |
| None | 381,166 | - |
Food Environment Statistics:
| Arapahoe County: | 1.47 / 10,000 pop. |
| Colorado: | 1.50 / 10,000 pop. |
| Here: | 0.15 / 10,000 pop. |
| Colorado: | 0.15 / 10,000 pop. |
| Here: | 0.39 / 10,000 pop. |
| State: | 0.45 / 10,000 pop. |
| Arapahoe County: | 2.45 / 10,000 pop. |
| Colorado: | 3.13 / 10,000 pop. |
| Arapahoe County: | 6.94 / 10,000 pop. |
| State: | 8.99 / 10,000 pop. |
| Arapahoe County: | 6.0% |
| Colorado: | 5.3% |
| This county: | 19.5% |
| Colorado: | 18.4% |
| Arapahoe County: | 9.6% |
| State: | 9.6% |
Health and Nutrition:
| Englewood: | 50.0% |
| State: | 49.4% |
| This city: | 48.1% |
| Colorado: | 47.8% |
| Here: | 28.4 |
| Colorado: | 28.5 |
| Englewood: | 20.7% |
| Colorado: | 20.7% |
| Englewood: | 10.3% |
| State: | 9.7% |
| This city: | 6.8 |
| State: | 6.8 |
| Here: | 32.4% |
| Colorado: | 33.3% |
| Englewood: | 57.6% |
| Colorado: | 57.3% |
| This city: | 79.7% |
| Colorado: | 80.2% |
More about Health and Nutrition of Englewood, CO Residents
| Local government employment and payroll (March 2022) | |||||
| Function | Full-time employees | Monthly full-time payroll | Average yearly full-time wage | Part-time employees | Monthly part-time payroll |
|---|---|---|---|---|---|
| Police Protection - Officers | 74 | $671,391 | $108,874 | 0 | $0 |
| Sewerage | 74 | $514,883 | $83,495 | 0 | $0 |
| Water Supply | 58 | $322,404 | $66,704 | 0 | $0 |
| Parks and Recreation | 42 | $244,871 | $69,963 | 97 | $65,018 |
| Streets and Highways | 39 | $256,394 | $78,890 | 0 | $0 |
| Other and Unallocable | 34 | $203,258 | $71,738 | 2 | $5,480 |
| Financial Administration | 33 | $223,685 | $81,340 | 0 | $0 |
| Other Government Administration | 24 | $152,228 | $76,114 | 5 | $6,466 |
| Housing and Community Development (Local) | 18 | $123,646 | $82,431 | 0 | $0 |
| Judicial and Legal | 15 | $117,911 | $94,329 | 1 | $8,304 |
| Police - Other | 11 | $67,832 | $73,999 | 1 | $2,449 |
| Local Libraries | 8 | $23,111 | $34,667 | 19 | $27,878 |
| Fire - Other | 4 | $33,369 | $100,107 | 0 | $0 |
| Totals for Government | 434 | $2,954,984 | $81,705 | 125 | $115,595 |
Englewood government finances - Expenditure in 2021 (per resident):
- Current Operations - Sewerage: $19,083,000 ($567.24)
Police Protection: $14,453,000 ($429.61)
Water Utilities: $8,411,000 ($250.01)
Parks and Recreation: $7,682,000 ($228.35)
Local Fire Protection: $6,851,000 ($203.64)
General - Other: $6,471,000 ($192.35)
Regular Highways: $4,653,000 ($138.31)
Housing and Community Development: $3,621,000 ($107.63)
Central Staff Services: $3,104,000 ($92.27)
General Public Buildings: $2,689,000 ($79.93)
Financial Administration: $1,557,000 ($46.28)
Libraries: $1,204,000 ($35.79)
Judicial and Legal Services: $1,048,000 ($31.15)
- General - Interest on Debt: $792,000 ($23.54)
- Other Capital Outlay - General - Other: $418,000 ($12.42)
- Total Salaries and Wages: $33,865,000 ($1006.63)
- Water Utilities - Interest on Debt: $283,000 ($8.41)
Englewood government finances - Revenue in 2021 (per resident):
- Charges - Sewerage: $20,331,000 ($604.33)
Other: $3,455,000 ($102.70)
Parks and Recreation: $3,372,000 ($100.23)
Housing and Community Development: $46,000 ($1.37)
- Federal Intergovernmental - Other: $3,457,000 ($102.76)
Water Utilities: $202,000 ($6.00)
Highways: $179,000 ($5.32)
- Local Intergovernmental - Other: $995,000 ($29.58)
Highways: $199,000 ($5.92)
- Miscellaneous - General Revenue - Other: $2,537,000 ($75.41)
Interest Earnings: $1,742,000 ($51.78)
Fines and Forfeits: $883,000 ($26.25)
- Revenue - Water Utilities: $10,113,000 ($300.61)
- State Intergovernmental - Highways: $1,234,000 ($36.68)
Other: $448,000 ($13.32)
Water Utilities: $27,000 ($0.80)
- Tax - General Sales and Gross Receipts: $34,764,000 ($1033.35)
Property: $7,924,000 ($235.54)
Other Selective Sales: $3,621,000 ($107.63)
Other License: $1,649,000 ($49.02)
Public Utilities Sales: $1,193,000 ($35.46)
Englewood government finances - Debt in 2021 (per resident):
- Long Term Debt - Beginning Outstanding - Unspecified Public Purpose: $39,878,000 ($1185.36)
Outstanding Unspecified Public Purpose: $35,384,000 ($1051.78)
Retired Unspecified Public Purpose: $4,559,000 ($135.52)
Issue, Unspecified Public Purpose: $65,000 ($1.93)
Englewood government finances - Cash and Securities in 2021 (per resident):
- Other Funds - Cash and Securities: $95,029,000 ($2824.71)
- Sinking Funds - Cash and Securities: $216,000 ($6.42)
12.28% of this county's 2021 resident taxpayers lived in other counties in 2020 ($73,180 average adjusted gross income)
| Here: | 12.28% |
| Colorado average: | 11.28% |
0.04% of residents moved from foreign countries ($191 average AGI)
Arapahoe County: 0.04% Colorado average: 0.05%
Top counties from which taxpayers relocated into this county between 2020 and 2021:
| from Denver County, CO | |
| from Douglas County, CO | |
| from Adams County, CO |
12.70% of this county's 2020 resident taxpayers moved to other counties in 2021 ($75,361 average adjusted gross income)
| Here: | 12.70% |
| Colorado average: | 11.05% |
0.02% of residents moved to foreign countries ($156 average AGI)
Arapahoe County: 0.02% Colorado average: 0.03%
Top counties to which taxpayers relocated from this county between 2020 and 2021:
| to Denver County, CO | |
| to Douglas County, CO | |
| to Adams County, CO |
| Businesses in Englewood, CO | ||||
| Name | Count | Name | Count | |
|---|---|---|---|---|
| 24 Hour Fitness | 1 | Jimmy John's | 1 | |
| 7-Eleven | 6 | JoS. A. Bank | 1 | |
| AMF Bowling | 1 | Kmart | 1 | |
| AT&T | 2 | Kroger | 4 | |
| Ace Hardware | 1 | Lane Furniture | 1 | |
| Advance Auto Parts | 1 | Little Caesars Pizza | 1 | |
| Arby's | 2 | Marriott | 4 | |
| Bally Total Fitness | 1 | MasterBrand Cabinets | 10 | |
| Blockbuster | 1 | McDonald's | 5 | |
| Budget Car Rental | 1 | Motherhood Maternity | 1 | |
| Burger King | 4 | New Balance | 5 | |
| Caribou Coffee | 1 | Nike | 2 | |
| Chevrolet | 1 | Office Depot | 1 | |
| Chipotle | 1 | Panda Express | 1 | |
| Chuck E. Cheese's | 1 | Papa John's Pizza | 2 | |
| Circle K | 2 | Payless | 1 | |
| Cold Stone Creamery | 1 | Penske | 2 | |
| Comfort Suites | 1 | Pizza Hut | 1 | |
| Cricket Wireless | 2 | Qdoba Mexican Grill | 2 | |
| DHL | 2 | Quiznos | 2 | |
| Days Inn | 1 | Ramada | 1 | |
| Decora Cabinetry | 2 | Safeway | 3 | |
| Dennys | 1 | Sears | 1 | |
| Discount Tire | 1 | Starbucks | 6 | |
| Domino's Pizza | 1 | Subaru | 1 | |
| Extended Stay Deluxe | 1 | Subway | 6 | |
| FedEx | 20 | T-Mobile | 4 | |
| Firestone Complete Auto Care | 2 | Taco Bell | 2 | |
| GNC | 1 | Target | 1 | |
| GameStop | 1 | Toyota | 1 | |
| H&R Block | 1 | Toys"R"Us | 1 | |
| Hilton | 2 | U-Haul | 1 | |
| Hobby Lobby | 1 | UPS | 22 | |
| Holiday Inn | 2 | Vons | 3 | |
| Homestead Studio Suites | 1 | Walgreens | 3 | |
| Hyatt | 1 | Walmart | 1 | |
| IHOP | 1 | Wendy's | 1 | |
| Jamba Juice | 1 | |||
Strongest AM radio stations in Englewood:
- KADZ (1550 AM; 10 kW; ARVADA, CO; Owner: ABC, INC.)
- KDDZ (1690 AM; 10 kW; ARVADA, CO; Owner: ABC, INC.)
- KBNO (1280 AM; 5 kW; DENVER, CO; Owner: LATINO COMMUNICATIONS, LLC)
- KCUV (1510 AM; 25 kW; LITTLETON, CO; Owner: PEOPLE WIRELESS, INC.)
- KOA (850 AM; 50 kW; DENVER, CO; Owner: JACOR BROADCASTING OF COLORADO, INC.)
- KCKK (1600 AM; 5 kW; LAKEWOOD, CO; Owner: JEFFERSON-PILOT COMMUNICATIONS COMPANY OF COLORADO)
- KEZW (1430 AM; 10 kW; AURORA, CO; Owner: ENTERCOM DENVER LICENSE, LLC)
- KMXA (1090 AM; 50 kW; AURORA, CO; Owner: ENTRAVISION HOLDINGS, LLC)
- KNRC (1150 AM; 10 kW; ENGLEWOOD, CO; Owner: NRC BROADCASTING, INC.)
- KLTT (670 AM; 50 kW; COMMERCE CITY, CO; Owner: KLZ RADIO, INC.)
- KCFR (1340 AM; 1 kW; DENVER, CO; Owner: PUBLIC BROADCASTING OF COLORADO, INC.)
- KKZN (760 AM; 50 kW; THORNTON, CO; Owner: JACOR BROADCASTING OF COLORADO, INC.)
- KRKS (990 AM; 10 kW; DENVER, CO; Owner: SALEM MEDIA OF COLORADO, INC.)
Strongest FM radio stations in Englewood:
- KQMT (99.5 FM; DENVER, CO; Owner: ENTERCOM DENVER LICENSE, LLC)
- KQKS (107.5 FM; LAKEWOOD, CO; Owner: JEFFERSON-PILOT COMMUNICATIONS COMPANY OF COLORADO)
- KALC (105.9 FM; DENVER, CO; Owner: ENTERCOM DENVER LICENSE, LLC)
- KBPI (106.7 FM; DENVER, CO; Owner: JACOR BROADCASTING OF COLORADO, INC.)
- KXKL-FM (105.1 FM; DENVER, CO; Owner: INFINITY RADIO OPERATIONS INC.)
- KOSI (101.1 FM; DENVER, CO; Owner: ENTERCOM DENVER LICENSE, LLC)
- KFMD (95.7 FM; DENVER, CO; Owner: CITICASTERS LICENSES, L.P.)
- KRFX (103.5 FM; DENVER, CO; Owner: JACOR BROADCASTING OF COLORADO, INC.)
- KLDV (91.1 FM; MORRISON, CO; Owner: EDUCATIONAL MEDIA FOUNDATION)
- KIMN (100.3 FM; DENVER, CO; Owner: INFINITY RADIO OPERATIONS INC.)
- KVOD (90.1 FM; DENVER, CO; Owner: PUBLIC BROADCASTING OF COLORADO, INC)
- KUVO (89.3 FM; DENVER, CO; Owner: DENVER EDUCATIONAL BROADCASTING)
- KJMN (92.1 FM; CASTLE ROCK, CO; Owner: ENTRAVISION HOLDINGS, LLC)
- K209DE (89.7 FM; GOLDEN, CO; Owner: WAY-FM MEDIA GROUP, INC.)
- KYGO-FM (98.5 FM; DENVER, CO; Owner: JEFFERSON-PILOT COMMUNICATIONS COMPANY OF COLORADO)
- KXPK (96.5 FM; EVERGREEN, CO; Owner: ENTRAVISION HOLDINGS, LLC)
- KBCO-FM (97.3 FM; BOULDER, CO; Owner: CITICASTERS LICENSES, L.P.)
- KRKS-FM (94.7 FM; LAFAYETTE, CO; Owner: SALEM MEDIA OF COLORADO, INC)
- KJCD (104.3 FM; LONGMONT, CO; Owner: JEFFERSON-PILOT COMMUNICATIONS COMPANY OF COLORADO)
- KDJM (92.5 FM; BROOMFIELD, CO; Owner: INFINITY RADIO OPERATIONS INC.)
TV broadcast stations around Englewood:
- KMGH-TV (Channel 7; DENVER, CO; Owner: MCGRAW-HILL BROADCASTING COMPANY, INC.)
- KRMA-TV (Channel 6; DENVER, CO; Owner: ROCKY MOUNTAIN PUBLIC BROADCASTING NETWORK, INC.)
- K48FW (Channel 48; DENVER, CO; Owner: TRINITY BROADCASTING NETWORK)
- KDEO-LP (Channel 38; AURORA, CO; Owner: PETER B. VAN DE SANDE)
- KUSA-TV (Channel 9; DENVER, CO; Owner: MULTIMEDIA HOLDINGS CORPORATION)
- KDEV-LP (Channel 62; AURORA, CO; Owner: TIGER EYE BROADCASTING CORPORATION)
- KTVD (Channel 20; DENVER, CO; Owner: TWENVER BROADCAST, INC.)
- KCNC-TV (Channel 4; DENVER, CO; Owner: CBS TELEVISION STATIONS INC.)
- KWGN-TV (Channel 2; DENVER, CO; Owner: KWGN INC.)
- KMAS-LP (Channel 63; DENVER, CO; Owner: TELEMUNDO OF STEAMBOAT SPRINGS COLO. LIC. CORP.)
- KPXC-TV (Channel 59; DENVER, CO; Owner: PAXSON DENVER LICENSE, INC.)
- KDVR (Channel 31; DENVER, CO; Owner: FOX TELEVISION STATIONS, INC.)
- KDEN (Channel 25; LONGMONT, CO; Owner: LONGMONT CHANNEL 25, INC.)
- KRMT (Channel 41; DENVER, CO; Owner: WORD OF GOD FELLOWSHIP, INC.)
- KWHD (Channel 53; CASTLE ROCK, CO; Owner: LESEA BROADCASTING CORPORATION)
- KDVT-LP (Channel 36; DENVER, CO; Owner: ENTRAVISION HOLDINGS, LLC)
- K66FB (Channel 66; DENVER, CO; Owner: TRINITY BROADCASTING NETWORK)
- KCEC (Channel 50; DENVER, CO; Owner: ENTRAVISION HOLDINGS, LLC)
- National Bridge Inventory (NBI) Statistics
- 18Number of bridges
- 141ft / 42.6mTotal length
- $3,250,000Total costs
- 431,264Total average daily traffic
- 23,637Total average daily truck traffic
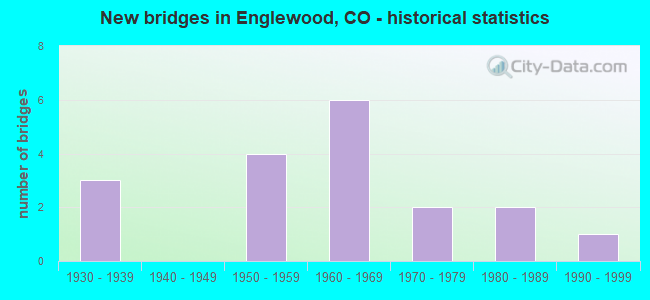
- New bridges - historical statistics
- 31930-1939
- 41950-1959
- 61960-1969
- 21970-1979
- 21980-1989
- 11990-1999
FCC Registered Commercial Land Mobile Towers: 1 (See the full list of FCC Registered Commercial Land Mobile Towers in Englewood, CO)
FCC Registered Private Land Mobile Towers: 5 (See the full list of FCC Registered Private Land Mobile Towers)
FCC Registered Broadcast Land Mobile Towers: 71 (See the full list of FCC Registered Broadcast Land Mobile Towers)
FCC Registered Microwave Towers: 192 (See the full list of FCC Registered Microwave Towers in this town)
FCC Registered Paging Towers: 21 (See the full list of FCC Registered Paging Towers)
FCC Registered Maritime Coast & Aviation Ground Towers: 18 (See the full list of FCC Registered Maritime Coast & Aviation Ground Towers)
FCC Registered Amateur Radio Licenses: 399 (See the full list of FCC Registered Amateur Radio Licenses in Englewood)
FAA Registered Aircraft Manufacturers and Dealers: 29 (See the full list of FAA Registered Manufacturers and Dealers in Englewood)
FAA Registered Aircraft: 263 (See the full list of FAA Registered Aircraft)
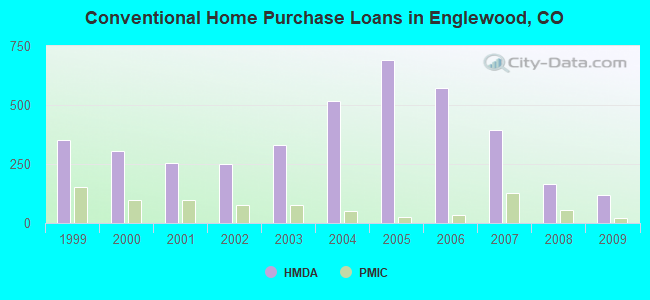
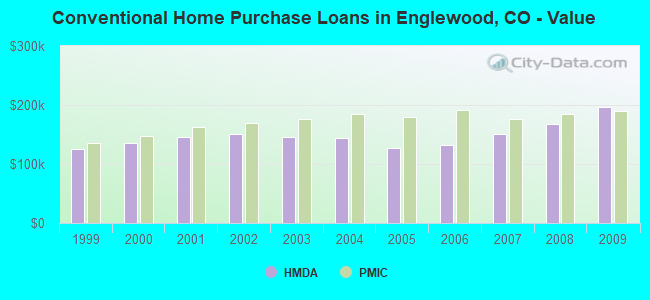
| Home Mortgage Disclosure Act Aggregated Statistics For Year 2009 (Based on 5 full and 7 partial tracts) | ||||||||||||||
| A) FHA, FSA/RHS & VA Home Purchase Loans | B) Conventional Home Purchase Loans | C) Refinancings | D) Home Improvement Loans | E) Loans on Dwellings For 5+ Families | F) Non-occupant Loans on < 5 Family Dwellings (A B C & D) | G) Loans On Manufactured Home Dwelling (A B C & D) | ||||||||
|---|---|---|---|---|---|---|---|---|---|---|---|---|---|---|
| Number | Average Value | Number | Average Value | Number | Average Value | Number | Average Value | Number | Average Value | Number | Average Value | Number | Average Value | |
| LOANS ORIGINATED | 197 | $191,227 | 117 | $195,858 | 571 | $182,148 | 17 | $47,855 | 1 | $3,341,360 | 47 | $169,700 | 1 | $64,930 |
| APPLICATIONS APPROVED, NOT ACCEPTED | 8 | $182,866 | 8 | $202,606 | 54 | $176,845 | 6 | $19,413 | 0 | $0 | 4 | $154,530 | 0 | $0 |
| APPLICATIONS DENIED | 16 | $150,967 | 18 | $160,700 | 183 | $181,677 | 24 | $39,979 | 1 | $176,220 | 21 | $165,011 | 1 | $38,160 |
| APPLICATIONS WITHDRAWN | 13 | $181,363 | 8 | $191,810 | 102 | $181,610 | 6 | $35,610 | 1 | $825,000 | 10 | $118,855 | 0 | $0 |
| FILES CLOSED FOR INCOMPLETENESS | 2 | $133,040 | 2 | $142,690 | 26 | $160,948 | 3 | $53,203 | 0 | $0 | 3 | $111,627 | 0 | $0 |
Detailed mortgage data for all 12 tracts in Englewood, CO
| Private Mortgage Insurance Companies Aggregated Statistics For Year 2009 (Based on 5 full and 7 partial tracts) | ||||||
| A) Conventional Home Purchase Loans | B) Refinancings | C) Non-occupant Loans on < 5 Family Dwellings (A & B) | ||||
|---|---|---|---|---|---|---|
| Number | Average Value | Number | Average Value | Number | Average Value | |
| LOANS ORIGINATED | 20 | $189,074 | 24 | $204,121 | 0 | $0 |
| APPLICATIONS APPROVED, NOT ACCEPTED | 6 | $164,537 | 5 | $197,998 | 1 | $149,100 |
| APPLICATIONS DENIED | 4 | $138,075 | 5 | $186,098 | 0 | $0 |
| APPLICATIONS WITHDRAWN | 1 | $183,830 | 1 | $138,000 | 0 | $0 |
| FILES CLOSED FOR INCOMPLETENESS | 1 | $166,140 | 1 | $184,000 | 0 | $0 |
2002 - 2018 National Fire Incident Reporting System (NFIRS) incidents
- Fire incident types reported to NFIRS in Englewood, CO
- 90738.0%Structure Fires
- 89337.4%Outside Fires
- 46819.6%Mobile Property/Vehicle Fires
- 1184.9%Other
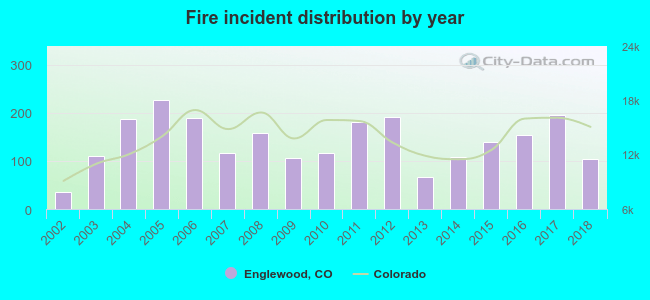 According to the data from the years 2002 - 2018 the average number of fires per year is 140. The highest number of reported fire incidents - 226 took place in 2005, and the least - 35 in 2002. The data has a growing trend.
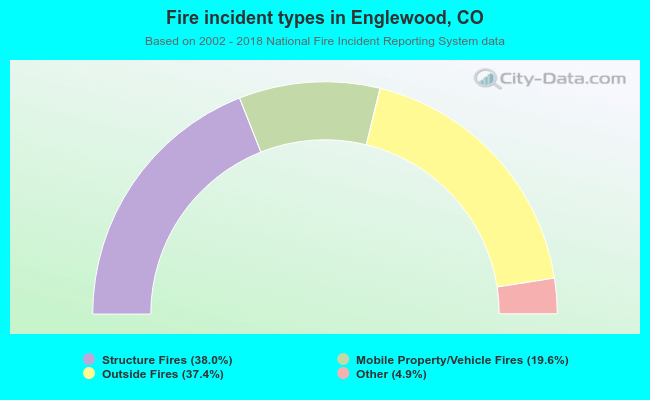 When looking into fire subcategories, the most incidents belonged to: Structure Fires (38.0%), and Outside Fires (37.4%).
Fire-safe hotels and motels in Englewood, Colorado:
- Hampton Inn, 9231 E Arapahoe Rd, Englewood, Colorado 80112 , Phone: (303) 792-9999, Fax: (303) 790-4360
- Sheraton Denver Tech Center Hotel, 7007 S Clinton St, Englewood, Colorado 80112 , Phone: (303) 799-6200, Fax: (303) 799-4828
- Courtyard By Marriott Denver Tech Center, 6565 S Boston St, Englewood, Colorado 80111 , Phone: (303) 721-0300, Fax: (303) 721-0037
- Residence Inn - Denver Tech Center, 6565 S Yosemite St, Englewood, Colorado 80111 , Phone: (303) 740-7177, Fax: (303) 741-9426
- Clarion Hotel-Denver South, 7770 S Peoria St, Englewood, Colorado 80112 , Phone: (303) 790-7770, Fax: (303) 799-6319
- Embassy Suites Denver Tech Center, 10250 E Costilla Ave, Englewood, Colorado 80112 , Phone: (303) 792-0433, Fax: (303) 792-0432
- Sleep Inn, 9257 E Costilla Ave, Englewood, Colorado 80112 , Phone: (303) 662-9950, Fax: (303) 662-9951
- Extended Stay America - Denver - Tech Center South - Inverness, 9650 E Geddes Ave, Englewood, Colorado 80112 , Phone: (303) 708-8888, Fax: (303) 708-1620
- 16 other hotels and motels
| Most common first names in Englewood, CO among deceased individuals | ||
| Name | Count | Lived (average) |
|---|---|---|
| William | 327 | 73.3 years |
| Mary | 324 | 80.3 years |
| John | 320 | 74.8 years |
| Robert | 273 | 70.4 years |
| James | 223 | 71.0 years |
| George | 193 | 77.5 years |
| Charles | 189 | 75.6 years |
| Margaret | 167 | 80.9 years |
| Dorothy | 165 | 79.0 years |
| Helen | 163 | 81.1 years |
| Most common last names in Englewood, CO among deceased individuals | ||
| Last name | Count | Lived (average) |
|---|---|---|
| Smith | 150 | 76.0 years |
| Miller | 103 | 78.3 years |
| Johnson | 100 | 77.9 years |
| Brown | 84 | 77.4 years |
| Jones | 77 | 74.0 years |
| Anderson | 71 | 76.8 years |
| Davis | 70 | 76.8 years |
| Williams | 58 | 80.2 years |
| Moore | 53 | 71.2 years |
| Martin | 51 | 78.4 years |
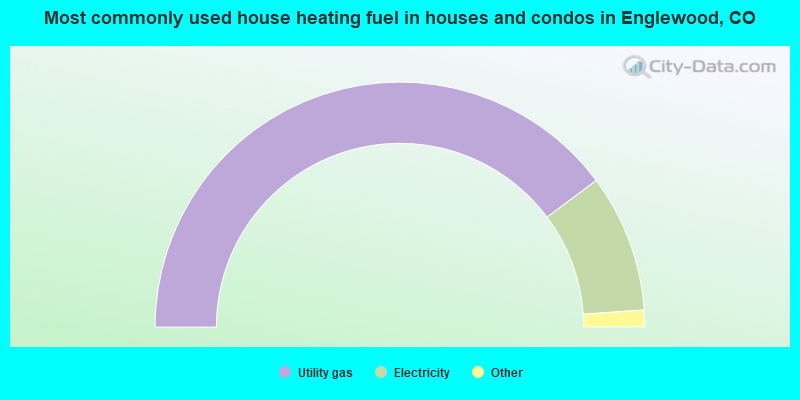
- 79.6%Utility gas
- 18.2%Electricity
- 0.8%Bottled, tank, or LP gas
- 0.7%Wood
- 0.4%Solar energy
- 0.2%No fuel used
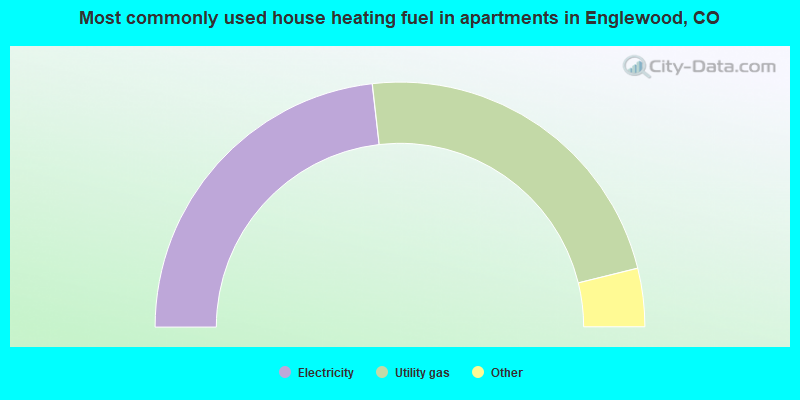
- 46.4%Electricity
- 45.9%Utility gas
- 4.0%Other fuel
- 1.7%No fuel used
- 1.6%Bottled, tank, or LP gas
- 0.3%Fuel oil, kerosene, etc.
- 0.2%Solar energy
Englewood compared to Colorado state average:
- Unemployed percentage significantly below state average.
- Length of stay since moving in significantly above state average.
- Number of rooms per house below state average.
- House age above state average.
Englewood on our top lists:
- #61 on the list of "Top 101 cities with the most local government spending on current operations of parks and recreation per resident (population 10,000+)"
- #11 on the list of "Top 101 counties with the largest increase in the number of infant deaths per 1000 residents 2000-2006 to 2007-2013 (pop. 50,000+)"
- #19 on the list of "Top 101 counties with the highest Ozone (1-hour) air pollution readings in 2012 (ppm)"
- #40 on the list of "Top 101 counties with the highest percentage of residents that exercised in the past month"
- #46 on the list of "Top 101 counties with the highest percentage of residents relocating from other counties between 2010 and 2011 (pop. 50,000+)"
- #47 on the list of "Top 101 counties with the best general health status score of residents (1-5), 3 years of data"

|
|
Total of 1275 patent applications in 2008-2024.