Estimated zip code population in 2022: 35,417 Zip code population in 2010: 20,254 Zip code population in 2000: 8,449
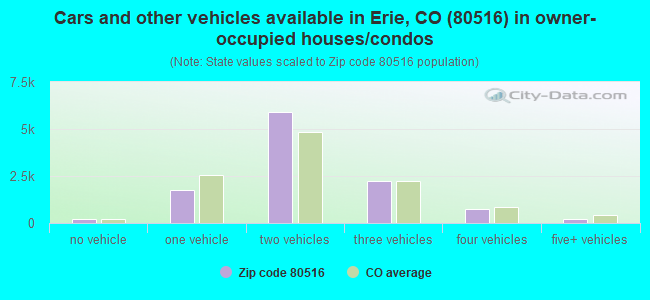
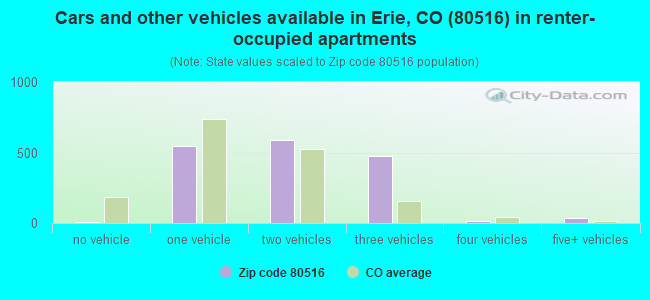
Houses and condos: 12,878 Renter-occupied apartments: 1,645
% of renters here:
13%
State:
34%
March 2022 cost of living index in zip code 80516: 105.2 (more than average, U.S. average is 100)
Land area: 39.9 sq. mi. Water area: 0.2 sq. mi.
Population density: 887 people per square mile
(low).
OSM Map
General Map
Google Map
MSN Map
OSM Map
General Map
Google Map
MSN Map
OSM Map
General Map
Google Map
MSN Map
OSM Map
General Map
Google Map
MSN Map
Please wait while loading the map...
Real estate property taxes paid for housing units in 2022:
This zip code:
0.7% ($5,067)
Colorado:
0.5% ($2,422)
Median real estate property taxes paid for housing units with mortgages in 2022: $5,250 (0.7%) Median real estate property taxes paid for housing units with no mortgage in 2022: $4,083 (0.6%)
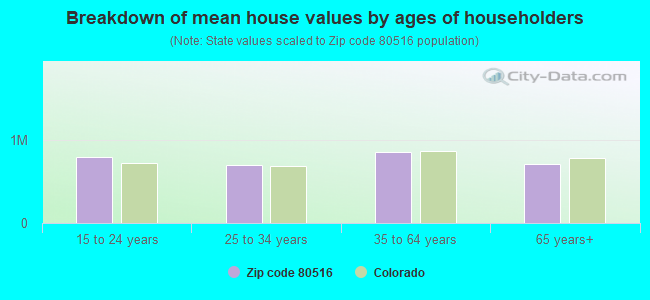
Estimated median house/condo value in 2022: $735,378
80516:
$735,378
Colorado:
$531,100
According to our research of Colorado and other state lists, there were 26 registered sex offenders living in 80516 zip code as of April 28, 2024. The ratio of all residents to sex offenders in zip code 80516 is 916 to 1. The ratio of registered sex offenders to all residents in this zip code is lower than the state average.
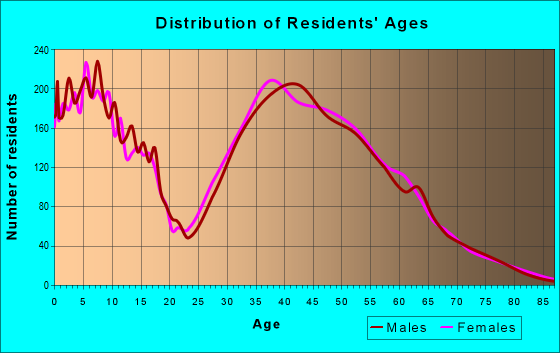
Median resident age:
This zip code:
38.1 years
Colorado median age:
37.7 years
Average household size:
This zip code:
2.8 people
Colorado:
2.4 people
Averages for the 2020 tax year for zip code 80516, filed in 2021:
Average Adjusted Gross Income (AGI) in 2020: $130,427 (Individual Income Tax Returns)
Here:
$130,427
State:
$89,260
Salary/wage: $111,082 (reported on 85.5% of returns)
Here:
$111,082
State:
$70,330
(% of AGI for various income ranges: 1133.8% for AGIs below $25k, 3563.2% for AGIs $25k-50k, 6410.5% for AGIs $50k-75k, 10121.3% for AGIs $75k-100k, 20320.3% for AGIs $100k-200k, 68008.4% for AGIs over 200k)
Taxable interest for individuals: $1,264 (reported on 43.2% of returns)
This zip code:
$1,264
Colorado:
$2,176
(% of AGI for various income ranges: 22.7% for AGIs below $25k, 31.8% for AGIs $25k-50k, 42.8% for AGIs $50k-75k, 62.6% for AGIs $75k-100k, 87.5% for AGIs $100k-200k, 407.5% for AGIs over 200k)
Ordinary dividends: $4,560 (reported on 35.2% of returns)
Here:
$4,560
State:
$8,820
(% of AGI for various income ranges: 45.6% for AGIs below $25k, 85.5% for AGIs $25k-50k, 171.7% for AGIs $50k-75k, 172.3% for AGIs $75k-100k, 278.4% for AGIs $100k-200k, 1159.1% for AGIs over 200k)
Net capital gain/loss in AGI: +$20,909 (reported on 33.4% of returns)
Here:
+$20,909
State:
+$37,276
(% of AGI for various income ranges: 30.7% for AGIs below $25k, 52.3% for AGIs $25k-50k, 166.5% for AGIs $50k-75k, 248.4% for AGIs $75k-100k, 508.1% for AGIs $100k-200k, 8792.7% for AGIs over 200k)
Profit/loss from business: +$15,942 (reported on 20.5% of returns)
Here:
+$15,942
State:
+$15,295
(% of AGI for various income ranges: 118.1% for AGIs below $25k, 266.4% for AGIs $25k-50k, 370.3% for AGIs $50k-75k, 453.6% for AGIs $75k-100k, 669.7% for AGIs $100k-200k, 1791.1% for AGIs over 200k)
Taxable individual retirement arrangement distribution: $26,256 (reported on 10.1% of returns)
80516:
$26,256
Colorado:
$23,785
(% of AGI for various income ranges: 67.6% for AGIs below $25k, 204.2% for AGIs $25k-50k, 310.0% for AGIs $50k-75k, 396.5% for AGIs $75k-100k, 658.3% for AGIs $100k-200k, 1202.4% for AGIs over 200k)
Self-employed (Keogh) retirement plans: $16,076 (reported on 1.1% of returns)
80516:
$16,076
Colorado:
$23,633
(% of AGI for various income ranges: 18.1% for AGIs $25k-50k, 25.1% for AGIs $100k-200k, 166.9% for AGIs over 200k)
Total itemized deductions: $31,418 (reported on 24.8% of returns)
Here:
$31,418
State:
$35,141
(% of AGI for various income ranges: 117.6% for AGIs below $25k, 297.1% for AGIs $25k-50k, 633.5% for AGIs $50k-75k, 1057.5% for AGIs $75k-100k, 1671.9% for AGIs $100k-200k, 5172.3% for AGIs over 200k)
Charity contributions: $7,079 (reported on 19.3% of returns)
Here:
$7,079
State:
$12,103
(% of AGI for various income ranges: 6.9% for AGIs below $25k, 21.3% for AGIs $25k-50k, 68.0% for AGIs $50k-75k, 102.4% for AGIs $75k-100k, 228.5% for AGIs $100k-200k, 1272.5% for AGIs over 200k)
Taxes paid: $8,858 (reported on 24.7% of returns)
80516:
$8,858
State:
$7,710
(% of AGI for various income ranges: 20.0% for AGIs below $25k, 60.7% for AGIs $25k-50k, 162.3% for AGIs $50k-75k, 313.3% for AGIs $75k-100k, 522.1% for AGIs $100k-200k, 1373.2% for AGIs over 200k)
Earned income credit: $1,750 (reported on 4.7% of returns)
Here:
$1,750
State:
$2,053
(% of AGI for various income ranges: 39.2% for AGIs below $25k, 31.9% for AGIs $25k-50k)
Percentage of individuals using paid preparers for their 2020 taxes: 93.5%
Here:
94%
State:
93%
(% for various income ranges: 90.3% for AGIs below $25k, 93.5% for AGIs $25k-50k, 93.6% for AGIs $50k-75k, 94.2% for AGIs $75k-100k, 94.2% for AGIs $100k-200k, 95.5% for AGIs over 200k)
Averages for the 2012 tax year for zip code 80516, filed in 2013:
Average Adjusted Gross Income (AGI) in 2012: $94,317 (Individual Income Tax Returns)
Here:
$94,317
State:
$69,103
Salary/wage: $83,121 (reported on 87.9% of returns)
Here:
$83,121
State:
$54,794
(% of AGI for various income ranges: 74.4% for AGIs below $25k, 77.5% for AGIs $25k-50k, 79.5% for AGIs $50k-75k, 80.9% for AGIs $75k-100k, 84.8% for AGIs $100k-200k, 65.4% for AGIs over 200k)
Taxable interest for individuals: $1,058 (reported on 45.1% of returns)
This zip code:
$1,058
Colorado:
$1,971
(% of AGI for various income ranges: 1.8% for AGIs below $25k, 0.9% for AGIs $25k-50k, 0.5% for AGIs $50k-75k, 0.5% for AGIs $75k-100k, 0.3% for AGIs $100k-200k, 0.6% for AGIs over 200k)
Ordinary dividends: $3,263 (reported on 31.9% of returns)
Here:
$3,263
State:
$7,140
(% of AGI for various income ranges: 2.8% for AGIs below $25k, 1.5% for AGIs $25k-50k, 1.0% for AGIs $50k-75k, 1.0% for AGIs $75k-100k, 0.8% for AGIs $100k-200k, 1.3% for AGIs over 200k)
Net capital gain/loss in AGI: +$14,199 (reported on 28.8% of returns)
Here:
+$14,199
State:
+$23,009
(% of AGI for various income ranges: 0.6% for AGIs below $25k, 0.6% for AGIs $25k-50k, 0.6% for AGIs $50k-75k, 1.0% for AGIs $75k-100k, 1.2% for AGIs $100k-200k, 12.4% for AGIs over 200k)
Profit/loss from business: +$13,669 (reported on 20.6% of returns)
Here:
+$13,669
State:
+$13,514
(% of AGI for various income ranges: 9.2% for AGIs below $25k, 5.4% for AGIs $25k-50k, 3.5% for AGIs $50k-75k, 2.7% for AGIs $75k-100k, 2.5% for AGIs $100k-200k, 2.6% for AGIs over 200k)
Taxable individual retirement arrangement distribution: $18,362 (reported on 11.0% of returns)
80516:
$18,362
Colorado:
$17,927
(% of AGI for various income ranges: 3.8% for AGIs below $25k, 2.8% for AGIs $25k-50k, 2.6% for AGIs $50k-75k, 2.6% for AGIs $75k-100k, 2.2% for AGIs $100k-200k, 1.4% for AGIs over 200k)
Self-employment retirement plans: $17,108 (reported on 1.2% of returns)
80516:
$17,108
Colorado:
$19,483
(% of AGI for various income ranges: 0.3% for AGIs $50k-75k, 0.2% for AGIs $100k-200k, 0.5% for AGIs over 200k)
Total itemized deductions: $24,346 (18% of AGI, reported on 59.3% of returns)
Here:
$24,346
State:
$24,621
Here:
18.4% of AGI
State:
18.5% of AGI
(% of AGI for various income ranges: 19.6% for AGIs below $25k, 14.8% for AGIs $25k-50k, 18.6% for AGIs $50k-75k, 18.1% for AGIs $75k-100k, 16.4% for AGIs $100k-200k, 11.3% for AGIs over 200k)
Charity contributions: $3,180 (reported on 50.2% of returns)
Here:
$3,180
State:
$4,449
(% of AGI for various income ranges: 1.1% for AGIs below $25k, 1.4% for AGIs $25k-50k, 1.8% for AGIs $50k-75k, 1.7% for AGIs $75k-100k, 1.8% for AGIs $100k-200k, 1.6% for AGIs over 200k)
Taxes paid: $8,290 (reported on 59.1% of returns)
80516:
$8,290
State:
$7,641
(% of AGI for various income ranges: 3.7% for AGIs below $25k, 3.4% for AGIs $25k-50k, 4.8% for AGIs $50k-75k, 5.2% for AGIs $75k-100k, 5.7% for AGIs $100k-200k, 5.1% for AGIs over 200k)
Earned income credit: $1,832 (reported on 7.0% of returns)
Here:
$1,832
State:
$2,095
(% of AGI for various income ranges: 3.4% for AGIs below $25k, 0.8% for AGIs $25k-50k)
Percentage of individuals using paid preparers for their 2012 taxes: 46.2%
Here:
46%
State:
49%
(% for various income ranges: 39.2% for AGIs below $25k, 43.2% for AGIs $25k-50k, 48.4% for AGIs $50k-75k, 45.7% for AGIs $75k-100k, 48.2% for AGIs $100k-200k, 61.5% for AGIs over 200k)
Averages for the 2004 tax year for zip code 80516, filed in 2005:
Average Adjusted Gross Income (AGI) in 2004: $70,104 (Individual Income Tax Returns)
Here:
$70,104
State:
$55,014
Salary/wage: $65,372 (reported on 89.7% of returns)
Here:
$65,372
State:
$46,010
(% of AGI for various income ranges: 208.2% for AGIs below $10k, 79.0% for AGIs $10k-25k, 82.4% for AGIs $25k-50k, 86.6% for AGIs $50k-75k, 88.8% for AGIs $75k-100k, 80.7% for AGIs over 100k)
Taxable interest for individuals: $1,118 (reported on 56.7% of returns)
This zip code:
$1,118
Colorado:
$2,127
(% of AGI for various income ranges: 8.2% for AGIs below $10k, 1.4% for AGIs $10k-25k, 1.1% for AGIs $25k-50k, 0.9% for AGIs $50k-75k, 0.5% for AGIs $75k-100k, 0.9% for AGIs over 100k)
Taxable dividends: $1,388 (reported on 33.6% of returns)
Here:
$1,388
State:
$3,782
(% of AGI for various income ranges: 5.8% for AGIs below $10k, 2.0% for AGIs $10k-25k, 0.8% for AGIs $25k-50k, 0.7% for AGIs $50k-75k, 0.5% for AGIs $75k-100k, 0.6% for AGIs over 100k)
Net capital gain/loss: +$8,943 (reported on 31.2% of returns)
Here:
+$8,943
State:
+$17,882
(% of AGI for various income ranges: -1.0% for AGIs below $10k, 0.5% for AGIs $10k-25k, 1.3% for AGIs $25k-50k, 1.1% for AGIs $50k-75k, 0.9% for AGIs $75k-100k, 6.6% for AGIs over 100k)
Profit/loss from business: +$10,885 (reported on 21.0% of returns)
Here:
+$10,885
State:
+$11,247
(% of AGI for various income ranges: 9.0% for AGIs below $10k, 8.0% for AGIs $10k-25k, 5.9% for AGIs $25k-50k, 2.9% for AGIs $50k-75k, 2.8% for AGIs $75k-100k, 2.7% for AGIs over 100k)
IRA payment deduction: $3,060 (reported on 4.0% of returns)
80516:
$3,060
Colorado:
$2,947
(% of AGI for various income ranges: 0.3% for AGIs $10k-25k, 0.4% for AGIs $25k-50k, 0.2% for AGIs $50k-75k, 0.1% for AGIs $75k-100k, 0.1% for AGIs over 100k)
Self-employed pension: $10,244 (reported on 1.4% of returns)
Here:
$10,244
Colorado:
$13,653
(% of AGI for various income ranges: 0.1% for AGIs $25k-50k, 0.1% for AGIs $50k-75k, 0.1% for AGIs $75k-100k, 0.3% for AGIs over 100k)
Total itemized deductions: $21,372 (22% of AGI, reported on 62.8% of returns)
Here:
$21,372
State:
$20,560
Here:
22.3% of AGI
State:
21.4% of AGI
(% of AGI for various income ranges: 52.7% for AGIs below $10k, 21.6% for AGIs $10k-25k, 22.0% for AGIs $25k-50k, 22.9% for AGIs $50k-75k, 21.5% for AGIs $75k-100k, 16.3% for AGIs over 100k)
Charity contributions deductions: $2,505 (3% of AGI, reported on 55.0% of returns)
Here:
$2,505
State:
$3,518
Here:
2.5% of AGI
State:
3.4% of AGI
(% of AGI for various income ranges: 1.6% for AGIs below $10k, 1.4% for AGIs $10k-25k, 1.7% for AGIs $25k-50k, 1.9% for AGIs $50k-75k, 2.0% for AGIs $75k-100k, 2.0% for AGIs over 100k)
Total tax: $10,486 (reported on 84.2% of returns)
80516:
$10,486
State:
$9,173
(% of AGI for various income ranges: 6.4% for AGIs below $10k, 4.8% for AGIs $10k-25k, 7.3% for AGIs $25k-50k, 8.3% for AGIs $50k-75k, 9.8% for AGIs $75k-100k, 16.3% for AGIs over 100k)
Earned income credit: $1,376 (reported on 6.8% of returns)
Here:
$1,376
State:
$1,595
Percentage of individuals using paid preparers for their 2004 taxes: 49.8%
Here:
50%
State:
55%
(% for various income ranges: 42.2% for AGIs below $10k, 48.4% for AGIs $10k-25k, 51.7% for AGIs $25k-50k, 50.9% for AGIs $50k-75k, 49.4% for AGIs $75k-100k, 52.9% for AGIs over 100k)
Likely homosexual households (counted as self-reported same-sex unmarried-partner households)
Lesbian couples: 0.1% of all households
Gay men: 0.0% of all households
Household received Food Stamps/SNAP in the past 12 months: 228 Household did not receive Food Stamps/SNAP in the past 12 months: 12,417
Women who had a birth in the past 12 months: 365 (364 now married, 11 unmarried) Women who did not have a birth in the past 12 months: 8,160 (4,998 now married, 3,121 unmarried)
Housing units in zip code 80516 with a mortgage: 8,853 (1,291 second mortgage, 92 home equity loan, 1,071 both second mortgage and home equity loan) Houses without a mortgage: 152
Median monthly owner costs for units with a mortgage: $2,802 Median monthly owner costs for units without a mortgage: $782
Residents with income below the poverty level in 2022:
This zip code:
3.4%
Whole state:
9.4%
Residents with income below 50% of the poverty level in 2022:
This zip code:
1.3%
Whole state:
4.6%
Median number of rooms in houses and condos:
Here:
7.6
State:
6.8
Median number of rooms in apartments:
Here:
5.3
State:
4.0
Notable locations in this zip code not listed on our city pages
Notable locations in zip code 80516: National (A), State Coal Mine Junction (B), Denver Regional Landfill (C), Cleland Dairy Farms (D), Colorado National Golf Club (E), Mountain View Fire Protection District Station 6 Erie (F), North Colorado Medical Evacuation (G), Air Life Denver (H), Frederick - Firestone Fire Protection District Station 2 (I), Erie Filtration Plant (J). Display/hide their locations on the map
Reservoirs: Section 35 Reservoir (A), Mountain View Lakes (B), Erie Lake (C), Elmwood Reservoir (D), Thomas Reservoir (E). Display/hide their locations on the map
8,642 married couples with children.
1,126 single-parent households (243 men, 883 women).
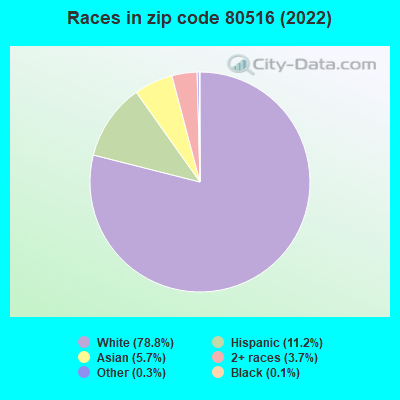
88.0% of residents of 80516 zip code speak English at home.
3.8% of residents speak Spanish at home (80% very well, 13% well, 7% not well).
5.4% of residents speak other Indo-European language at home (67% very well, 26% well, 8% not well).
2.3% of residents speak Asian or Pacific Island language at home (47% very well, 20% well, 33% not well).
0.3% of residents speak other language at home (25% very well, 3% well, 72% not well).
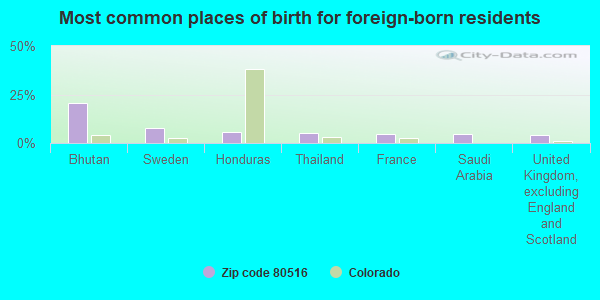
Foreign born population: 3,110 (8.8%) (54.4% of them are naturalized citizens)
This zip code:
8.8%
Whole state:
9.5%
21%Bhutan
8%Sweden
6%Honduras
5%Thailand
5%France
4%Saudi Arabia
4%United Kingdom, excluding England and Scotland
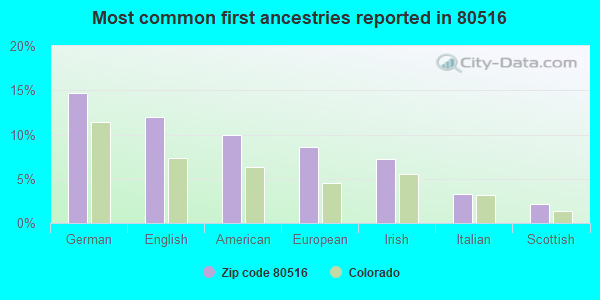
15%German
12%English
10%American
9%European
7%Irish
3%Italian
2%Scottish
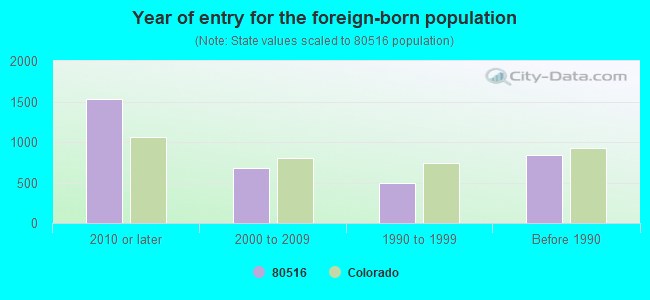
Year of entry for the foreign-born population
1,5252010 or later
6772000 to 2009
4981990 to 1999
834Before 1990
Major facilities with environmental interests located in this zip code:
645 HOLBROOK ST (645 HOLBROOK ST in ERIE, CO)
AIR MONITORING SITE (Airborne pollution emission tracking) ENFORCEMENT/COMPLIANCE ACTIVITY (Integrated Compliance Information System) - ICIS-08-2000-0220, FORMAL ENFORCEMENT ACTION, ICIS-08-2000-0289, (Integrated Compliance Information System) - ICIS-08-2000-0220, FORMAL ENFORCEMENT ACTION, ICIS-08-2000-0289, Alternative names: ERIE, TOWN OF
CROCKETT AND KELLY, INCORPORATED (1001 WELD COUNTY ROAD 1/PO BOX 750 in ERIE, CO)
STATE MASTER (Colorado database) - RCRAINFO-COD007079627, ENFORCEMENT/COMPLIANCE ACTIVITY (Resource Conservation and Recovery Act (tracking hazardous waste)) TRI REPORTER (Tracking of toxic chemicals releasing facilities) Business SIC classification: HOUSEHOLD APPLIANCES
FOUNDATION ENERGY MGT BECKY (NW NW SEC 6 T1N R68W in ERIE, 1.1 MI N OF, CO)
AIR MINOR (AIRS/AFS) CRITERIA AND HAZARDOUS AIR POLLUTANT INVENTORY (Inventory of air pollution sources) Business SIC classification: NATURAL GAS LIQUIDS Alternative names: MERIT ENERGY COMPANY - BECKY
ALL POINTS TRANSPORTATION (3198 WELD COUNTY ROAD 4 in ERIE, CO)
(Resource Conservation and Recovery Act (tracking hazardous waste))
K.P. KAUFFMAN CO - SPINDLE CONS FAC #4 (NW NW SECT 36 T2N R68W in FREDERICK, CO)
AIR MINOR (AIRS/AFS) CRITERIA AND HAZARDOUS AIR POLLUTANT INVENTORY (Inventory of air pollution sources) Business SIC classification: NATURAL GAS LIQUIDS
KB HOMES GRANDVIEW (2 BONANZA DRIVE in ERIE, CO)
ENFORCEMENT/COMPLIANCE ACTIVITY (Integrated Compliance Information System) National Pollutant Discharge Elimination System NON-MAJOR (Tracking pollutant discharge elimination systems) - permit Business SIC classification: NONCLASSIFIABLE ESTABLISHMENTS
BETTY PICRAUX (050 WELD COUNTY ROAD 3 in ERIE, CO)
(Resource Conservation and Recovery Act (tracking hazardous waste))
CAT CONSTRUCTION CO - I-25 NORTH 40 PROJ (INTERSECTION OF I-25 & WCR 6 in BROOMFIELD AREA, CO)
AIR MINOR (AIRS/AFS) CRITERIA AND HAZARDOUS AIR POLLUTANT INVENTORY (Inventory of air pollution sources) Business SIC classification: MISCELLANEOUS NONMETALLIC MINERALS, EXCEPT FUELS
KERR-MCGEE - BATTERY# 51440/51441 (NWNW SEC 4 T1N R68W in FREDERICK, 1.1 MI W OF, CO)
AIR MINOR (AIRS/AFS) CRITERIA AND HAZARDOUS AIR POLLUTANT INVENTORY (Inventory of air pollution sources) Business SIC classification: NATURAL GAS LIQUIDS Alternative names: KERR-MCGEE #51440 SEE 123-3856, KERR-MCGEE TANK BATTERY #51440, KERR-MCGEE TANK BATTERY #51440/51441
FOUNDATION ENERGY MGT LAURIDSON (NE SE SEC 18 T1N R67W in ERIE, CO)
AIR MINOR (AIRS/AFS) CRITERIA AND HAZARDOUS AIR POLLUTANT INVENTORY (Inventory of air pollution sources) Business SIC classification: NATURAL GAS LIQUIDS Alternative names: MERIT ENERGY COMPANY - LAURIDSON
AIR MINOR (AIRS/AFS) CRITERIA AND HAZARDOUS AIR POLLUTANT INVENTORY (Inventory of air pollution sources) Business SIC classification: NATURAL GAS LIQUIDS Alternative names: KERR-MCGEE TANK BATTERY #61461
AERO SYSTEMS (2580 S MAIN in ERIE, CO)
(Resource Conservation and Recovery Act (tracking hazardous waste))
INTEC (3771 MONARCH ST in FREDERICK, CO)
AIR MINOR (AIRS/AFS) Business SIC classification: PLASTICS PRODUCTS
Housing units lacking complete plumbing facilities: 0.8% Housing units lacking complete kitchen facilities: 0.6%
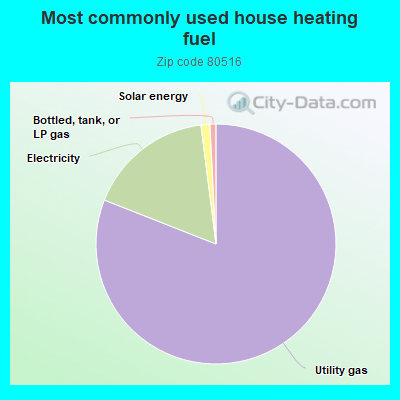
80.9%Utility gas
17.0%Electricity
1.2%Solar energy
0.8%Bottled, tank, or LP gas
Population in 1990: 304. Population change in the 1990s: +8,145 (+2679.3%).
Place of birth for U.S.-born residents:
This state: 13,993
Northeast: 2,908
Midwest: 5,984
South: 4,107
West: 4,969
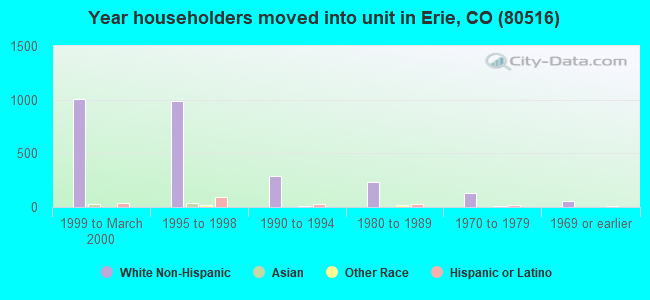
26% of the 80516 zip code residents lived in the same house 5 years ago. Out of people who lived in different houses, 38% lived in this county. Out of people who lived in different counties, 50% lived in Colorado.
85% of the 80516 zip code residents lived in the same house 1 year ago. Out of people who lived in different houses, 18% moved from this county. Out of people who lived in different houses, 65% moved from different county within same state. Out of people who lived in different houses, 18% moved from different state. Out of people who lived in different houses, 3% moved from abroad.
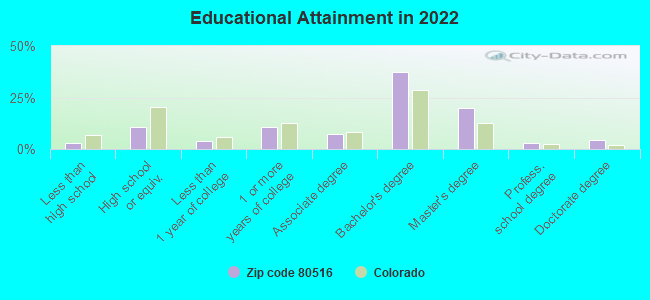
Private vs. public school enrollment:
Students in private schools in grades 1 to 8 (elementary and middle school): 477
Here:
9.7%
Colorado:
11.4%
Students in private schools in grades 9 to 12 (high school): 136
Here:
7.0%
Colorado:
8.5%
Students in private undergraduate colleges: 145
Here:
14.2%
Colorado:
14.0%
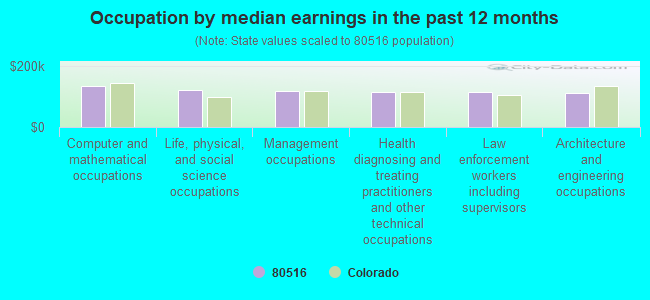
Occupation by median earnings in the past 12 months ($)
135,070Computer and mathematical occupations
120,995Life, physical, and social science occupations
119,666Management occupations
116,618Health diagnosing and treating practitioners and other technical occupations
113,765Law enforcement workers including supervisors
113,279Architecture and engineering occupations
Companies with federal contracts located in this zip code:
AERO SYSTEMS INC (2580S MAIN ST in ERIE, CO; small business) : $79,818 in 22 contractsfrom 2000 to 2006
Contracts for Aircraft Hydraulic, Vacuum, and De-icing System Components, Airframe Structural Components, Aircraft Air Conditioning, Heating, and Pressurizing Equipment, Miscellaneous Electric Power and Distribution Equipment, and moreby Army Signed by year:2000: -$56,135; 2001: $0; 2002: $67,512; 2003: $75,955; 2004: $967; 2005: $33,643; 2006: -$42,124.
Biggest contracts:
$43,972 with Army for Aircraft Hydraulic, Vacuum, and De-icing System Components. Signed on 2003-11-12. Completion date: 2006-12-30.
$37,844 with Army for Airframe Structural Components. Signed on 2002-05-10. Completion date: 2006-12-30.
$29,668, same as above.Signed on 2002-12-11. Completion date: 2006-12-30.
$23,563 with Army for Aircraft Hydraulic, Vacuum, and De-icing System Components. Signed on 2005-02-22. Completion date: 2006-12-30.
WESTERN TELCOM COMMUNICATIONS (1168 FLETCHER DR in ERIE, CO; small business)
$25,000 with Air Force for Defense Electronics and Communication Equipment -- Applied Research and Exploratory Development (R&D). Signed on 2005-01-13. Completion date: 2005-06-30.
ADVANCED FORMING TECHNOLOGY, I (3773 MONARCH ST in FREDERICK, CO)
$21,131 with Army for Structural Shapes, Nonferrous Base Metal. Signed on 2005-09-15. Completion date: 2005-11-22.
REDVEST SOLUTIONS INC (62 BAKER LN in ERIE, CO; small business)
$8,548 with Defense Information Systems Agency for Other ADP and Telecommunications Services (includes data storage on tapes, compact disks, etc.). Taking place in IL. Signed on 2005-12-29. Completion date: 2006-12-28.
Top industries in this zip code by the number of employees in 2005:
2005 - 2018 National Fire Incident Reporting System (NFIRS) incidents
Based on the data from the years 2005 - 2018 the average number of fire incidents per year is 47. The highest number of reported fires - 67 took place in 2008, and the least - 4 in 2005. The data has a growing trend.
When looking into fire subcategories, the most incidents belonged to: Outside Fires (53.7%), and Structure Fires (28.2%).
Fire incident types reported to NFIRS in Zip Code 80516


 Nearest zip codes: 80514, 80023, 80026, 80530, 80504, 80520.


 Based on the data from the years 2005 - 2018 the average number of fire incidents per year is 47. The highest number of reported fires - 67 took place in 2008, and the least - 4 in 2005. The data has a growing trend.
 When looking into fire subcategories, the most incidents belonged to: Outside Fires (53.7%), and Structure Fires (28.2%).