Estimated zip code population in 2022: 41,553 Zip code population in 2010: 33,833 Zip code population in 2000: 34,626
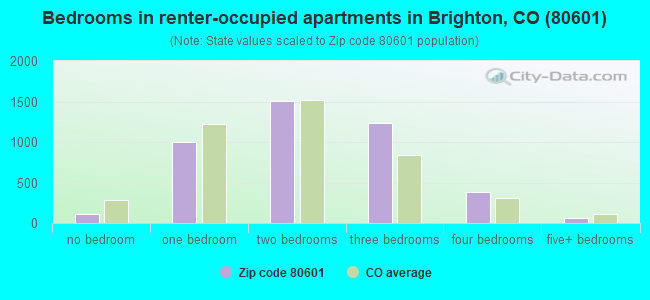
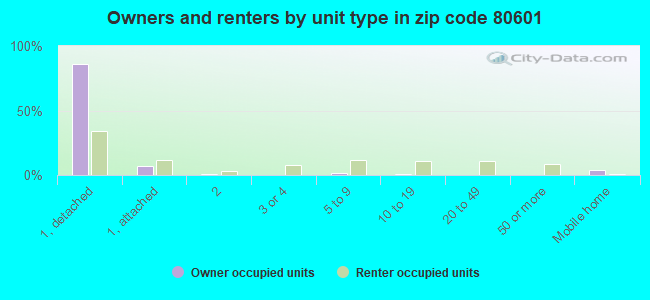
Houses and condos: 14,295 Renter-occupied apartments: 4,298
% of renters here:
31%
State:
34%
March 2022 cost of living index in zip code 80601: 108.9 (more than average, U.S. average is 100)
Land area: 26.8 sq. mi. Water area: 0.7 sq. mi.
Population density: 1,551 people per square mile
(low).
OSM Map
General Map
Google Map
MSN Map
OSM Map
General Map
Google Map
MSN Map
OSM Map
General Map
Google Map
MSN Map
OSM Map
General Map
Google Map
MSN Map
Please wait while loading the map...
Real estate property taxes paid for housing units in 2022:
This zip code:
0.6% ($2,898)
Colorado:
0.5% ($2,422)
Median real estate property taxes paid for housing units with mortgages in 2022: $3,025 (0.6%) Median real estate property taxes paid for housing units with no mortgage in 2022: $2,324 (0.5%)
Averages for the 2020 tax year for zip code 80601, filed in 2021:
Average Adjusted Gross Income (AGI) in 2020: $63,670 (Individual Income Tax Returns)
Here:
$63,670
State:
$89,260
Salary/wage: $57,235 (reported on 87.0% of returns)
Here:
$57,235
State:
$70,330
(% of AGI for various income ranges: 1298.0% for AGIs below $25k, 3915.4% for AGIs $25k-50k, 6852.2% for AGIs $50k-75k, 9831.5% for AGIs $75k-100k, 19482.8% for AGIs $100k-200k, 55661.2% for AGIs over 200k)
Taxable interest for individuals: $1,063 (reported on 20.3% of returns)
This zip code:
$1,063
Colorado:
$2,176
(% of AGI for various income ranges: 9.1% for AGIs below $25k, 10.3% for AGIs $25k-50k, 19.5% for AGIs $50k-75k, 24.9% for AGIs $75k-100k, 49.7% for AGIs $100k-200k, 1051.2% for AGIs over 200k)
Ordinary dividends: $2,903 (reported on 10.4% of returns)
Here:
$2,903
State:
$8,820
(% of AGI for various income ranges: 11.5% for AGIs below $25k, 11.1% for AGIs $25k-50k, 30.0% for AGIs $50k-75k, 48.0% for AGIs $75k-100k, 90.2% for AGIs $100k-200k, 1163.8% for AGIs over 200k)
Net capital gain/loss in AGI: +$14,731 (reported on 9.8% of returns)
Here:
+$14,731
State:
+$37,276
(% of AGI for various income ranges: 8.4% for AGIs below $25k, 7.8% for AGIs $25k-50k, 43.1% for AGIs $50k-75k, 81.2% for AGIs $75k-100k, 289.9% for AGIs $100k-200k, 12546.9% for AGIs over 200k)
Profit/loss from business: +$11,996 (reported on 15.5% of returns)
Here:
+$11,996
State:
+$15,295
(% of AGI for various income ranges: 169.6% for AGIs below $25k, 164.8% for AGIs $25k-50k, 200.8% for AGIs $50k-75k, 246.4% for AGIs $75k-100k, 455.2% for AGIs $100k-200k, 3821.9% for AGIs over 200k)
Taxable individual retirement arrangement distribution: $16,950 (reported on 5.8% of returns)
80601:
$16,950
Colorado:
$23,785
(% of AGI for various income ranges: 36.8% for AGIs below $25k, 52.9% for AGIs $25k-50k, 117.8% for AGIs $50k-75k, 159.0% for AGIs $75k-100k, 362.6% for AGIs $100k-200k, 2385.6% for AGIs over 200k)
Self-employed (Keogh) retirement plans: $19,600 (reported on 0.2% of returns)
80601:
$19,600
Colorado:
$23,633
(% of AGI for various income ranges: 31.8% for AGIs $100k-200k)
Total itemized deductions: $27,720 (reported on 11.1% of returns)
Here:
$27,720
State:
$35,141
(% of AGI for various income ranges: 42.3% for AGIs below $25k, 144.8% for AGIs $25k-50k, 434.8% for AGIs $50k-75k, 669.2% for AGIs $75k-100k, 1192.2% for AGIs $100k-200k, 6026.2% for AGIs over 200k)
Charity contributions: $5,859 (reported on 7.4% of returns)
Here:
$5,859
State:
$12,103
(% of AGI for various income ranges: 2.3% for AGIs below $25k, 12.2% for AGIs $25k-50k, 34.4% for AGIs $50k-75k, 63.8% for AGIs $75k-100k, 208.4% for AGIs $100k-200k, 1414.4% for AGIs over 200k)
Taxes paid: $7,115 (reported on 11.0% of returns)
80601:
$7,115
State:
$7,710
(% of AGI for various income ranges: 6.3% for AGIs below $25k, 27.2% for AGIs $25k-50k, 107.8% for AGIs $50k-75k, 185.7% for AGIs $75k-100k, 361.6% for AGIs $100k-200k, 1138.1% for AGIs over 200k)
Earned income credit: $2,262 (reported on 13.7% of returns)
Here:
$2,262
State:
$2,053
(% of AGI for various income ranges: 92.1% for AGIs below $25k, 61.5% for AGIs $25k-50k, 1.2% for AGIs $50k-75k)
Percentage of individuals using paid preparers for their 2020 taxes: 92.1%
Here:
92%
State:
93%
(% for various income ranges: 88.5% for AGIs below $25k, 93.1% for AGIs $25k-50k, 92.8% for AGIs $50k-75k, 93.7% for AGIs $75k-100k, 94.4% for AGIs $100k-200k, 96.0% for AGIs over 200k)
Averages for the 2012 tax year for zip code 80601, filed in 2013:
Average Adjusted Gross Income (AGI) in 2012: $52,317 (Individual Income Tax Returns)
Here:
$52,317
State:
$69,103
Salary/wage: $47,364 (reported on 88.6% of returns)
Here:
$47,364
State:
$54,794
(% of AGI for various income ranges: 78.2% for AGIs below $25k, 84.5% for AGIs $25k-50k, 84.0% for AGIs $50k-75k, 85.0% for AGIs $75k-100k, 84.0% for AGIs $100k-200k, 47.0% for AGIs over 200k)
Taxable interest for individuals: $1,092 (reported on 23.0% of returns)
This zip code:
$1,092
Colorado:
$1,971
(% of AGI for various income ranges: 0.6% for AGIs below $25k, 0.3% for AGIs $25k-50k, 0.4% for AGIs $50k-75k, 0.3% for AGIs $75k-100k, 0.4% for AGIs $100k-200k, 1.4% for AGIs over 200k)
Ordinary dividends: $2,431 (reported on 11.6% of returns)
Here:
$2,431
State:
$7,140
(% of AGI for various income ranges: 0.7% for AGIs below $25k, 0.3% for AGIs $25k-50k, 0.4% for AGIs $50k-75k, 0.2% for AGIs $75k-100k, 0.4% for AGIs $100k-200k, 2.0% for AGIs over 200k)
Net capital gain/loss in AGI: +$7,640 (reported on 9.0% of returns)
Here:
+$7,640
State:
+$23,009
(% of AGI for various income ranges: 0.3% for AGIs $50k-75k, 0.3% for AGIs $75k-100k, 0.8% for AGIs $100k-200k, 10.4% for AGIs over 200k)
Profit/loss from business: +$8,818 (reported on 13.6% of returns)
Here:
+$8,818
State:
+$13,514
(% of AGI for various income ranges: 6.3% for AGIs below $25k, 2.7% for AGIs $25k-50k, 1.9% for AGIs $50k-75k, 1.5% for AGIs $75k-100k, 1.6% for AGIs $100k-200k, 2.2% for AGIs over 200k)
Taxable individual retirement arrangement distribution: $12,319 (reported on 7.2% of returns)
80601:
$12,319
Colorado:
$17,927
(% of AGI for various income ranges: 1.9% for AGIs below $25k, 1.6% for AGIs $25k-50k, 1.6% for AGIs $50k-75k, 1.7% for AGIs $75k-100k, 1.9% for AGIs $100k-200k, 1.2% for AGIs over 200k)
Self-employment retirement plans: $23,633 (reported on 0.2% of returns)
80601:
$23,633
Colorado:
$19,483
Total itemized deductions: $19,571 (22% of AGI, reported on 34.8% of returns)
Here:
$19,571
State:
$24,621
Here:
21.9% of AGI
State:
18.5% of AGI
(% of AGI for various income ranges: 7.3% for AGIs below $25k, 9.5% for AGIs $25k-50k, 14.5% for AGIs $50k-75k, 15.4% for AGIs $75k-100k, 14.7% for AGIs $100k-200k, 12.4% for AGIs over 200k)
Charity contributions: $2,688 (reported on 27.1% of returns)
Here:
$2,688
State:
$4,449
(% of AGI for various income ranges: 0.5% for AGIs below $25k, 0.8% for AGIs $25k-50k, 1.3% for AGIs $50k-75k, 1.6% for AGIs $75k-100k, 1.8% for AGIs $100k-200k, 1.8% for AGIs over 200k)
Taxes paid: $5,399 (reported on 34.6% of returns)
80601:
$5,399
State:
$7,641
(% of AGI for various income ranges: 1.0% for AGIs below $25k, 1.9% for AGIs $25k-50k, 3.5% for AGIs $50k-75k, 4.2% for AGIs $75k-100k, 4.8% for AGIs $100k-200k, 4.6% for AGIs over 200k)
Earned income credit: $2,347 (reported on 18.9% of returns)
Here:
$2,347
State:
$2,095
(% of AGI for various income ranges: 7.0% for AGIs below $25k, 1.4% for AGIs $25k-50k)
Percentage of individuals using paid preparers for their 2012 taxes: 51.7%
Here:
52%
State:
49%
(% for various income ranges: 50.6% for AGIs below $25k, 51.4% for AGIs $25k-50k, 52.3% for AGIs $50k-75k, 49.7% for AGIs $75k-100k, 53.9% for AGIs $100k-200k, 76.2% for AGIs over 200k)
Averages for the 2004 tax year for zip code 80601, filed in 2005:
Average Adjusted Gross Income (AGI) in 2004: $44,999 (Individual Income Tax Returns)
Here:
$44,999
State:
$55,014
Salary/wage: $42,001 (reported on 89.0% of returns)
Here:
$42,001
State:
$46,010
(% of AGI for various income ranges: 269.5% for AGIs below $10k, 81.6% for AGIs $10k-25k, 87.0% for AGIs $25k-50k, 88.0% for AGIs $50k-75k, 88.9% for AGIs $75k-100k, 67.0% for AGIs over 100k)
Taxable interest for individuals: $1,409 (reported on 36.8% of returns)
This zip code:
$1,409
Colorado:
$2,127
(% of AGI for various income ranges: 13.2% for AGIs below $10k, 2.0% for AGIs $10k-25k, 0.7% for AGIs $25k-50k, 0.7% for AGIs $50k-75k, 0.7% for AGIs $75k-100k, 1.8% for AGIs over 100k)
Taxable dividends: $1,628 (reported on 15.9% of returns)
Here:
$1,628
State:
$3,782
(% of AGI for various income ranges: 6.1% for AGIs below $10k, 0.8% for AGIs $10k-25k, 0.3% for AGIs $25k-50k, 0.3% for AGIs $50k-75k, 0.4% for AGIs $75k-100k, 1.0% for AGIs over 100k)
Net capital gain/loss: +$8,798 (reported on 13.5% of returns)
Here:
+$8,798
State:
+$17,882
(% of AGI for various income ranges: -0.9% for AGIs below $10k, 0.2% for AGIs $10k-25k, 0.5% for AGIs $25k-50k, 0.5% for AGIs $50k-75k, 0.9% for AGIs $75k-100k, 9.0% for AGIs over 100k)
Profit/loss from business: +$6,828 (reported on 14.7% of returns)
Here:
+$6,828
State:
+$11,247
(% of AGI for various income ranges: -27.4% for AGIs below $10k, 4.4% for AGIs $10k-25k, 2.0% for AGIs $25k-50k, 1.9% for AGIs $50k-75k, 1.4% for AGIs $75k-100k, 3.3% for AGIs over 100k)
IRA payment deduction: $2,775 (reported on 2.0% of returns)
80601:
$2,775
Colorado:
$2,947
(% of AGI for various income ranges: 0.1% for AGIs $10k-25k, 0.2% for AGIs $25k-50k, 0.1% for AGIs $50k-75k, 0.1% for AGIs $75k-100k, 0.1% for AGIs over 100k)
Self-employed pension: $11,723 (reported on 0.4% of returns)
Here:
$11,723
Colorado:
$13,653
Total itemized deductions: $18,562 (27% of AGI, reported on 45.0% of returns)
Here:
$18,562
State:
$20,560
Here:
26.5% of AGI
State:
21.4% of AGI
(% of AGI for various income ranges: 43.0% for AGIs below $10k, 13.6% for AGIs $10k-25k, 18.0% for AGIs $25k-50k, 20.9% for AGIs $50k-75k, 20.2% for AGIs $75k-100k, 16.7% for AGIs over 100k)
Charity contributions deductions: $2,283 (3% of AGI, reported on 38.3% of returns)
Here:
$2,283
State:
$3,518
Here:
3.2% of AGI
State:
3.4% of AGI
(% of AGI for various income ranges: 2.0% for AGIs below $10k, 1.1% for AGIs $10k-25k, 1.6% for AGIs $25k-50k, 2.0% for AGIs $50k-75k, 1.8% for AGIs $75k-100k, 2.6% for AGIs over 100k)
Total tax: $5,660 (reported on 72.9% of returns)
80601:
$5,660
State:
$9,173
(% of AGI for various income ranges: 7.5% for AGIs below $10k, 3.4% for AGIs $10k-25k, 5.8% for AGIs $25k-50k, 7.6% for AGIs $50k-75k, 9.1% for AGIs $75k-100k, 15.7% for AGIs over 100k)
Earned income credit: $1,847 (reported on 16.0% of returns)
Here:
$1,847
State:
$1,595
Percentage of individuals using paid preparers for their 2004 taxes: 57.0%
Here:
57%
State:
55%
(% for various income ranges: 50.3% for AGIs below $10k, 57.8% for AGIs $10k-25k, 56.5% for AGIs $25k-50k, 57.9% for AGIs $50k-75k, 56.3% for AGIs $75k-100k, 68.9% for AGIs over 100k)
Likely homosexual households (counted as self-reported same-sex unmarried-partner households)
Lesbian couples: 0.0% of all households
Gay men: 0.1% of all households
Household received Food Stamps/SNAP in the past 12 months: 1,475 Household did not receive Food Stamps/SNAP in the past 12 months: 12,627
Women who had a birth in the past 12 months: 523 (405 now married, 115 unmarried) Women who did not have a birth in the past 12 months: 8,917 (4,964 now married, 3,924 unmarried)
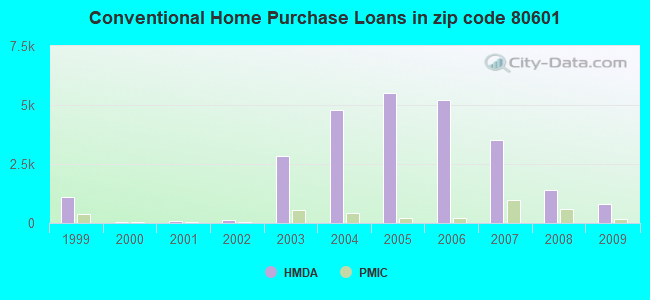
Housing units in zip code 80601 with a mortgage: 7,327 (658 second mortgage, 487 both second mortgage and home equity loan) Houses without a mortgage: 5
Median monthly owner costs for units with a mortgage: $2,255 Median monthly owner costs for units without a mortgage: $601
Residents with income below the poverty level in 2022:
This zip code:
8.6%
Whole state:
9.4%
Residents with income below 50% of the poverty level in 2022:
This zip code:
5.4%
Whole state:
4.6%
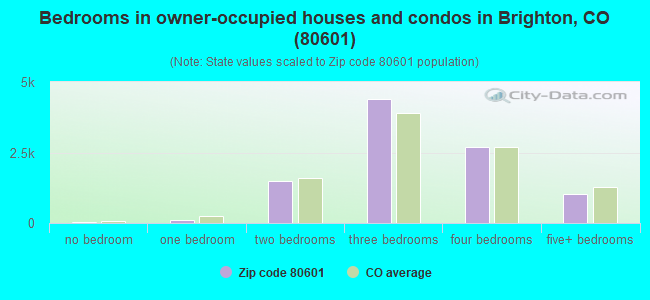
Median number of rooms in houses and condos:
Here:
6.4
State:
6.8
Median number of rooms in apartments:
Here:
4.4
State:
4.0
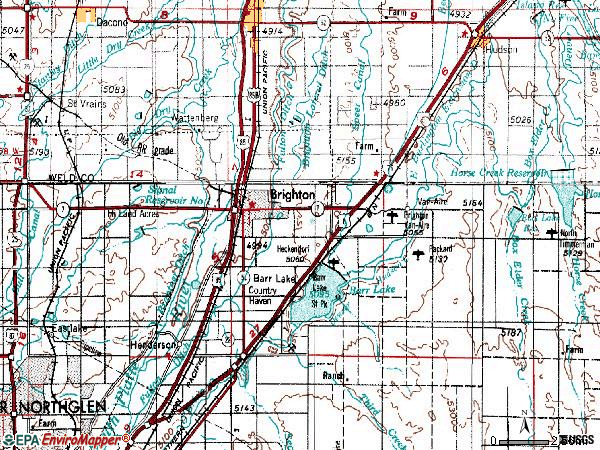
Notable locations in this zip code not listed on our city pages
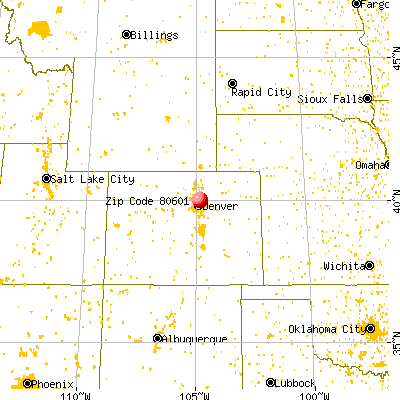
Notable locations in zip code 80601: Riverdale Knolls Golf Course (A), Platte Valley Medical Center - Emergency Medical Service (B), Platte Valley Medical Center - Emergency Medical Services (C), Adams County Justice Center (D), Adams County Detention Facility (E), Adams County Sheriff's Office Headquarters (F), Brighton Police Department (G), Greater Brighton Fire Protection District Station 51 Headquarters (H), Brighton Fire Rescue District (I), Greater Brighton Fire Protection District Station 52 (J). Display/hide their locations on the map
7,060 married couples with children.
2,435 single-parent households (363 men, 2,072 women).
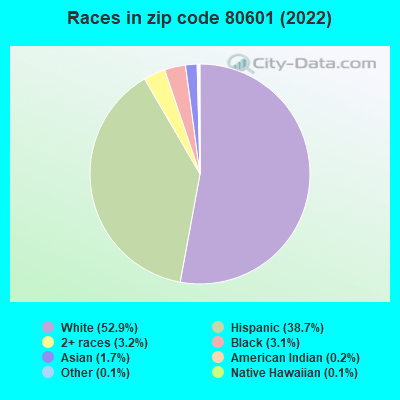
78.0% of residents of 80601 zip code speak English at home.
19.6% of residents speak Spanish at home (72% very well, 16% well, 8% not well, 4% not at all).
0.8% of residents speak other Indo-European language at home (73% very well, 23% well, 3% not well).
1.0% of residents speak Asian or Pacific Island language at home (73% very well, 21% well, 5% not well).
0.2% of residents speak other language at home (47% very well, 33% well, 20% not well).
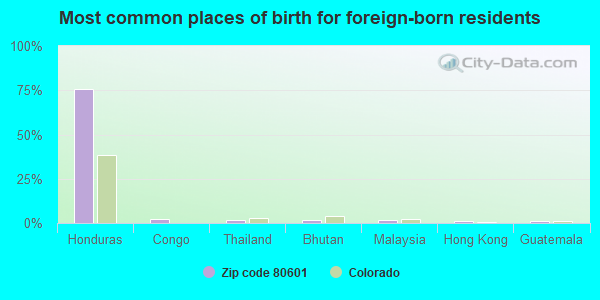
Foreign born population: 3,450 (8.3%) (49.1% of them are naturalized citizens)
This zip code:
8.3%
Whole state:
9.5%
76%Honduras
2%Congo
2%Thailand
2%Bhutan
2%Malaysia
1%Hong Kong
1%Guatemala
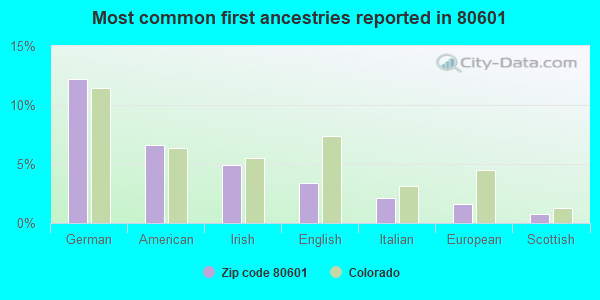
12%German
7%American
5%Irish
3%English
2%Italian
2%European
1%Scottish
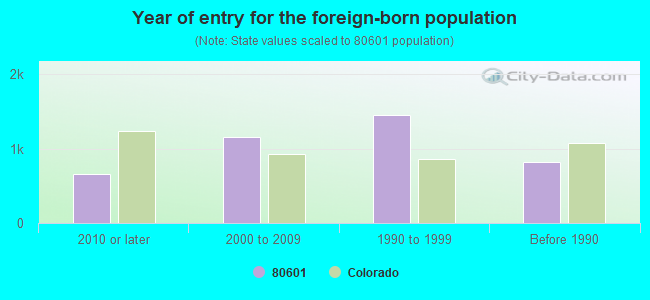
Year of entry for the foreign-born population
6542010 or later
1,1612000 to 2009
1,4541990 to 1999
827Before 1990
Major facilities with environmental interests located in this zip code:
CENTRAL PRODUCTS COMPANY (1095 SOUTH 4TH AVENUE in BRIGHTON, CO)
AIR MAJOR (AIRS/AFS) STATE MASTER (Colorado database) - RCRAINFO-COD105694947, ENFORCEMENT/COMPLIANCE ACTIVITY, APCDSSP-CO0010195, AIR MAJOR, RCRAINFO-COD105694947, LQG ENFORCEMENT/COMPLIANCE ACTIVITY (Integrated Compliance Information System) - ICIS-08-1999-0226, FORMAL ENFORCEMENT ACTION (Integrated Compliance Information System) - ICIS-08-1999-0226, FORMAL ENFORCEMENT ACTION CRITERIA AND HAZARDOUS AIR POLLUTANT INVENTORY (Inventory of air pollution sources) HAZARDOUS WASTE BIENNIAL REPORTER (Resource Conservation and Recovery Act (tracking hazardous waste)) Large Quantity Generators, more that 1000 kg of hazardous waste/month (Resource Conservation and Recovery Act (tracking hazardous waste)) - notification TRI REPORTER (Tracking of toxic chemicals releasing facilities) Business SIC classification: PACKAGING PAPER AND PLASTICS FILM, COATED AND LAMINATED; COATED AND LAMINATED PAPER; ADHESIVES AND SEALANTS; UNSUPPORTED PLASTICS FILM AND SHEET Business NAICS classification: COATED AND LAMINATED PAPER MANUFACTURING.; COATED AND LAMINATED PAPER MANUFACTURING. Organizations: ALCO STANDARD CORP (CONTACT/OWNER)
, CPC ACQUISITION CORPORATION (CONTACT/OWNER)
, SPINNAKER INDUSTRIES, INC. (CONTACT/OWNER)
, INTERTAPE POLYMER GROUP (CONTACT/OWNER)
Alternative names: CENTRAL PRODUCTS CO DBA INTERTAPE POLYMR, INTERTAPE POLYMER GROUP
AGGREGATE INDUSTRIES-WCR,INC-SCREEN (13000 E 168TH AVE in BRIGHTON, CO)
AIR MINOR (AIRS/AFS) CRITERIA AND HAZARDOUS AIR POLLUTANT INVENTORY (Inventory of air pollution sources) National Pollutant Discharge Elimination System NON-MAJOR (Tracking pollutant discharge elimination systems) - permit Business SIC classification: DIMENSION STONE; CONSTRUCTION SAND AND GRAVEL; BRICK, STONE, AND RELATED CONSTRUCTION MATERIALS Alternative names: CAMAS COLORADO, INC., CAMAS COLORADO DBA AGGREGATE INDUSTRIES, HALL-IRWIN CONST CO, HALL IRWIN CONSTRUCTION CO, TUCSON RESOURCES LLC, TUCSON SAND AND GRAVEL
CHEMREX INCORPORATED (10601 FULTON STREET in BRIGHTON, CO)
AIR MINOR (AIRS/AFS) STATE MASTER (Colorado database) - RCRAINFO-COR000010108, LQG CRITERIA AND HAZARDOUS AIR POLLUTANT INVENTORY (Inventory of air pollution sources) HAZARDOUS WASTE BIENNIAL REPORTER (Resource Conservation and Recovery Act (tracking hazardous waste)) Large Quantity Generators, more that 1000 kg of hazardous waste/month (Resource Conservation and Recovery Act (tracking hazardous waste)) - notification TRI REPORTER (Tracking of toxic chemicals releasing facilities) Business SIC classification: PAINTS, VARNISHES, LACQUERS, ENAMELS, AND ALLIED PRODUCTS; ADHESIVES AND SEALANTS Business NAICS classification: ADHESIVE MANUFACTURING.; ALL OTHER MISCELLANEOUS CHEMICAL PRODUCT AND PREPARATION MANUFACTURING. Organizations: DEGUSSA CONSTRUCTION CHEMICALS OPERATION (CONTACT/OPERATOR)
, SKW-MBT OPERATIONS INC (CONTACT/OWNER)
, DEGUSSA CONSTRUCTION CHEMICALS (CONTACT/OWNER)
Alternative names: DEGUSSA CONST CHEM OPERATIONS INC, DEGUSSA CONSTRUCTION CHEMICALS OPS. INC., DEGUSSA CONSTRUCTION CHEMICALS OPS. INC., SKW-MBT OPS. INC.
JOHNSON AUTO PLAZA, INCORPORATED (12410 EAST 136TH AVENUE in BRIGHTON, CO)
AIR MINOR (AIRS/AFS) STATE MASTER (Colorado database) - RCRAINFO-COR000201293, SQG CRITERIA AND HAZARDOUS AIR POLLUTANT INVENTORY (Inventory of air pollution sources) (Resource Conservation and Recovery Act (tracking hazardous waste)) Small Quantity Generators, between 100 kg and 1000 kg of hazardous waste/month (Resource Conservation and Recovery Act (tracking hazardous waste)) - notification Business SIC classification: TOP, BODY, AND UPHOLSTERY REPAIR SHOPS AND PAINT SHOPS Organizations: RICHARD JOHNSON (CONTACT/OWNER)
, EMANUEL BUGELLI (CONTACT/OWNER)
Alternative names: TOWN & COUNTRY AUTO CENTER INC
BRIGHTON AUTO BODY (190 GREAT WESTERN ROAD in BRIGHTON, CO)
AIR MINOR (AIRS/AFS) STATE MASTER (Colorado database) - RCRAINFO-COD069718682, SQG CRITERIA AND HAZARDOUS AIR POLLUTANT INVENTORY (Inventory of air pollution sources) Conditionally Exempt Small Quantity Generators, less than 100 kg/month of hazardous waste (Resource Conservation and Recovery Act (tracking hazardous waste)) Business SIC classification: TOP, BODY, AND UPHOLSTERY REPAIR SHOPS AND PAINT SHOPS Business NAICS classification: AUTOMOTIVE BODY, PAINT, AND INTERIOR REPAIR AND MAINTENANCE. Organizations: KEITH TAYLOR (CONTACT/OWNER)
BRIGHTON HIGH SCHOOL (270 SOUTH 8TH AVENUE in BRIGHTON, CO)
(National Center for Education Statistics) - STATE ID-1022 (Resource Conservation and Recovery Act (tracking hazardous waste)) Organizations: BRIGHTON SCHOOL DIST (CONTACT/OWNER)
, BRIGHTON 27J (SCHOOL DISTRICT)
BRIGHTON ADVENTIST ACADEMY (820 SOUTH 5TH AVENUE in BRIGHTON, CO)
(Integrated Compliance Information System) - ICIS-08-1987-0151, FORMAL ENFORCEMENT ACTION COMPLIANCE ACTIVITY (Tracking inspections of insecticide, fungicide, and rodenticide, and toxic substances) Business SIC classification: ELEMENTARY AND SECONDARY SCHOOLS
AMERICAN PRIDE COOPERATIVE (55 WEST BROMLEY LANE in BRIGHTON, CO)
AIR MINOR (AIRS/AFS) ENFORCEMENT/COMPLIANCE ACTIVITY (Integrated Compliance Information System) COMPLIANCE ACTIVITY (Tracking inspections of insecticide, fungicide, and rodenticide, and toxic substances) CRITERIA AND HAZARDOUS AIR POLLUTANT INVENTORY (Inventory of air pollution sources) Business SIC classification: FARM SUPPLIES Alternative names: ADAMS COUNTY CONSUMERS COOP, AMERICAN PRIDE CO-OP, AMERICAN PRIDE COOP - BRIGHTON, AMERICAN PRIDE FERTILIZER
HORIZON HIGH SCHOOL (5321 EAST 136 AVENUE in BRIGHTON, CO)
(National Center for Education Statistics) - STATE ID-4108 Organizations: NORTHGLENN-THORNTON 12 (SCHOOL DISTRICT)
BRIGHT HORIZONS PRE-KINDERGARTEN SCHOOL (5321 EAST 136TH AVENUE in BRIGHTON, CO)
(National Center for Education Statistics) - STATE ID-1020 Organizations: NORTHGLENN-THORNTON 12 (SCHOOL DISTRICT)
BROMLEY EAST CHARTER SCHOOL (356 LONGSPUR DRIVE in BRIGHTON, CO)
(National Center for Education Statistics) - STATE ID-1052 Organizations: BRIGHTON 27J (SCHOOL DISTRICT)
BRIGHTON CHARTER SCHOOL (1931 EAST BRIDGE STREET in BRIGHTON, CO)
(National Center for Education Statistics) - STATE ID-1027 Organizations: BRIGHTON 27J (SCHOOL DISTRICT)
BRIGHTON HERITAGE ACADEMY (830 BRIDGE STREET in BRIGHTON, CO)
(National Center for Education Statistics) - STATE ID-1021 Organizations: BRIGHTON 27J (SCHOOL DISTRICT)
Housing units lacking complete plumbing facilities: 0.3% Housing units lacking complete kitchen facilities: 0.9%
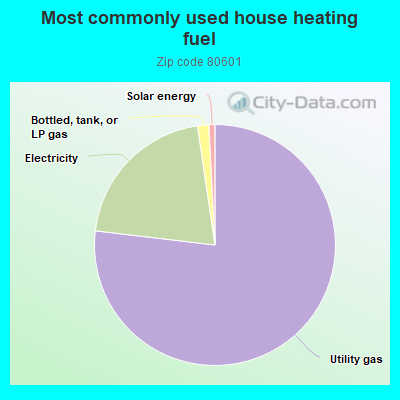
76.5%Utility gas
20.7%Electricity
1.5%Bottled, tank, or LP gas
0.8%Solar energy
Population in 1990: 20,533. Population change in the 1990s: +14,093 (+68.6%).
Place of birth for U.S.-born residents:
This state: 23,441
Northeast: 990
Midwest: 4,394
South: 3,149
West: 5,313
43% of the 80601 zip code residents lived in the same house 5 years ago. Out of people who lived in different houses, 45% lived in this county. Out of people who lived in different counties, 50% lived in Colorado.
89% of the 80601 zip code residents lived in the same house 1 year ago. Out of people who lived in different houses, 46% moved from this county. Out of people who lived in different houses, 40% moved from different county within same state. Out of people who lived in different houses, 13% moved from different state. Out of people who lived in different houses, 1% moved from abroad.
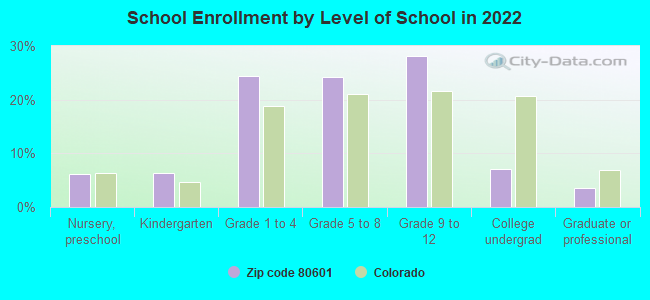
Private vs. public school enrollment:
Students in private schools in grades 1 to 8 (elementary and middle school): 210
Here:
4.4%
Colorado:
11.4%
Students in private schools in grades 9 to 12 (high school): 305
Here:
10.9%
Colorado:
8.5%
Students in private undergraduate colleges: 133
Here:
18.9%
Colorado:
14.0%
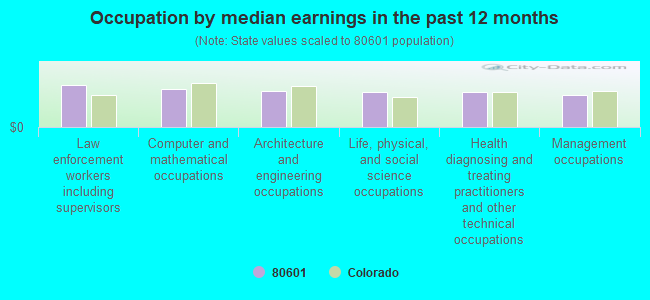
Occupation by median earnings in the past 12 months ($)
104,885Law enforcement workers including supervisors
95,726Computer and mathematical occupations
90,741Architecture and engineering occupations
87,839Life, physical, and social science occupations
86,476Health diagnosing and treating practitioners and other technical occupations
80,860Management occupations
Companies with federal contracts located in this zip code (BRIGHTON, CO):
UNITED POWER, INC (18551 E 160TH AVE) : $160,250 in 14 contractsfrom 2000 to 2004
Contracts for Other Utilities, Construction of Structures and Facilities -- Other Utilities by Army Signed by year:2000: $40,000; 2001: $30,000; 2002: $40,000; 2003: $22,500; 2004: $27,750; 2005: $0; 2006: $0.
Biggest contracts:
$40,000 with Army for Other Utilities. Signed on 2000-11-08. Completion date: 2001-09-30.
$40,000, same as above.Signed on 2001-05-09. Completion date: 2001-09-30.
$22,500 with Army for Construction of Structures and Facilities -- Other Utilities. Signed on 2004-03-04. Completion date: 2004-09-30.
$20,000 with Army for Other Utilities. Signed on 2002-04-29. Completion date: 2002-09-30.
MILLENNIUM SENSOR, LLC (15611 COLORADO BLVD; small business) : $52,589 in 3 contractsfrom 2003 to 2006
$39,310 with U.S. Special Operations Command for Miscellaneous Alarm, Signal and Security Detection Systems. Signed on 2006-03-28. Completion date: 2006-04-03.
$7,208 with Army for Communications Security Equipment and Components. Taking place in CA. Signed on 2006-02-09. Completion date: 2006-03-24.
$6,071 with Army for Miscellaneous Alarm, Signal and Security Detection Systems. Taking place in CA. Signed on 2003-09-09. Completion date: 2003-09-17.
APEX MEDICAL WASTE SERVCE, INC (10521 HAVANA CT; small business) : $44,144 in 6 contractsfrom 2004 to 2006
Contracts for Hazardous Substance Removal, Cleanup, and Disposal Services and Operational Support, Trash/Garbage Collection Services - Including Portable Sanitation Services, Other Medical Services, Miscellaneous Items by Air Force Signed by year:2000: $0; 2001: $0; 2002: $0; 2003: $0; 2004: $8,388; 2005: $20,636; 2006: $15,120.
Biggest contracts:
$9,120 with Air Force for Hazardous Substance Removal, Cleanup, and Disposal Services and Operational Support. Signed on 2006-06-27. Completion date: 2007-07-02.
$8,772 with Air Force for Trash/Garbage Collection Services - Including Portable Sanitation Services. Signed on 2005-10-01. Completion date: 2006-09-30.
$8,664 with Air Force for Other Medical Services. Signed on 2005-06-27. Completion date: 2006-07-02.
$8,388 with Air Force for Trash/Garbage Collection Services - Including Portable Sanitation Services. Signed on 2004-10-29. Completion date: 2005-09-30.
PRECISION INDUSTRIAL CONTRACTO (10275 E 106TH AVE; small business) : $36,091 in 3 contractsin 2006
$16,591 with Army for Maintenance, Repair and Rebuilding of Equipment -- Special Industry Machinery. Signed on 2006-02-24. Completion date: 2006-07-28.
$13,500, same as above.Signed on 2006-07-10. Completion date: 2006-07-18.
$6,000, same as above.Signed on 2006-05-25. Completion date: 2006-07-28.
WESTERN STAR OF COLORADO, INC (10421 E 107TH PLACE)
$6,990 with Army for Trucks and Truck Tractors, Wheeled. Signed on 2004-02-11. Completion date: 2004-02-29.
PLATTE VALLEY NET, LLC (100 W SOUTHERN ST #19; small business) : $6,294 in 2 contractsin 2004
$6,089 with Navy for Generators and Generators Sets, Electrical. Signed on 2004-07-09. Completion date: 2004-07-21.
$205, same as above.Signed on 2004-09-17. Completion date: 2004-07-21.
HIGH PLAINS PEST MANAGEMENT LL (91 S 14TH AVENUE DR; small business) : $4,400 in 3 contractsfrom 2004 to 2005
$1,800 with Army for Insect and Rodent Control Services. Signed on 2005-05-23. Completion date: 2006-06-30.
$1,800, same as above.Signed on 2004-06-17. Completion date: 2005-06-30.
$800, same as above.Signed on 2004-01-15. Completion date: 2004-06-30.
Top industries in this zip code by the number of employees in 2005:
2004 - 2018 National Fire Incident Reporting System (NFIRS) incidents
According to the data from the years 2004 - 2018 the average number of fires per year is 130. The highest number of reported fire incidents - 175 took place in 2007, and the least - 10 in 2004. The data has an increasing trend.
When looking into fire subcategories, the most reports belonged to: Outside Fires (52.8%), and Structure Fires (28.5%).
Fire incident types reported to NFIRS in Zip Code 80601


 Nearest zip codes: 80603, 80022, 80602, 80640, 80621, 80241.


 According to the data from the years 2004 - 2018 the average number of fires per year is 130. The highest number of reported fire incidents - 175 took place in 2007, and the least - 10 in 2004. The data has an increasing trend.
 When looking into fire subcategories, the most reports belonged to: Outside Fires (52.8%), and Structure Fires (28.5%).