Averages for the 2020 tax year for zip code 81022, filed in 2021:
Average Adjusted Gross Income (AGI) in 2020: $47,242 (Individual Income Tax Returns)
Here:
$47,242
State:
$89,260
Salary/wage: $41,536 (reported on 79.1% of returns)
Here:
$41,536
State:
$70,330
(% of AGI for various income ranges: 1127.2% for AGIs below $25k, 3681.9% for AGIs $25k-50k, 6392.5% for AGIs $50k-75k, 8480.0% for AGIs $75k-100k, 27940.0% for AGIs $100k-200k)
Taxable interest for individuals: $450 (reported on 23.9% of returns)
This zip code:
$450
Colorado:
$2,176
(% of AGI for various income ranges: 3.3% for AGIs below $25k, 23.8% for AGIs $25k-50k, 8.8% for AGIs $50k-75k, 105.0% for AGIs $100k-200k)
Ordinary dividends: $1,440 (reported on 7.5% of returns)
Here:
$1,440
State:
$8,820
(% of AGI for various income ranges: 11.1% for AGIs below $25k, 65.0% for AGIs $50k-75k)
Net capital gain/loss in AGI: +$29,360 (reported on 7.5% of returns)
Here:
+$29,360
State:
+$37,276
(% of AGI for various income ranges: 85.0% for AGIs $25k-50k, 3330.0% for AGIs $75k-100k)
Profit/loss from business: +$8,125 (reported on 11.9% of returns)
Here:
+$8,125
State:
+$15,295
(% of AGI for various income ranges: 271.7% for AGIs below $25k, 201.3% for AGIs $50k-75k)
Taxable individual retirement arrangement distribution: $8,900 (reported on 6.0% of returns)
81022:
$8,900
Colorado:
$23,785
(% of AGI for various income ranges: 445.0% for AGIs $50k-75k)
Earned income credit: $2,213 (reported on 22.4% of returns)
Here:
$2,213
State:
$2,053
(% of AGI for various income ranges: 115.6% for AGIs below $25k, 77.5% for AGIs $25k-50k)
Percentage of individuals using paid preparers for their 2020 taxes: 94.0%
Here:
94%
State:
93%
(% for various income ranges: 92.0% for AGIs below $25k, 95.0% for AGIs $25k-50k, 90.9% for AGIs $50k-75k, 100.0% for AGIs $75k-100k, 100.0% for AGIs $100k-200k)
Averages for the 2012 tax year for zip code 81022, filed in 2013:
Average Adjusted Gross Income (AGI) in 2012: $41,656 (Individual Income Tax Returns)
Here:
$41,656
State:
$69,103
Salary/wage: $36,821 (reported on 79.7% of returns)
Here:
$36,821
State:
$54,794
(% of AGI for various income ranges: 70.9% for AGIs below $25k, 77.4% for AGIs $25k-50k, 78.3% for AGIs $50k-75k, 76.8% for AGIs $75k-100k, 52.0% for AGIs $100k-200k)
Taxable interest for individuals: $1,388 (reported on 28.8% of returns)
This zip code:
$1,388
Colorado:
$1,971
(% of AGI for various income ranges: 1.1% for AGIs below $25k, 0.1% for AGIs $25k-50k, 1.1% for AGIs $50k-75k, 3.5% for AGIs $75k-100k)
Ordinary dividends: $1,050 (reported on 10.2% of returns)
Here:
$1,050
State:
$7,140
Net capital gain/loss in AGI: +$9,650 (reported on 6.8% of returns)
Here:
+$9,650
State:
+$23,009
Profit/loss from business: +$3,988 (reported on 13.6% of returns)
Here:
+$3,988
State:
+$13,514
Taxable individual retirement arrangement distribution: $5,475 (reported on 6.8% of returns)
81022:
$5,475
Colorado:
$17,927
Total itemized deductions: $16,350 (21% of AGI, reported on 20.3% of returns)
Here:
$16,350
State:
$24,621
Here:
21.3% of AGI
State:
18.5% of AGI
(% of AGI for various income ranges: 8.7% for AGIs $25k-50k, 14.5% for AGIs $50k-75k, 10.6% for AGIs $100k-200k)
Charity contributions: $2,300 (reported on 13.6% of returns)
Here:
$2,300
State:
$4,449
(% of AGI for various income ranges: 1.4% for AGIs below $25k, 1.0% for AGIs $50k-75k, 1.5% for AGIs $100k-200k)
Taxes paid: $4,358 (reported on 20.3% of returns)
81022:
$4,358
State:
$7,641
(% of AGI for various income ranges: 1.7% for AGIs $25k-50k, 3.8% for AGIs $50k-75k, 3.5% for AGIs $100k-200k)
Earned income credit: $2,115 (reported on 22.0% of returns)
Here:
$2,115
State:
$2,095
(% of AGI for various income ranges: 5.8% for AGIs below $25k, 1.6% for AGIs $25k-50k)
Percentage of individuals using paid preparers for their 2012 taxes: 59.3%
Here:
59%
State:
49%
(% for various income ranges: 58.3% for AGIs below $25k, 52.9% for AGIs $25k-50k, 66.7% for AGIs $50k-75k, 60.0% for AGIs $75k-100k, 75.0% for AGIs $100k-200k)
Averages for the 2004 tax year for zip code 81022, filed in 2005:
Average Adjusted Gross Income (AGI) in 2004: $33,229 (Individual Income Tax Returns)
Here:
$33,229
State:
$55,014
Salary/wage: $32,943 (reported on 82.7% of returns)
Here:
$32,943
State:
$46,010
(% of AGI for various income ranges: 130.4% for AGIs below $10k, 66.2% for AGIs $10k-25k, 84.2% for AGIs $25k-50k, 91.7% for AGIs $50k-75k, 78.3% for AGIs $75k-100k, 75.7% for AGIs over 100k)
Taxable interest for individuals: $949 (reported on 30.1% of returns)
This zip code:
$949
Colorado:
$2,127
(% of AGI for various income ranges: 1.3% for AGIs below $10k, 1.2% for AGIs $10k-25k, 1.3% for AGIs $25k-50k, 0.3% for AGIs $50k-75k, 0.2% for AGIs $75k-100k, 0.8% for AGIs over 100k)
Taxable dividends: $932 (reported on 11.3% of returns)
Here:
$932
State:
$3,782
(% of AGI for various income ranges: 3.5% for AGIs below $10k, 0.1% for AGIs $10k-25k, 0.2% for AGIs $25k-50k, 0.0% for AGIs $50k-75k, 0.9% for AGIs $75k-100k)
Net capital gain/loss: +$2,986 (reported on 11.0% of returns)
Here:
+$2,986
State:
+$17,882
(% of AGI for various income ranges: -1.0% for AGIs below $10k, 0.6% for AGIs $25k-50k, -0.1% for AGIs $50k-75k, 6.6% for AGIs $75k-100k)
Profit/loss from business: +$1,892 (reported on 14.2% of returns)
Here:
+$1,892
State:
+$11,247
(% of AGI for various income ranges: 10.4% for AGIs below $10k, 3.6% for AGIs $10k-25k, 0.6% for AGIs $25k-50k, -0.9% for AGIs $50k-75k)
Total itemized deductions: $15,764 (26% of AGI, reported on 26.6% of returns)
Here:
$15,764
State:
$20,560
Here:
26.0% of AGI
State:
21.4% of AGI
(% of AGI for various income ranges: 9.6% for AGIs $10k-25k, 14.2% for AGIs $25k-50k, 14.3% for AGIs $50k-75k, 14.4% for AGIs $75k-100k, 11.1% for AGIs over 100k)
Charity contributions deductions: $1,788 (3% of AGI, reported on 20.2% of returns)
Here:
$1,788
State:
$3,518
Here:
2.8% of AGI
State:
3.4% of AGI
(% of AGI for various income ranges: 0.9% for AGIs $10k-25k, 1.0% for AGIs $25k-50k, 1.1% for AGIs $50k-75k, 0.7% for AGIs $75k-100k, 1.8% for AGIs over 100k)
Total tax: $4,232 (reported on 67.0% of returns)
81022:
$4,232
State:
$9,173
(% of AGI for various income ranges: 3.1% for AGIs below $10k, 3.4% for AGIs $10k-25k, 5.4% for AGIs $25k-50k, 7.8% for AGIs $50k-75k, 10.1% for AGIs $75k-100k, 17.9% for AGIs over 100k)
Earned income credit: $1,609 (reported on 23.8% of returns)
Here:
$1,609
State:
$1,595
Percentage of individuals using paid preparers for their 2004 taxes: 64.7%
Here:
65%
State:
55%
(% for various income ranges: 60.1% for AGIs below $10k, 62.0% for AGIs $10k-25k, 72.1% for AGIs $25k-50k, 62.5% for AGIs $50k-75k, 59.4% for AGIs $75k-100k, 68.0% for AGIs over 100k)
Household received Food Stamps/SNAP in the past 12 months: 45 Household did not receive Food Stamps/SNAP in the past 12 months: 567
Women who had a birth in the past 12 months: 5 (0 now married, 4 unmarried) Women who did not have a birth in the past 12 months: 394 (131 now married, 264 unmarried)
Housing units in zip code 81022 with a mortgage: 264 (13 second mortgage, 7 both second mortgage and home equity loan) Median monthly owner costs for units with a mortgage: $1,367 Median monthly owner costs for units without a mortgage: $339
Residents with income below the poverty level in 2022:
This zip code:
16.2%
Whole state:
9.4%
Residents with income below 50% of the poverty level in 2022:
This zip code:
9.2%
Whole state:
4.6%
Median number of rooms in houses and condos:
Here:
5.9
State:
6.8
Median number of rooms in apartments:
Here:
4.0
State:
4.0
Notable locations in this zip code not listed on our city pages
Notable locations in zip code 81022: Butler Ranch (A), East Cox Windmill (B), Gallegos Windmill (C), Hog Ranch (D), Finn Windmill (E), Lower Doyle Windmill (F), Big Flat Windmill (G), Upper Doyle Windmill (H), Jack Windmill (I), Broadacre Landfill (J), Poleline Camp (K), Blake Ranch (L), Undercliffe Community Center (M), Pueblo Rural Fire Protection District Station 3 (N). Display/hide their locations on the map
Lakes and reservoirs: Dry Lake (A), Karrick Lake (B), Lodge Lake (C), Dotson and Enlargement Reservoir (D), Dotson Reservoir (E), Peterson Reservoir (F), Nepesta Reservoir Number 5 (G), Huerfano Lake (H). Display/hide their locations on the map
Streams, rivers, and creeks: South Chicosa Creek (A), Edson Arroyo (B), Thomkins Arroyo (C), Fourmile Creek (D), Goat Butte Creek (E), Cucharas River (F), Doyle Arroyo (G). Display/hide their locations on the map
Size of family households: 114 2-persons, 104 3-persons, 57 4-persons, 72 5-persons, 22 7-or-more-persons
Size of nonfamily households: 183 1-person, 54 2-persons
174 married couples with children.
93 single-parent households (67 men, 26 women).
84.3% of residents of 81022 zip code speak English at home.
14.3% of residents speak Spanish at home (42% very well, 38% well, 20% not well).
2.0% of residents speak other Indo-European language at home (100% very well).
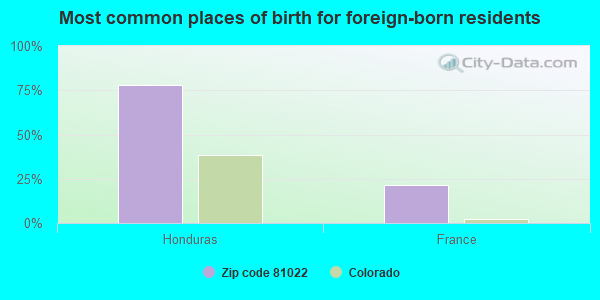
Foreign born population: 128 (8.0%) (0.0% of them are naturalized citizens)
:
8.0%
Whole state:
9.5%
78%Honduras
21%France
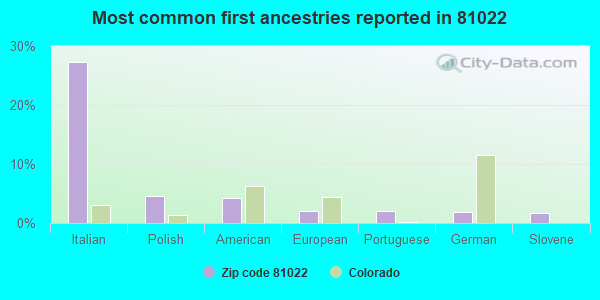
27%Italian
5%Polish
4%American
2%European
2%Portuguese
2%German
2%Slovene
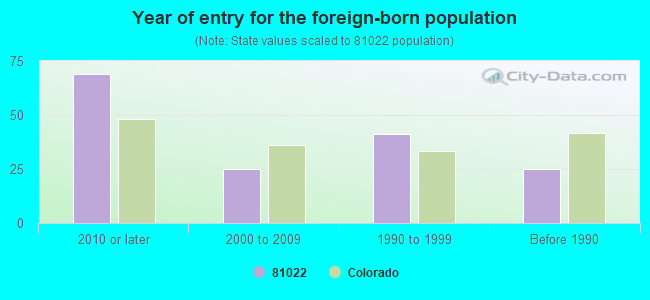
Year of entry for the foreign-born population
692010 or later
252000 to 2009
411990 to 1999
25Before 1990
Facilities with environmental interests located in this zip code:
AVONDALE ELEMENTARY SCHOOL (213 HIGHWAY 50 EAST in AVONDALE, CO)
(National Center for Education Statistics) - STATE ID-0472 Organizations: PUEBLO COUNTY RURAL 70 (SCHOOL DISTRICT)
ALPINE AGGREGATE INC. (1423 GRANT ROAD in AVONDALE, CO)
AIR MINOR (AIRS/AFS) CRITERIA AND HAZARDOUS AIR POLLUTANT INVENTORY (Inventory of air pollution sources) Business SIC classification: CONSTRUCTION SAND AND GRAVEL
AVONDALE WATER AND SANITATION DISTRICT (321 3RD in AVONDALE, CO)
National Pollutant Discharge Elimination System NON-MAJOR (Tracking pollutant discharge elimination systems) - permit Business SIC classification: SEWERAGE SYSTEMS Alternative names: AVONDALE & FORT REYNOLDS WWTPS, AVONDALE WATER & SAN DISTRICT
BROADACRE LANDFILL (4025 DOYLE RD in AVONDALE, CO)
CRITERIA AND HAZARDOUS AIR POLLUTANT INVENTORY (Inventory of air pollution sources) Conditionally Exempt Small Quantity Generators, less than 100 kg/month of hazardous waste (Resource Conservation and Recovery Act (tracking hazardous waste)) - notification Business SIC classification: REFUSE SYSTEMS Business NAICS classification: SOLID WASTE LANDFILL. Organizations: MID-AMERICAN WASTE SYSTEMS INC (CONTACT/OWNER)
JOHN CULLEN ROCK CRUSHING (3 MI W ON HWY 50 & GRANT RD in AVONDALE, CO)
AIR MINOR (AIRS/AFS) Business SIC classification: CONSTRUCTION SAND AND GRAVEL Alternative names: JOHN CULLEN ROCK CRUSHING & GRAVEL
Housing units lacking complete plumbing facilities: 4.3% Housing units lacking complete kitchen facilities: 4.5%
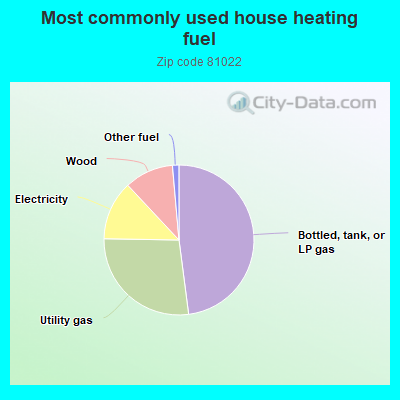
48.1%Bottled, tank, or LP gas
27.4%Utility gas
12.8%Electricity
10.6%Wood
1.4%Other fuel
Population in 1990: 1,483. Population change in the 1990s: +102 (+6.9%).
Place of birth for U.S.-born residents:
This state: 1,004
Northeast: 7
Midwest: 152
South: 133
West: 155
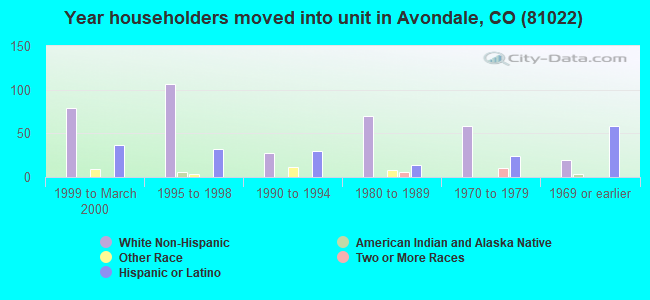
56% of the 81022 zip code residents lived in the same house 5 years ago. Out of people who lived in different houses, 76% lived in this county. Out of people who lived in different counties, 50% lived in Colorado.
99% of the 81022 zip code residents lived in the same house 1 year ago. Out of people who lived in different houses, 83% moved from different state. Out of people who lived in different houses, 133% moved from abroad.
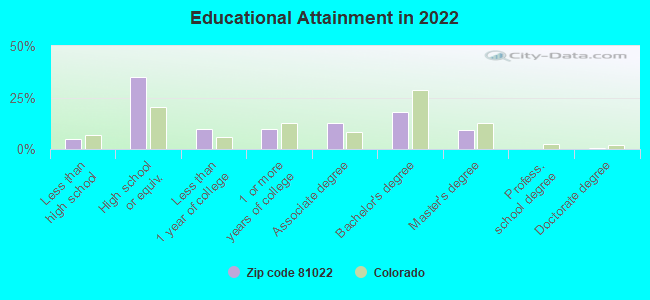
Private vs. public school enrollment:
Students in private schools in grades 1 to 8 (elementary and middle school): 47
Here:
44.8%
Colorado:
11.4%
Students in private schools in grades 9 to 12 (high school):
Here:
0.0%
Colorado:
8.5%
Students in private undergraduate colleges:
Here:
0.0%
Colorado:
14.0%
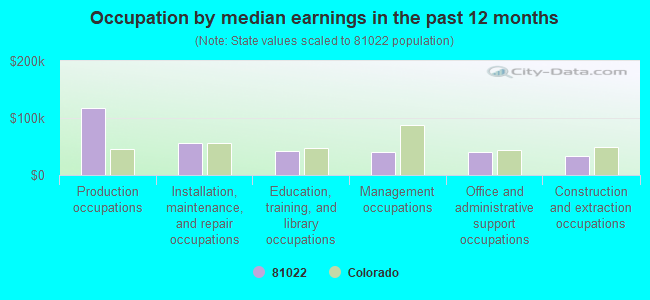
Occupation by median earnings in the past 12 months ($)
116,766Production occupations
56,750Installation, maintenance, and repair occupations
42,791Education, training, and library occupations
41,139Management occupations
39,831Office and administrative support occupations
32,465Construction and extraction occupations
Top industries in this zip code by the number of employees in 2005:
Management of Companies and Enterprises: Corporate, Subsidiary, and Regional Managing Offices (100-249 employees: 1 establishment)
Wholesale Trade: General Line Grocery Merchant Wholesalers (5-9: 1)
Construction: Drywall and Insulation Contractors (5-9: 1)
Administrative and Support and Waste Management and Remediation Services: Office Administrative Services (5-9: 1)
Other Services (except Public Administration): Religious Organizations (1-4: 1)
Wholesale Trade: Metal Service Centers and Other Metal Merchant Wholesalers (1-4: 1)
Construction: All Other Specialty Trade Contractors (1-4: 1)
Fatal accident statistics in 2011:
Fatal accident count: 1
Vehicles involved in fatal accidents: 1
Fatal accidents caused by drunken drivers: 1
Fatalities: 1
Persons involved in fatal accidents: 1
Pedestrians involved in fatal accidents: 0
Fatal accident statistics in 2010:
Fatal accident count: 1
Vehicles involved in fatal accidents: 1
Fatal accidents caused by drunken drivers: 0
Fatalities: 1
Persons involved in fatal accidents: 1
Pedestrians involved in fatal accidents: 0
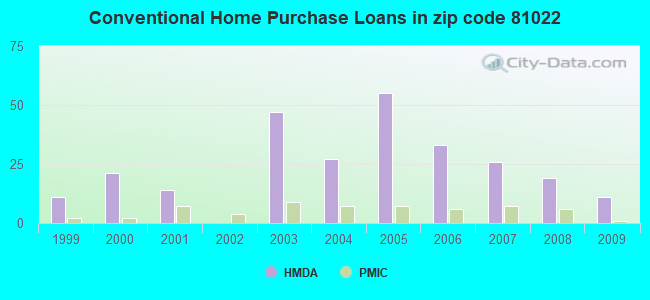
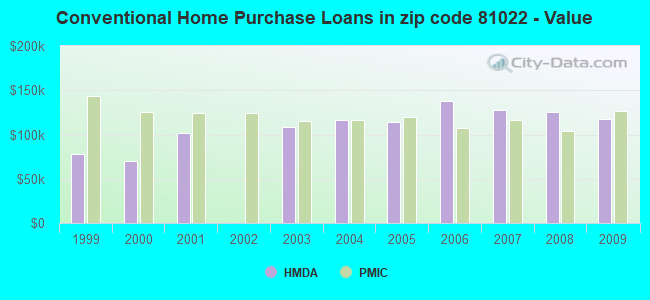
Home Mortgage Disclosure Act Aggregated Statistics For Year 2009 (Based on 4 partial tracts)
A) FHA, FSA/RHS & VA Home Purchase Loans
B) Conventional Home Purchase Loans
C) Refinancings
D) Home Improvement Loans
F) Non-occupant Loans on < 5 Family Dwellings (A B C & D)
G) Loans On Manufactured Home Dwelling (A B C & D)
Number
Average Value
Number
Average Value
Number
Average Value
Number
Average Value
Number
Average Value
Number
Average Value
LOANS ORIGINATED
13
$110,593
11
$117,216
68
$149,365
4
$49,428
7
$128,206
14
$106,243
APPLICATIONS APPROVED, NOT ACCEPTED
2
$152,920
1
$311,340
13
$160,490
0
$0
0
$0
2
$122,685
APPLICATIONS DENIED
6
$127,187
6
$133,000
32
$130,048
6
$33,677
1
$63,340
7
$83,197
APPLICATIONS WITHDRAWN
1
$110,150
0
$0
18
$130,239
0
$0
1
$140,620
0
$0
FILES CLOSED FOR INCOMPLETENESS
0
$0
0
$0
6
$121,018
1
$23,440
0
$0
1
$23,440
Aggregated Statistics For Year 2008 (Based on 4 partial tracts)
A) FHA, FSA/RHS & VA Home Purchase Loans
B) Conventional Home Purchase Loans
C) Refinancings
D) Home Improvement Loans
F) Non-occupant Loans on < 5 Family Dwellings (A B C & D)
G) Loans On Manufactured Home Dwelling (A B C & D)
Number
Average Value
Number
Average Value
Number
Average Value
Number
Average Value
Number
Average Value
Number
Average Value
LOANS ORIGINATED
20
$141,183
19
$125,485
46
$148,042
9
$28,132
7
$108,237
18
$103,166
APPLICATIONS APPROVED, NOT ACCEPTED
2
$87,495
1
$112,340
9
$106,097
0
$0
4
$47,750
4
$96,088
APPLICATIONS DENIED
8
$119,482
6
$99,263
49
$132,873
12
$33,352
2
$10,970
6
$98,818
APPLICATIONS WITHDRAWN
2
$147,995
2
$213,270
9
$144,183
2
$12,890
1
$117,180
0
$0
FILES CLOSED FOR INCOMPLETENESS
1
$97,260
0
$0
1
$66,790
0
$0
0
$0
0
$0
Aggregated Statistics For Year 2007 (Based on 4 partial tracts)
A) FHA, FSA/RHS & VA Home Purchase Loans
B) Conventional Home Purchase Loans
C) Refinancings
D) Home Improvement Loans
F) Non-occupant Loans on < 5 Family Dwellings (A B C & D)
G) Loans On Manufactured Home Dwelling (A B C & D)
Number
Average Value
Number
Average Value
Number
Average Value
Number
Average Value
Number
Average Value
Number
Average Value
LOANS ORIGINATED
11
$113,665
26
$127,563
65
$128,964
13
$37,555
8
$105,091
15
$102,903
APPLICATIONS APPROVED, NOT ACCEPTED
0
$0
8
$127,580
11
$68,419
1
$78,740
1
$91,630
6
$94,330
APPLICATIONS DENIED
4
$119,818
16
$99,662
61
$145,180
9
$42,928
0
$0
15
$110,757
APPLICATIONS WITHDRAWN
0
$0
2
$176,245
26
$151,295
6
$59,777
2
$91,630
4
$82,265
FILES CLOSED FOR INCOMPLETENESS
0
$0
0
$0
4
$169,025
0
$0
1
$108,980
0
$0
Aggregated Statistics For Year 2006 (Based on 4 partial tracts)
A) FHA, FSA/RHS & VA Home Purchase Loans
B) Conventional Home Purchase Loans
C) Refinancings
D) Home Improvement Loans
F) Non-occupant Loans on < 5 Family Dwellings (A B C & D)
G) Loans On Manufactured Home Dwelling (A B C & D)
Number
Average Value
Number
Average Value
Number
Average Value
Number
Average Value
Number
Average Value
Number
Average Value
LOANS ORIGINATED
6
$88,805
33
$137,302
49
$122,550
14
$40,381
4
$51,365
11
$79,232
APPLICATIONS APPROVED, NOT ACCEPTED
0
$0
12
$119,502
24
$117,900
7
$39,506
1
$76,170
2
$52,730
APPLICATIONS DENIED
2
$125,650
23
$121,623
100
$142,352
20
$69,558
13
$81,747
9
$104,343
APPLICATIONS WITHDRAWN
5
$100,540
14
$90,771
40
$123,427
5
$55,778
4
$66,792
7
$76,000
FILES CLOSED FOR INCOMPLETENESS
0
$0
1
$93,740
15
$108,404
0
$0
0
$0
0
$0
Aggregated Statistics For Year 2005 (Based on 4 partial tracts)
A) FHA, FSA/RHS & VA Home Purchase Loans
B) Conventional Home Purchase Loans
C) Refinancings
D) Home Improvement Loans
F) Non-occupant Loans on < 5 Family Dwellings (A B C & D)
G) Loans On Manufactured Home Dwelling (A B C & D)
Number
Average Value
Number
Average Value
Number
Average Value
Number
Average Value
Number
Average Value
Number
Average Value
LOANS ORIGINATED
4
$154,970
55
$113,758
67
$114,812
16
$63,970
4
$93,158
18
$95,827
APPLICATIONS APPROVED, NOT ACCEPTED
0
$0
5
$124,350
15
$165,889
5
$55,778
1
$103,120
1
$78,910
APPLICATIONS DENIED
0
$0
26
$80,083
68
$145,443
19
$49,544
5
$69,136
11
$87,676
APPLICATIONS WITHDRAWN
0
$0
9
$147,622
32
$130,759
5
$165,754
2
$109,360
1
$153,640
FILES CLOSED FOR INCOMPLETENESS
0
$0
5
$63,746
18
$155,142
1
$57,420
0
$0
0
$0
Aggregated Statistics For Year 2004 (Based on 4 partial tracts)
A) FHA, FSA/RHS & VA Home Purchase Loans
B) Conventional Home Purchase Loans
C) Refinancings
D) Home Improvement Loans
F) Non-occupant Loans on < 5 Family Dwellings (A B C & D)
G) Loans On Manufactured Home Dwelling (A B C & D)
Number
Average Value
Number
Average Value
Number
Average Value
Number
Average Value
Number
Average Value
Number
Average Value
LOANS ORIGINATED
15
$109,047
27
$116,517
106
$112,476
13
$55,779
9
$103,761
23
$107,563
APPLICATIONS APPROVED, NOT ACCEPTED
2
$129,485
8
$102,782
33
$131,206
1
$153,510
4
$96,088
7
$95,250
APPLICATIONS DENIED
6
$110,540
22
$112,546
80
$130,105
12
$50,542
2
$117,490
20
$85,377
APPLICATIONS WITHDRAWN
0
$0
8
$147,061
32
$127,260
0
$0
1
$180,460
1
$37,500
FILES CLOSED FOR INCOMPLETENESS
0
$0
1
$114,840
6
$118,570
0
$0
0
$0
0
$0
Aggregated Statistics For Year 2003 (Based on 4 partial tracts)
A) FHA, FSA/RHS & VA Home Purchase Loans
B) Conventional Home Purchase Loans
C) Refinancings
D) Home Improvement Loans
E) Loans on Dwellings For 5+ Families
F) Non-occupant Loans on < 5 Family Dwellings (A B C & D)
Number
Average Value
Number
Average Value
Number
Average Value
Number
Average Value
Number
Average Value
Number
Average Value
LOANS ORIGINATED
8
$97,012
47
$108,451
173
$112,726
11
$12,189
1
$333,960
13
$93,983
APPLICATIONS APPROVED, NOT ACCEPTED
0
$0
5
$107,450
36
$123,801
4
$20,018
0
$0
5
$91,696
APPLICATIONS DENIED
2
$133,000
34
$104,941
99
$109,009
9
$16,397
0
$0
7
$106,131
APPLICATIONS WITHDRAWN
0
$0
7
$172,066
53
$126,106
7
$23,939
0
$0
4
$128,415
FILES CLOSED FOR INCOMPLETENESS
0
$0
2
$94,915
2
$148,845
0
$0
0
$0
0
$0
Aggregated Statistics For Year 2001 (Based on 4 partial tracts)
A) FHA, FSA/RHS & VA Home Purchase Loans
B) Conventional Home Purchase Loans
C) Refinancings
D) Home Improvement Loans
F) Non-occupant Loans on < 5 Family Dwellings (A B C & D)
Number
Average Value
Number
Average Value
Number
Average Value
Number
Average Value
Number
Average Value
LOANS ORIGINATED
1
$156,400
14
$102,070
48
$98,076
7
$13,403
2
$68,095
APPLICATIONS APPROVED, NOT ACCEPTED
0
$0
4
$28,582
5
$91,844
1
$5,860
0
$0
APPLICATIONS DENIED
2
$116,595
16
$72,416
27
$78,648
4
$16,190
2
$86,175
APPLICATIONS WITHDRAWN
0
$0
5
$89,638
32
$101,482
1
$23,440
2
$69,135
FILES CLOSED FOR INCOMPLETENESS
0
$0
2
$116,595
8
$100,816
0
$0
0
$0
Aggregated Statistics For Year 2000 (Based on 4 partial tracts)
A) FHA, FSA/RHS & VA Home Purchase Loans
B) Conventional Home Purchase Loans
C) Refinancings
D) Home Improvement Loans
F) Non-occupant Loans on < 5 Family Dwellings (A B C & D)
Number
Average Value
Number
Average Value
Number
Average Value
Number
Average Value
Number
Average Value
LOANS ORIGINATED
6
$118,352
21
$70,091
19
$72,418
4
$11,660
2
$3,230
APPLICATIONS APPROVED, NOT ACCEPTED
1
$134,760
7
$77,340
9
$104,388
2
$18,805
0
$0
APPLICATIONS DENIED
1
$139,440
15
$67,374
38
$82,121
7
$21,159
1
$140,620
APPLICATIONS WITHDRAWN
1
$54,780
5
$65,724
20
$91,112
0
$0
2
$70,895
FILES CLOSED FOR INCOMPLETENESS
0
$0
0
$0
2
$110,920
0
$0
0
$0
Aggregated Statistics For Year 1999 (Based on 3 partial tracts)
A) FHA, FSA/RHS & VA Home Purchase Loans
B) Conventional Home Purchase Loans
C) Refinancings
D) Home Improvement Loans
F) Non-occupant Loans on < 5 Family Dwellings (A B C & D)
Detailed PMIC statistics for the following Tracts:0032.00
, 0034.00
2004 - 2018 National Fire Incident Reporting System (NFIRS) incidents
Based on the data from the years 2004 - 2018 the average number of fires per year is 10. The highest number of fire incidents - 24 took place in 2004, and the least - 0 in 2006. The data has a declining trend.
When looking into fire subcategories, the most reports belonged to: Outside Fires (76.4%), and Structure Fires (10.4%).
Fire incident types reported to NFIRS in Zip Code 81022


 Nearest zip codes: 81006, 81001, 81004, 81003, 81039, 81025.


 Based on the data from the years 2004 - 2018 the average number of fires per year is 10. The highest number of fire incidents - 24 took place in 2004, and the least - 0 in 2006. The data has a declining trend.
 When looking into fire subcategories, the most reports belonged to: Outside Fires (76.4%), and Structure Fires (10.4%).