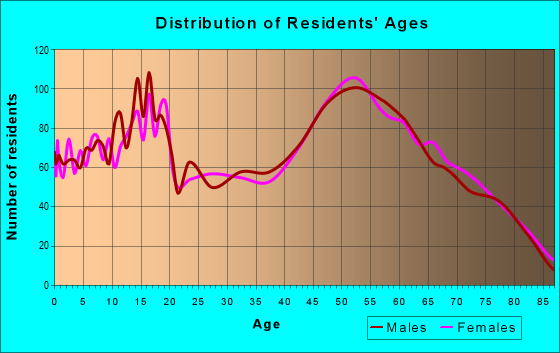
Estimated zip code population in 2022: 11,640 Zip code population in 2010: 11,513 Zip code population in 2000: 11,933
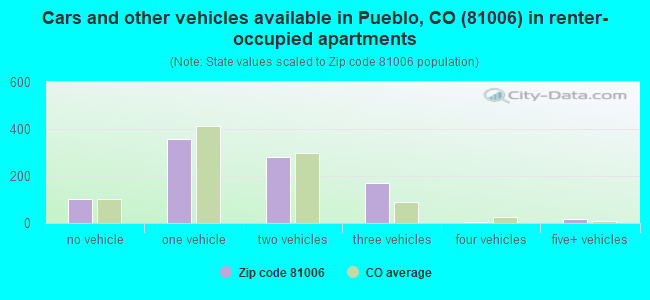
Houses and condos: 5,128 Renter-occupied apartments: 933
% of renters here:
20%
State:
34%
March 2022 cost of living index in zip code 81006: 93.9 (less than average, U.S. average is 100)
Land area: 56.6 sq. mi. Water area: 0.9 sq. mi.
Population density: 206 people per square mile
(very low).
OSM Map
General Map
Google Map
MSN Map
OSM Map
General Map
Google Map
MSN Map
OSM Map
General Map
Google Map
MSN Map
OSM Map
General Map
Google Map
MSN Map
Please wait while loading the map...
Real estate property taxes paid for housing units in 2022:
This zip code:
0.5% ($1,642)
Colorado:
0.5% ($2,422)
Median real estate property taxes paid for housing units with mortgages in 2022: $1,676 (0.5%) Median real estate property taxes paid for housing units with no mortgage in 2022: $1,627 (0.5%)
Averages for the 2020 tax year for zip code 81006, filed in 2021:
Average Adjusted Gross Income (AGI) in 2020: $66,045 (Individual Income Tax Returns)
Here:
$66,045
State:
$89,260
Salary/wage: $53,221 (reported on 78.5% of returns)
Here:
$53,221
State:
$70,330
(% of AGI for various income ranges: 1227.7% for AGIs below $25k, 3492.7% for AGIs $25k-50k, 5966.9% for AGIs $50k-75k, 9549.2% for AGIs $75k-100k, 16797.1% for AGIs $100k-200k, 61954.0% for AGIs over 200k)
Taxable interest for individuals: $1,405 (reported on 34.4% of returns)
This zip code:
$1,405
Colorado:
$2,176
(% of AGI for various income ranges: 22.3% for AGIs below $25k, 30.0% for AGIs $25k-50k, 50.3% for AGIs $50k-75k, 52.1% for AGIs $75k-100k, 85.8% for AGIs $100k-200k, 2380.0% for AGIs over 200k)
Ordinary dividends: $4,380 (reported on 15.8% of returns)
Here:
$4,380
State:
$8,820
(% of AGI for various income ranges: 22.0% for AGIs below $25k, 22.8% for AGIs $25k-50k, 73.1% for AGIs $50k-75k, 77.4% for AGIs $75k-100k, 219.6% for AGIs $100k-200k, 3188.0% for AGIs over 200k)
Net capital gain/loss in AGI: +$15,948 (reported on 14.0% of returns)
Here:
+$15,948
State:
+$37,276
(% of AGI for various income ranges: 14.8% for AGIs below $25k, 13.8% for AGIs $25k-50k, 70.2% for AGIs $50k-75k, 181.8% for AGIs $75k-100k, 797.6% for AGIs $100k-200k, 14526.0% for AGIs over 200k)
Profit/loss from business: +$12,052 (reported on 14.4% of returns)
Here:
+$12,052
State:
+$15,295
(% of AGI for various income ranges: 87.7% for AGIs below $25k, 141.0% for AGIs $25k-50k, 209.7% for AGIs $50k-75k, 175.0% for AGIs $75k-100k, 353.6% for AGIs $100k-200k, 6968.0% for AGIs over 200k)
Taxable individual retirement arrangement distribution: $14,717 (reported on 9.6% of returns)
81006:
$14,717
Colorado:
$23,785
(% of AGI for various income ranges: 45.6% for AGIs below $25k, 82.5% for AGIs $25k-50k, 231.5% for AGIs $50k-75k, 349.2% for AGIs $75k-100k, 618.7% for AGIs $100k-200k, 1804.0% for AGIs over 200k)
Total itemized deductions: $29,862 (reported on 4.7% of returns)
Here:
$29,862
State:
$35,141
(% of AGI for various income ranges: 115.5% for AGIs $25k-50k, 196.6% for AGIs $50k-75k, 299.7% for AGIs $75k-100k, 568.4% for AGIs $100k-200k, 3342.0% for AGIs over 200k)
Charity contributions: $7,089 (reported on 3.5% of returns)
Here:
$7,089
State:
$12,103
(% of AGI for various income ranges: 11.8% for AGIs $25k-50k, 16.6% for AGIs $50k-75k, 29.7% for AGIs $75k-100k, 113.6% for AGIs $100k-200k, 998.0% for AGIs over 200k)
Taxes paid: $6,219 (reported on 4.7% of returns)
81006:
$6,219
State:
$7,710
(% of AGI for various income ranges: 11.7% for AGIs $25k-50k, 37.5% for AGIs $50k-75k, 64.7% for AGIs $75k-100k, 130.9% for AGIs $100k-200k, 872.0% for AGIs over 200k)
Earned income credit: $2,182 (reported on 15.1% of returns)
Here:
$2,182
State:
$2,053
(% of AGI for various income ranges: 94.2% for AGIs below $25k, 65.3% for AGIs $25k-50k)
Percentage of individuals using paid preparers for their 2020 taxes: 93.5%
Here:
93%
State:
93%
(% for various income ranges: 92.9% for AGIs below $25k, 93.6% for AGIs $25k-50k, 92.9% for AGIs $50k-75k, 91.8% for AGIs $75k-100k, 95.0% for AGIs $100k-200k, 100.0% for AGIs over 200k)
Averages for the 2012 tax year for zip code 81006, filed in 2013:
Average Adjusted Gross Income (AGI) in 2012: $49,935 (Individual Income Tax Returns)
Here:
$49,935
State:
$69,103
Salary/wage: $42,073 (reported on 81.3% of returns)
Here:
$42,073
State:
$54,794
(% of AGI for various income ranges: 71.3% for AGIs below $25k, 70.6% for AGIs $25k-50k, 70.0% for AGIs $50k-75k, 72.9% for AGIs $75k-100k, 71.6% for AGIs $100k-200k, 44.0% for AGIs over 200k)
Taxable interest for individuals: $1,284 (reported on 38.2% of returns)
This zip code:
$1,284
Colorado:
$1,971
(% of AGI for various income ranges: 1.5% for AGIs below $25k, 1.2% for AGIs $25k-50k, 0.8% for AGIs $50k-75k, 0.8% for AGIs $75k-100k, 0.8% for AGIs $100k-200k, 1.3% for AGIs over 200k)
Ordinary dividends: $2,859 (reported on 18.1% of returns)
Here:
$2,859
State:
$7,140
(% of AGI for various income ranges: 0.9% for AGIs below $25k, 0.8% for AGIs $25k-50k, 0.5% for AGIs $50k-75k, 0.5% for AGIs $75k-100k, 1.0% for AGIs $100k-200k, 3.6% for AGIs over 200k)
Net capital gain/loss in AGI: +$4,342 (reported on 12.9% of returns)
Here:
+$4,342
State:
+$23,009
(% of AGI for various income ranges: 0.5% for AGIs $25k-50k, 0.4% for AGIs $50k-75k, 0.6% for AGIs $75k-100k, 1.5% for AGIs $100k-200k, 4.6% for AGIs over 200k)
Profit/loss from business: +$7,035 (reported on 14.1% of returns)
Here:
+$7,035
State:
+$13,514
(% of AGI for various income ranges: 6.8% for AGIs below $25k, 2.2% for AGIs $25k-50k, 2.0% for AGIs $50k-75k, 1.8% for AGIs $75k-100k, 1.0% for AGIs $100k-200k)
Taxable individual retirement arrangement distribution: $12,478 (reported on 10.2% of returns)
81006:
$12,478
Colorado:
$17,927
(% of AGI for various income ranges: 2.7% for AGIs below $25k, 2.6% for AGIs $25k-50k, 1.8% for AGIs $50k-75k, 2.2% for AGIs $75k-100k, 4.2% for AGIs $100k-200k)
Total itemized deductions: $18,476 (21% of AGI, reported on 28.5% of returns)
Here:
$18,476
State:
$24,621
Here:
20.9% of AGI
State:
18.5% of AGI
(% of AGI for various income ranges: 7.7% for AGIs below $25k, 9.2% for AGIs $25k-50k, 10.3% for AGIs $50k-75k, 11.5% for AGIs $75k-100k, 12.4% for AGIs $100k-200k, 9.8% for AGIs over 200k)
Charity contributions: $2,907 (reported on 21.7% of returns)
Here:
$2,907
State:
$4,449
(% of AGI for various income ranges: 0.7% for AGIs below $25k, 0.6% for AGIs $25k-50k, 1.1% for AGIs $50k-75k, 1.1% for AGIs $75k-100k, 1.9% for AGIs $100k-200k, 2.0% for AGIs over 200k)
Taxes paid: $5,421 (reported on 28.1% of returns)
81006:
$5,421
State:
$7,641
(% of AGI for various income ranges: 1.2% for AGIs below $25k, 1.7% for AGIs $25k-50k, 2.5% for AGIs $50k-75k, 3.1% for AGIs $75k-100k, 4.2% for AGIs $100k-200k, 5.2% for AGIs over 200k)
Earned income credit: $2,213 (reported on 18.9% of returns)
Here:
$2,213
State:
$2,095
(% of AGI for various income ranges: 6.7% for AGIs below $25k, 1.1% for AGIs $25k-50k)
Percentage of individuals using paid preparers for their 2012 taxes: 58.8%
Here:
59%
State:
49%
(% for various income ranges: 51.0% for AGIs below $25k, 59.7% for AGIs $25k-50k, 63.6% for AGIs $50k-75k, 64.7% for AGIs $75k-100k, 68.6% for AGIs $100k-200k, 100.0% for AGIs over 200k)
Averages for the 2004 tax year for zip code 81006, filed in 2005:
Average Adjusted Gross Income (AGI) in 2004: $40,373 (Individual Income Tax Returns)
Here:
$40,373
State:
$55,014
Salary/wage: $35,701 (reported on 82.1% of returns)
Here:
$35,701
State:
$46,010
(% of AGI for various income ranges: 123.2% for AGIs below $10k, 68.9% for AGIs $10k-25k, 78.5% for AGIs $25k-50k, 77.8% for AGIs $50k-75k, 78.1% for AGIs $75k-100k, 58.2% for AGIs over 100k)
Taxable interest for individuals: $1,485 (reported on 44.2% of returns)
This zip code:
$1,485
Colorado:
$2,127
(% of AGI for various income ranges: 6.2% for AGIs below $10k, 2.7% for AGIs $10k-25k, 1.6% for AGIs $25k-50k, 1.5% for AGIs $50k-75k, 1.1% for AGIs $75k-100k, 1.3% for AGIs over 100k)
Taxable dividends: $1,552 (reported on 21.6% of returns)
Here:
$1,552
State:
$3,782
(% of AGI for various income ranges: 2.7% for AGIs below $10k, 1.0% for AGIs $10k-25k, 0.5% for AGIs $25k-50k, 0.5% for AGIs $50k-75k, 0.6% for AGIs $75k-100k, 1.3% for AGIs over 100k)
Net capital gain/loss: +$6,005 (reported on 16.0% of returns)
Here:
+$6,005
State:
+$17,882
(% of AGI for various income ranges: -1.2% for AGIs below $10k, 0.6% for AGIs $10k-25k, 0.5% for AGIs $25k-50k, 1.2% for AGIs $50k-75k, 1.5% for AGIs $75k-100k, 6.3% for AGIs over 100k)
Profit/loss from business: +$6,760 (reported on 15.6% of returns)
Here:
+$6,760
State:
+$11,247
(% of AGI for various income ranges: 2.1% for AGIs below $10k, 5.0% for AGIs $10k-25k, 2.4% for AGIs $25k-50k, 2.6% for AGIs $50k-75k, 1.6% for AGIs $75k-100k, 2.5% for AGIs over 100k)
IRA payment deduction: $3,041 (reported on 2.8% of returns)
81006:
$3,041
Colorado:
$2,947
(% of AGI for various income ranges: 0.8% for AGIs below $10k, 0.1% for AGIs $10k-25k, 0.3% for AGIs $25k-50k, 0.2% for AGIs $50k-75k, 0.2% for AGIs $75k-100k, 0.2% for AGIs over 100k)
Self-employed pension: $8,500 (reported on 0.5% of returns)
Here:
$8,500
Colorado:
$13,653
Total itemized deductions: $16,148 (22% of AGI, reported on 31.4% of returns)
Here:
$16,148
State:
$20,560
Here:
21.8% of AGI
State:
21.4% of AGI
(% of AGI for various income ranges: 14.8% for AGIs below $10k, 9.4% for AGIs $10k-25k, 12.5% for AGIs $25k-50k, 14.5% for AGIs $50k-75k, 14.8% for AGIs $75k-100k, 10.8% for AGIs over 100k)
Charity contributions deductions: $2,069 (3% of AGI, reported on 26.7% of returns)
Here:
$2,069
State:
$3,518
Here:
2.6% of AGI
State:
3.4% of AGI
(% of AGI for various income ranges: 0.7% for AGIs below $10k, 0.7% for AGIs $10k-25k, 1.0% for AGIs $25k-50k, 1.4% for AGIs $50k-75k, 1.7% for AGIs $75k-100k, 1.7% for AGIs over 100k)
Total tax: $5,861 (reported on 72.4% of returns)
81006:
$5,861
State:
$9,173
(% of AGI for various income ranges: 3.4% for AGIs below $10k, 3.7% for AGIs $10k-25k, 6.2% for AGIs $25k-50k, 8.4% for AGIs $50k-75k, 10.3% for AGIs $75k-100k, 18.9% for AGIs over 100k)
Earned income credit: $1,598 (reported on 17.5% of returns)
Here:
$1,598
State:
$1,595
Percentage of individuals using paid preparers for their 2004 taxes: 65.3%
Here:
65%
State:
55%
(% for various income ranges: 57.4% for AGIs below $10k, 66.3% for AGIs $10k-25k, 65.1% for AGIs $25k-50k, 70.8% for AGIs $50k-75k, 69.3% for AGIs $75k-100k, 73.0% for AGIs over 100k)
Likely homosexual households (counted as self-reported same-sex unmarried-partner households)
Lesbian couples: 0.1% of all households
Gay men: 0.0% of all households
Household received Food Stamps/SNAP in the past 12 months: 662 Household did not receive Food Stamps/SNAP in the past 12 months: 4,133
Women who had a birth in the past 12 months: 28 (25 now married, 3 unmarried) Women who did not have a birth in the past 12 months: 2,365 (972 now married, 1,395 unmarried)
Housing units in zip code 81006 with a mortgage: 2,001 (241 second mortgage, 163 both second mortgage and home equity loan) Houses without a mortgage: 100
Median monthly owner costs for units with a mortgage: $1,653 Median monthly owner costs for units without a mortgage: $588
Residents with income below the poverty level in 2022:
This zip code:
12.9%
Whole state:
9.4%
Residents with income below 50% of the poverty level in 2022:
This zip code:
8.1%
Whole state:
4.6%
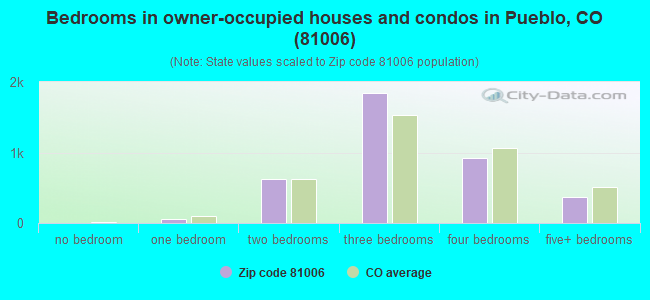
Median number of rooms in houses and condos:
Here:
6.7
State:
6.8
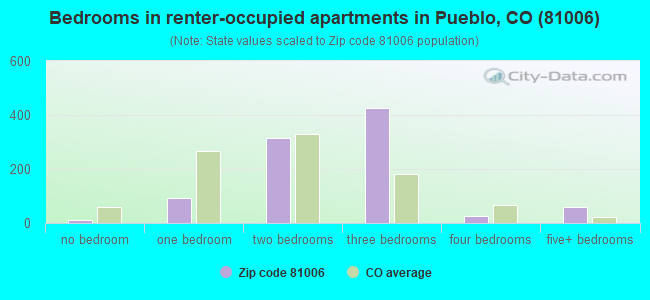
Median number of rooms in apartments:
Here:
5.2
State:
4.0
Notable locations in this zip code not listed on our city pages
Notable locations in zip code 81006: American Medical Response Pueblo (A), Pueblo Rural Fire Protection District Station 2 (B), Pueblo Rural Fire District Station 1 (C), Pueblo Rural Fire Protection District Station 4 (D). Display/hide their locations on the map
Reservoirs: Comanche Reservoir (A), Saint Charles Mesa Reservoir (B), North Mills Clarifying Pond (C), Saint Charles Mesa Reservoir Number 2 (D). Display/hide their locations on the map
In group quarters: 33 (-1 institutionalized population)
Size of family households: 1,614 2-persons, 664 3-persons, 702 4-persons, 201 5-persons, 28 6-persons, 20 7-or-more-persons
Size of nonfamily households: 1,258 1-person, 236 2-persons, 11 4-persons
1,206 married couples with children.
675 single-parent households (207 men, 468 women).
89.8% of residents of 81006 zip code speak English at home.
9.8% of residents speak Spanish at home (77% very well, 19% well, 5% not well).
0.6% of residents speak other Indo-European language at home (83% very well, 9% well, 8% not well).
0.4% of residents speak Asian or Pacific Island language at home (100% very well).
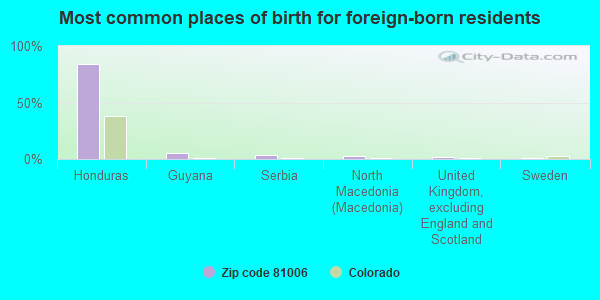
Foreign born population: 281 (2.4%) (32.2% of them are naturalized citizens)
This zip code:
2.4%
Whole state:
9.5%
85%Honduras
5%Guyana
3%Serbia
2%North Macedonia (Macedonia)
1%United Kingdom, excluding England and Scotland
1%Sweden
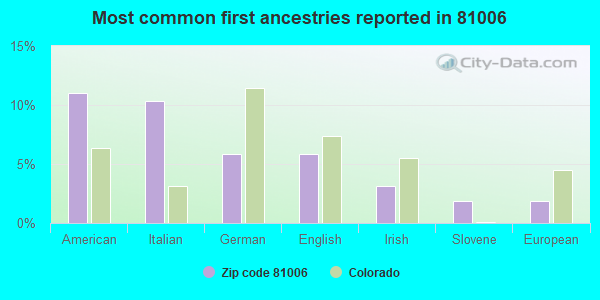
11%American
10%Italian
6%German
6%English
3%Irish
2%Slovene
2%European
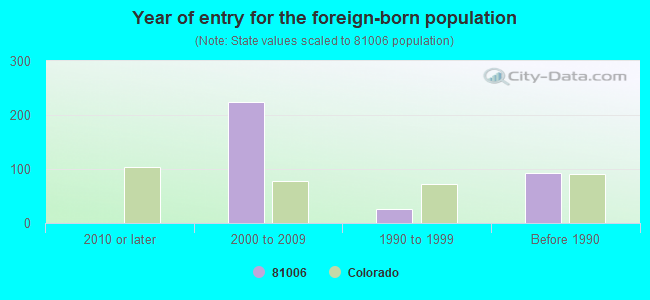
Year of entry for the foreign-born population
02010 or later
2242000 to 2009
261990 to 1999
93Before 1990
Major facilities with environmental interests located in this zip code:
AMERICAN FERTILIZER COMPANY INCORPORATED (35641 EAST US HIGHWAY 50 in PUEBLO, CO)
(Integrated Compliance Information System) - ICIS-08-1992-0533, FORMAL ENFORCEMENT ACTION, ICIS-08-1989-0203, COMPLIANCE ACTIVITY (Tracking inspections of insecticide, fungicide, and rodenticide, and toxic substances) (Resource Conservation and Recovery Act (tracking hazardous waste)) Business SIC classification: FARM SUPPLIES Business NAICS classification: OTHER ANIMAL FOOD MANUFACTURING.; FERTILIZER (MIXING ONLY) MANUFACTURING. Organizations: MICHAEL C. GENOVA (CONTACT/OWNER)
Alternative names: AMERICAN FERTILIZER & CHEMICAL
BROADACRE LANDFILL,INC (DOYLE AND BRUSH INTERSECTION in PUEBLO, CO)
AIR MAJOR (AIRS/AFS) STATE MASTER (Colorado database) - SWMS-101-LFL-035, REFUSE DISPOSAL Business SIC classification: REFUSE SYSTEMS
ALPINE AGGREGATE INC (1114 E NORTHERN AVE in PUEBLO, CO)
AIR MINOR (AIRS/AFS) Business SIC classification: CONSTRUCTION SAND AND GRAVEL; LUMBER AND OTHER BUILDING MATERIALS DEALERS
BLENDE PLZ CLNRS & LAUNDRY (1805 SANTA FE DR in PUEBLO, CO)
AIR MINOR (AIRS/AFS) CRITERIA AND HAZARDOUS AIR POLLUTANT INVENTORY (Inventory of air pollution sources) Conditionally Exempt Small Quantity Generators, less than 100 kg/month of hazardous waste (Resource Conservation and Recovery Act (tracking hazardous waste)) - notification Business SIC classification: DRYCLEANING PLANTS, EXCEPT RUG CLEANING Business NAICS classification: DRYCLEANING AND LAUNDRY SERVICES (EXCEPT COIN-OPERATED). Organizations: TED COOK (CONTACT/OWNER)
Alternative names: BLENDE PLAZA DRY CLEANERS
GENOVA BROTHERS (33RD LANE AND NICKOLSON ROAD in PUEBLO, CO)
National Pollutant Discharge Elimination System NON-MAJOR (Tracking pollutant discharge elimination systems) - permit National Pollutant Discharge Elimination System NON-MAJOR (Tracking pollutant discharge elimination systems) - permit Business SIC classification: BEEF CATTLE FEEDLOTS Alternative names: CARL GENOVA & JOE GENOVA
AIR PRODUCTS AND CHEMICALS INC (2100 S FREEWAY - OXYGEN PLANT in PUEBLO, CO)
AIR MINOR (AIRS/AFS) CRITERIA AND HAZARDOUS AIR POLLUTANT INVENTORY (Inventory of air pollution sources) Business SIC classification: CONSTRUCTION SAND AND GRAVEL
AMERICAN IRON & METAL CO INC (1100 OIL PL in PUEBLO, CO)
(Resource Conservation and Recovery Act (tracking hazardous waste)) Organizations: JIM & BERNADETTE WARREN (CONTACT/OWNER)
BOLD PETROLEUM INC (108 BAXTER ROAD in PUEBLO, CO)
AIR MINOR (AIRS/AFS) CRITERIA AND HAZARDOUS AIR POLLUTANT INVENTORY (Inventory of air pollution sources) Business SIC classification: GASOLINE SERVICE STATIONS
BURNING SYSTEMS, INC (27770 E US HIGHWAY 50 in PUEBLO, CO)
AIR MINOR (AIRS/AFS) CRITERIA AND HAZARDOUS AIR POLLUTANT INVENTORY (Inventory of air pollution sources) Business SIC classification: METAL HEAT TREATING
C.R. EVANS PIT (231 NYBERG ROAD in PUEBLO, CO)
AIR MINOR (AIRS/AFS) CRITERIA AND HAZARDOUS AIR POLLUTANT INVENTORY (Inventory of air pollution sources) Business SIC classification: CONSTRUCTION SAND AND GRAVEL Alternative names: LAFARGE - EVANS PIT
CHEMETRON RAILWAY PRODUCTS INC (2621 LIME ROAD in PUEBLO, CO)
AIR MINOR (AIRS/AFS) CRITERIA AND HAZARDOUS AIR POLLUTANT INVENTORY (Inventory of air pollution sources) Business SIC classification: RAILROAD EQUIPMENT Alternative names: PUEBLO RR SVC COMPANY
Housing units lacking complete plumbing facilities: 1.7% Housing units lacking complete kitchen facilities: 2.4%
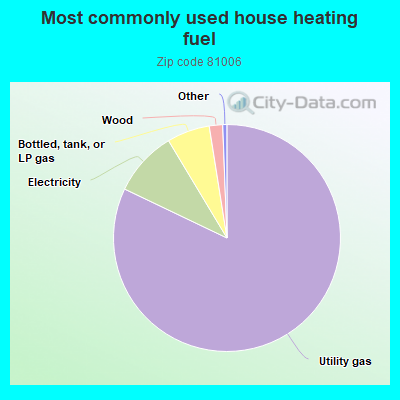
82.1%Utility gas
9.3%Electricity
6.1%Bottled, tank, or LP gas
1.9%Wood
Population in 1990: 12,277.
Place of birth for U.S.-born residents:
This state: 9,099
Northeast: 142
Midwest: 621
South: 596
West: 783
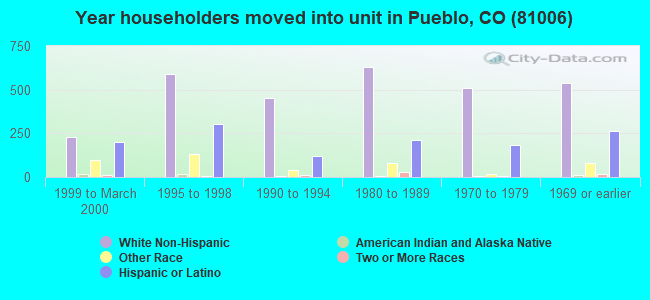
70% of the 81006 zip code residents lived in the same house 5 years ago. Out of people who lived in different houses, 71% lived in this county. Out of people who lived in different counties, 50% lived in Colorado.
93% of the 81006 zip code residents lived in the same house 1 year ago. Out of people who lived in different houses, 69% moved from this county. Out of people who lived in different houses, 29% moved from different county within same state. Out of people who lived in different houses, 5% moved from different state.
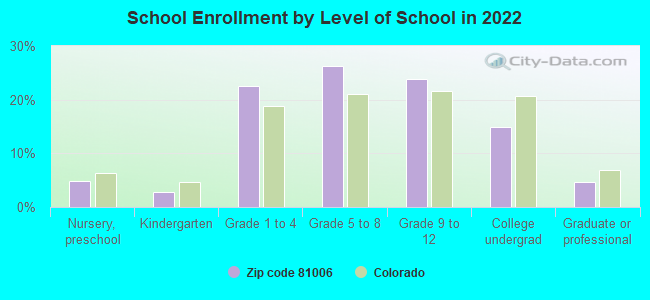
Private vs. public school enrollment:
Students in private schools in grades 1 to 8 (elementary and middle school): 62
Here:
5.5%
Colorado:
11.4%
Students in private schools in grades 9 to 12 (high school): 23
Here:
4.1%
Colorado:
8.5%
Students in private undergraduate colleges: 7
Here:
2.1%
Colorado:
14.0%
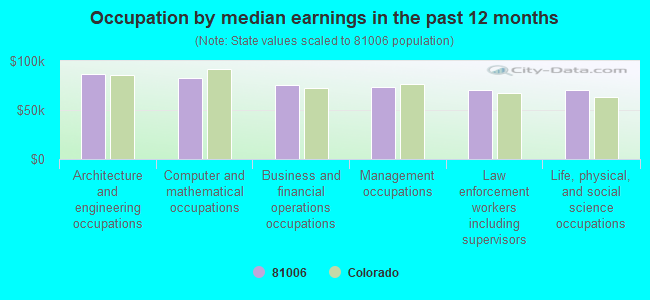
Occupation by median earnings in the past 12 months ($)
86,542Architecture and engineering occupations
82,794Computer and mathematical occupations
75,005Business and financial operations occupations
73,148Management occupations
70,567Law enforcement workers including supervisors
69,934Life, physical, and social science occupations
Companies with federal contracts located in this zip code:
SPACCAMONTI EXCAVATING INC (1805 ASPEN CIR in PUEBLO, CO; small business) : $269,015 in 4 contractsfrom 2000 to 2005
$170,000 with Soil Conservation Service (disused code) for Construction of Structures and Facilities -- Restoration of real property. Signed on 2000-06-15. Completion date: 2000-08-15.
$90,134 with Army for Construction of Structures and Facilities -- Highways, Roads, Streets, Bridges, and Railways (includes resurfacing). Signed on 2005-08-30. Completion date: 2005-09-21.
$6,152 with Army for Construction of Structures and Facilities -- Miscellaneous Buildings. Signed on 2004-02-19. Completion date: 2004-02-23.
$2,729 with Army for Construction of Structures and Facilities -- Highways, Roads, Streets, Bridges, and Railways (includes resurfacing). Signed on 2005-11-07. Completion date: 2005-12-26.
NORTH AMERICA LAFARGE INC (615 SANTA FE DR in PUEBLO, CO)
$19,875 with Army for Miscellaneous Construction Materials. Signed on 2002-02-14. Completion date: 2002-05-22.
PATTERSON PLUMBING & HEATING I (1010 ASPEN PL in PUEBLO, CO; small business)
$16,575 with Army for Maintenance, Repair or Alteration of Real Property -- Office Buildings. Signed on 2005-03-28. Completion date: 2005-05-02.
CHEM WAY, INC (1017 S SANTA FE AVE in PUEBLO, CO; small business) : $11,487 in 2 contractsfrom 2002 to 2003
$5,991 with Army for Land Treatment Practices Services (plowing/clearing, etc.). Signed on 2003-04-25. Completion date: 2003-05-30.
$5,496 with Army for Landscaping/Groundskeeping Services. Signed on 2002-05-14. Completion date: 2002-06-15.
Miketa's floor covering, inc. (1200 South Santa Fe. Ave. in Pueblo, CO; small business)
$2,632 with Forest Service for Maintenance, Repair or Alteration of Real Property -- Other Administrative Facilities and Service Buildings. Signed on 2006-02-17. Effective on 2006-03-06. Completion date: 2006-04-06.
Top industries in this zip code by the number of employees in 2005:
Utilities: Electric Power Distribution (100-249 employees: 1 establishment)
Health Care and Social Assistance: Other Residential Care Facilities (100-249: 1)
2004 - 2018 National Fire Incident Reporting System (NFIRS) incidents
Based on the data from the years 2004 - 2018 the average number of fire incidents per year is 85. The highest number of reported fire incidents - 160 took place in 2016, and the least - 12 in 2006. The data has a rising trend.
When looking into fire subcategories, the most incidents belonged to: Outside Fires (70.5%), and Structure Fires (17.9%).
Fire incident types reported to NFIRS in Zip Code 81006
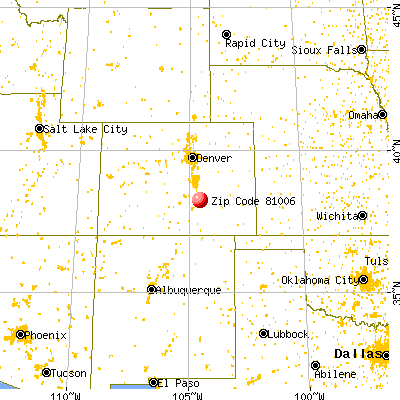


 Nearest zip codes: 81001, 81003, 81022, 81008, 81025, 81004.
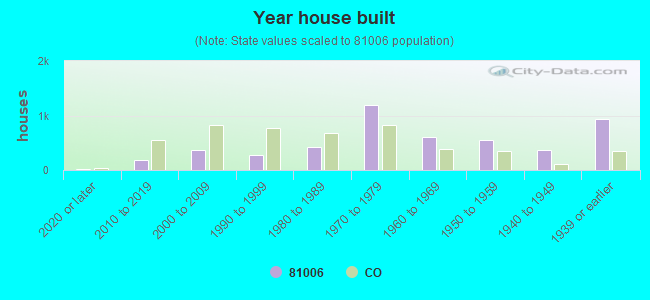


 Based on the data from the years 2004 - 2018 the average number of fire incidents per year is 85. The highest number of reported fire incidents - 160 took place in 2016, and the least - 12 in 2006. The data has a rising trend.
 When looking into fire subcategories, the most incidents belonged to: Outside Fires (70.5%), and Structure Fires (17.9%).