Pueblo, Colorado Submit your own pictures of this city and show them to the world
OSM Map
General Map
Google Map
MSN Map
OSM Map
General Map
Google Map
MSN Map
OSM Map
General Map
Google Map
MSN Map
OSM Map
General Map
Google Map
MSN Map
Please wait while loading the map...
Population in 2022: 111,456 (99% urban, 1% rural). Population change since 2000: +9.1%Males: 53,200 Females: 58,256
March 2022 cost of living index in Pueblo: 94.4 (less than average, U.S. average is 100) Percentage of residents living in poverty in 2022: 18.0%for White Non-Hispanic residents , 20.9% for Black residents , 21.2% for Hispanic or Latino residents , 35.5% for American Indian residents , 24.3% for other race residents , 18.8% for two or more races residents )
Profiles of local businesses
Business Search - 14 Million verified businesses
Data:
Median household income ($)
Median household income (% change since 2000)
Household income diversity
Ratio of average income to average house value (%)
Ratio of average income to average rent
Median household income ($) - White
Median household income ($) - Black or African American
Median household income ($) - Asian
Median household income ($) - Hispanic or Latino
Median household income ($) - American Indian and Alaska Native
Median household income ($) - Multirace
Median household income ($) - Other Race
Median household income for houses/condos with a mortgage ($)
Median household income for apartments without a mortgage ($)
Races - White alone (%)
Races - White alone (% change since 2000)
Races - Black alone (%)
Races - Black alone (% change since 2000)
Races - American Indian alone (%)
Races - American Indian alone (% change since 2000)
Races - Asian alone (%)
Races - Asian alone (% change since 2000)
Races - Hispanic (%)
Races - Hispanic (% change since 2000)
Races - Native Hawaiian and Other Pacific Islander alone (%)
Races - Native Hawaiian and Other Pacific Islander alone (% change since 2000)
Races - Two or more races (%)
Races - Two or more races (% change since 2000)
Races - Other race alone (%)
Races - Other race alone (% change since 2000)
Racial diversity
Unemployment (%)
Unemployment (% change since 2000)
Unemployment (%) - White
Unemployment (%) - Black or African American
Unemployment (%) - Asian
Unemployment (%) - Hispanic or Latino
Unemployment (%) - American Indian and Alaska Native
Unemployment (%) - Multirace
Unemployment (%) - Other Race
Population density (people per square mile)
Population - Males (%)
Population - Females (%)
Population - Males (%) - White
Population - Males (%) - Black or African American
Population - Males (%) - Asian
Population - Males (%) - Hispanic or Latino
Population - Males (%) - American Indian and Alaska Native
Population - Males (%) - Multirace
Population - Males (%) - Other Race
Population - Females (%) - White
Population - Females (%) - Black or African American
Population - Females (%) - Asian
Population - Females (%) - Hispanic or Latino
Population - Females (%) - American Indian and Alaska Native
Population - Females (%) - Multirace
Population - Females (%) - Other Race
Coronavirus confirmed cases (Apr 27, 2024)
Deaths caused by coronavirus (Apr 27, 2024)
Coronavirus confirmed cases (per 100k population) (Apr 27, 2024)
Deaths caused by coronavirus (per 100k population) (Apr 27, 2024)
Daily increase in number of cases (Apr 27, 2024)
Weekly increase in number of cases (Apr 27, 2024)
Cases doubled (in days) (Apr 27, 2024)
Hospitalized patients (Apr 18, 2022)
Negative test results (Apr 18, 2022)
Total test results (Apr 18, 2022)
COVID Vaccine doses distributed (per 100k population) (Sep 19, 2023)
COVID Vaccine doses administered (per 100k population) (Sep 19, 2023)
COVID Vaccine doses distributed (Sep 19, 2023)
COVID Vaccine doses administered (Sep 19, 2023)
Likely homosexual households (%)
Likely homosexual households (% change since 2000)
Likely homosexual households - Lesbian couples (%)
Likely homosexual households - Lesbian couples (% change since 2000)
Likely homosexual households - Gay men (%)
Likely homosexual households - Gay men (% change since 2000)
Cost of living index
Median gross rent ($)
Median contract rent ($)
Median monthly housing costs ($)
Median house or condo value ($)
Median house or condo value ($ change since 2000)
Mean house or condo value by units in structure - 1, detached ($)
Mean house or condo value by units in structure - 1, attached ($)
Mean house or condo value by units in structure - 2 ($)
Mean house or condo value by units in structure by units in structure - 3 or 4 ($)
Mean house or condo value by units in structure - 5 or more ($)
Mean house or condo value by units in structure - Boat, RV, van, etc. ($)
Mean house or condo value by units in structure - Mobile home ($)
Median house or condo value ($) - White
Median house or condo value ($) - Black or African American
Median house or condo value ($) - Asian
Median house or condo value ($) - Hispanic or Latino
Median house or condo value ($) - American Indian and Alaska Native
Median house or condo value ($) - Multirace
Median house or condo value ($) - Other Race
Median resident age
Resident age diversity
Median resident age - Males
Median resident age - Females
Median resident age - White
Median resident age - Black or African American
Median resident age - Asian
Median resident age - Hispanic or Latino
Median resident age - American Indian and Alaska Native
Median resident age - Multirace
Median resident age - Other Race
Median resident age - Males - White
Median resident age - Males - Black or African American
Median resident age - Males - Asian
Median resident age - Males - Hispanic or Latino
Median resident age - Males - American Indian and Alaska Native
Median resident age - Males - Multirace
Median resident age - Males - Other Race
Median resident age - Females - White
Median resident age - Females - Black or African American
Median resident age - Females - Asian
Median resident age - Females - Hispanic or Latino
Median resident age - Females - American Indian and Alaska Native
Median resident age - Females - Multirace
Median resident age - Females - Other Race
Commute - mean travel time to work (minutes)
Travel time to work - Less than 5 minutes (%)
Travel time to work - Less than 5 minutes (% change since 2000)
Travel time to work - 5 to 9 minutes (%)
Travel time to work - 5 to 9 minutes (% change since 2000)
Travel time to work - 10 to 19 minutes (%)
Travel time to work - 10 to 19 minutes (% change since 2000)
Travel time to work - 20 to 29 minutes (%)
Travel time to work - 20 to 29 minutes (% change since 2000)
Travel time to work - 30 to 39 minutes (%)
Travel time to work - 30 to 39 minutes (% change since 2000)
Travel time to work - 40 to 59 minutes (%)
Travel time to work - 40 to 59 minutes (% change since 2000)
Travel time to work - 60 to 89 minutes (%)
Travel time to work - 60 to 89 minutes (% change since 2000)
Travel time to work - 90 or more minutes (%)
Travel time to work - 90 or more minutes (% change since 2000)
Marital status - Never married (%)
Marital status - Now married (%)
Marital status - Separated (%)
Marital status - Widowed (%)
Marital status - Divorced (%)
Median family income ($)
Median family income (% change since 2000)
Median non-family income ($)
Median non-family income (% change since 2000)
Median per capita income ($)
Median per capita income (% change since 2000)
Median family income ($) - White
Median family income ($) - Black or African American
Median family income ($) - Asian
Median family income ($) - Hispanic or Latino
Median family income ($) - American Indian and Alaska Native
Median family income ($) - Multirace
Median family income ($) - Other Race
Median year house/condo built
Median year apartment built
Year house built - Built 2005 or later (%)
Year house built - Built 2000 to 2004 (%)
Year house built - Built 1990 to 1999 (%)
Year house built - Built 1980 to 1989 (%)
Year house built - Built 1970 to 1979 (%)
Year house built - Built 1960 to 1969 (%)
Year house built - Built 1950 to 1959 (%)
Year house built - Built 1940 to 1949 (%)
Year house built - Built 1939 or earlier (%)
Average household size
Household density (households per square mile)
Average household size - White
Average household size - Black or African American
Average household size - Asian
Average household size - Hispanic or Latino
Average household size - American Indian and Alaska Native
Average household size - Multirace
Average household size - Other Race
Occupied housing units (%)
Vacant housing units (%)
Owner occupied housing units (%)
Renter occupied housing units (%)
Vacancy status - For rent (%)
Vacancy status - For sale only (%)
Vacancy status - Rented or sold, not occupied (%)
Vacancy status - For seasonal, recreational, or occasional use (%)
Vacancy status - For migrant workers (%)
Vacancy status - Other vacant (%)
Residents with income below the poverty level (%)
Residents with income below 50% of the poverty level (%)
Children below poverty level (%)
Poor families by family type - Married-couple family (%)
Poor families by family type - Male, no wife present (%)
Poor families by family type - Female, no husband present (%)
Poverty status for native-born residents (%)
Poverty status for foreign-born residents (%)
Poverty among high school graduates not in families (%)
Poverty among people who did not graduate high school not in families (%)
Residents with income below the poverty level (%) - White
Residents with income below the poverty level (%) - Black or African American
Residents with income below the poverty level (%) - Asian
Residents with income below the poverty level (%) - Hispanic or Latino
Residents with income below the poverty level (%) - American Indian and Alaska Native
Residents with income below the poverty level (%) - Multirace
Residents with income below the poverty level (%) - Other Race
Air pollution - Air Quality Index (AQI)
Air pollution - CO
Air pollution - NO2
Air pollution - SO2
Air pollution - Ozone
Air pollution - PM10
Air pollution - PM25
Air pollution - Pb
Crime - Murders per 100,000 population
Crime - Rapes per 100,000 population
Crime - Robberies per 100,000 population
Crime - Assaults per 100,000 population
Crime - Burglaries per 100,000 population
Crime - Thefts per 100,000 population
Crime - Auto thefts per 100,000 population
Crime - Arson per 100,000 population
Crime - City-data.com crime index
Crime - Violent crime index
Crime - Property crime index
Crime - Murders per 100,000 population (5 year average)
Crime - Rapes per 100,000 population (5 year average)
Crime - Robberies per 100,000 population (5 year average)
Crime - Assaults per 100,000 population (5 year average)
Crime - Burglaries per 100,000 population (5 year average)
Crime - Thefts per 100,000 population (5 year average)
Crime - Auto thefts per 100,000 population (5 year average)
Crime - Arson per 100,000 population (5 year average)
Crime - City-data.com crime index (5 year average)
Crime - Violent crime index (5 year average)
Crime - Property crime index (5 year average)
1996 Presidential Elections Results (%) - Democratic Party (Clinton)
1996 Presidential Elections Results (%) - Republican Party (Dole)
1996 Presidential Elections Results (%) - Other
2000 Presidential Elections Results (%) - Democratic Party (Gore)
2000 Presidential Elections Results (%) - Republican Party (Bush)
2000 Presidential Elections Results (%) - Other
2004 Presidential Elections Results (%) - Democratic Party (Kerry)
2004 Presidential Elections Results (%) - Republican Party (Bush)
2004 Presidential Elections Results (%) - Other
2008 Presidential Elections Results (%) - Democratic Party (Obama)
2008 Presidential Elections Results (%) - Republican Party (McCain)
2008 Presidential Elections Results (%) - Other
2012 Presidential Elections Results (%) - Democratic Party (Obama)
2012 Presidential Elections Results (%) - Republican Party (Romney)
2012 Presidential Elections Results (%) - Other
2016 Presidential Elections Results (%) - Democratic Party (Clinton)
2016 Presidential Elections Results (%) - Republican Party (Trump)
2016 Presidential Elections Results (%) - Other
2020 Presidential Elections Results (%) - Democratic Party (Biden)
2020 Presidential Elections Results (%) - Republican Party (Trump)
2020 Presidential Elections Results (%) - Other
Ancestries Reported - Arab (%)
Ancestries Reported - Czech (%)
Ancestries Reported - Danish (%)
Ancestries Reported - Dutch (%)
Ancestries Reported - English (%)
Ancestries Reported - French (%)
Ancestries Reported - French Canadian (%)
Ancestries Reported - German (%)
Ancestries Reported - Greek (%)
Ancestries Reported - Hungarian (%)
Ancestries Reported - Irish (%)
Ancestries Reported - Italian (%)
Ancestries Reported - Lithuanian (%)
Ancestries Reported - Norwegian (%)
Ancestries Reported - Polish (%)
Ancestries Reported - Portuguese (%)
Ancestries Reported - Russian (%)
Ancestries Reported - Scotch-Irish (%)
Ancestries Reported - Scottish (%)
Ancestries Reported - Slovak (%)
Ancestries Reported - Subsaharan African (%)
Ancestries Reported - Swedish (%)
Ancestries Reported - Swiss (%)
Ancestries Reported - Ukrainian (%)
Ancestries Reported - United States (%)
Ancestries Reported - Welsh (%)
Ancestries Reported - West Indian (%)
Ancestries Reported - Other (%)
Educational Attainment - No schooling completed (%)
Educational Attainment - Less than high school (%)
Educational Attainment - High school or equivalent (%)
Educational Attainment - Less than 1 year of college (%)
Educational Attainment - 1 or more years of college (%)
Educational Attainment - Associate degree (%)
Educational Attainment - Bachelor's degree (%)
Educational Attainment - Master's degree (%)
Educational Attainment - Professional school degree (%)
Educational Attainment - Doctorate degree (%)
School Enrollment - Nursery, preschool (%)
School Enrollment - Kindergarten (%)
School Enrollment - Grade 1 to 4 (%)
School Enrollment - Grade 5 to 8 (%)
School Enrollment - Grade 9 to 12 (%)
School Enrollment - College undergrad (%)
School Enrollment - Graduate or professional (%)
School Enrollment - Not enrolled in school (%)
School enrollment - Public schools (%)
School enrollment - Private schools (%)
School enrollment - Not enrolled (%)
Median number of rooms in houses and condos
Median number of rooms in apartments
Housing units lacking complete plumbing facilities (%)
Housing units lacking complete kitchen facilities (%)
Density of houses
Urban houses (%)
Rural houses (%)
Households with people 60 years and over (%)
Households with people 65 years and over (%)
Households with people 75 years and over (%)
Households with one or more nonrelatives (%)
Households with no nonrelatives (%)
Population in households (%)
Family households (%)
Nonfamily households (%)
Population in families (%)
Family households with own children (%)
Median number of bedrooms in owner occupied houses
Mean number of bedrooms in owner occupied houses
Median number of bedrooms in renter occupied houses
Mean number of bedrooms in renter occupied houses
Median number of vehichles in owner occupied houses
Mean number of vehichles in owner occupied houses
Median number of vehichles in renter occupied houses
Mean number of vehichles in renter occupied houses
Mortgage status - with mortgage (%)
Mortgage status - with second mortgage (%)
Mortgage status - with home equity loan (%)
Mortgage status - with both second mortgage and home equity loan (%)
Mortgage status - without a mortgage (%)
Average family size
Average family size - White
Average family size - Black or African American
Average family size - Asian
Average family size - Hispanic or Latino
Average family size - American Indian and Alaska Native
Average family size - Multirace
Average family size - Other Race
Geographical mobility - Same house 1 year ago (%)
Geographical mobility - Moved within same county (%)
Geographical mobility - Moved from different county within same state (%)
Geographical mobility - Moved from different state (%)
Geographical mobility - Moved from abroad (%)
Place of birth - Born in state of residence (%)
Place of birth - Born in other state (%)
Place of birth - Native, outside of US (%)
Place of birth - Foreign born (%)
Housing units in structures - 1, detached (%)
Housing units in structures - 1, attached (%)
Housing units in structures - 2 (%)
Housing units in structures - 3 or 4 (%)
Housing units in structures - 5 to 9 (%)
Housing units in structures - 10 to 19 (%)
Housing units in structures - 20 to 49 (%)
Housing units in structures - 50 or more (%)
Housing units in structures - Mobile home (%)
Housing units in structures - Boat, RV, van, etc. (%)
House/condo owner moved in on average (years ago)
Renter moved in on average (years ago)
Year householder moved into unit - Moved in 1999 to March 2000 (%)
Year householder moved into unit - Moved in 1995 to 1998 (%)
Year householder moved into unit - Moved in 1990 to 1994 (%)
Year householder moved into unit - Moved in 1980 to 1989 (%)
Year householder moved into unit - Moved in 1970 to 1979 (%)
Year householder moved into unit - Moved in 1969 or earlier (%)
Means of transportation to work - Drove car alone (%)
Means of transportation to work - Carpooled (%)
Means of transportation to work - Public transportation (%)
Means of transportation to work - Bus or trolley bus (%)
Means of transportation to work - Streetcar or trolley car (%)
Means of transportation to work - Subway or elevated (%)
Means of transportation to work - Railroad (%)
Means of transportation to work - Ferryboat (%)
Means of transportation to work - Taxicab (%)
Means of transportation to work - Motorcycle (%)
Means of transportation to work - Bicycle (%)
Means of transportation to work - Walked (%)
Means of transportation to work - Other means (%)
Working at home (%)
Industry diversity
Most Common Industries - Agriculture, forestry, fishing and hunting, and mining (%)
Most Common Industries - Agriculture, forestry, fishing and hunting (%)
Most Common Industries - Mining, quarrying, and oil and gas extraction (%)
Most Common Industries - Construction (%)
Most Common Industries - Manufacturing (%)
Most Common Industries - Wholesale trade (%)
Most Common Industries - Retail trade (%)
Most Common Industries - Transportation and warehousing, and utilities (%)
Most Common Industries - Transportation and warehousing (%)
Most Common Industries - Utilities (%)
Most Common Industries - Information (%)
Most Common Industries - Finance and insurance, and real estate and rental and leasing (%)
Most Common Industries - Finance and insurance (%)
Most Common Industries - Real estate and rental and leasing (%)
Most Common Industries - Professional, scientific, and management, and administrative and waste management services (%)
Most Common Industries - Professional, scientific, and technical services (%)
Most Common Industries - Management of companies and enterprises (%)
Most Common Industries - Administrative and support and waste management services (%)
Most Common Industries - Educational services, and health care and social assistance (%)
Most Common Industries - Educational services (%)
Most Common Industries - Health care and social assistance (%)
Most Common Industries - Arts, entertainment, and recreation, and accommodation and food services (%)
Most Common Industries - Arts, entertainment, and recreation (%)
Most Common Industries - Accommodation and food services (%)
Most Common Industries - Other services, except public administration (%)
Most Common Industries - Public administration (%)
Occupation diversity
Most Common Occupations - Management, business, science, and arts occupations (%)
Most Common Occupations - Management, business, and financial occupations (%)
Most Common Occupations - Management occupations (%)
Most Common Occupations - Business and financial operations occupations (%)
Most Common Occupations - Computer, engineering, and science occupations (%)
Most Common Occupations - Computer and mathematical occupations (%)
Most Common Occupations - Architecture and engineering occupations (%)
Most Common Occupations - Life, physical, and social science occupations (%)
Most Common Occupations - Education, legal, community service, arts, and media occupations (%)
Most Common Occupations - Community and social service occupations (%)
Most Common Occupations - Legal occupations (%)
Most Common Occupations - Education, training, and library occupations (%)
Most Common Occupations - Arts, design, entertainment, sports, and media occupations (%)
Most Common Occupations - Healthcare practitioners and technical occupations (%)
Most Common Occupations - Health diagnosing and treating practitioners and other technical occupations (%)
Most Common Occupations - Health technologists and technicians (%)
Most Common Occupations - Service occupations (%)
Most Common Occupations - Healthcare support occupations (%)
Most Common Occupations - Protective service occupations (%)
Most Common Occupations - Fire fighting and prevention, and other protective service workers including supervisors (%)
Most Common Occupations - Law enforcement workers including supervisors (%)
Most Common Occupations - Food preparation and serving related occupations (%)
Most Common Occupations - Building and grounds cleaning and maintenance occupations (%)
Most Common Occupations - Personal care and service occupations (%)
Most Common Occupations - Sales and office occupations (%)
Most Common Occupations - Sales and related occupations (%)
Most Common Occupations - Office and administrative support occupations (%)
Most Common Occupations - Natural resources, construction, and maintenance occupations (%)
Most Common Occupations - Farming, fishing, and forestry occupations (%)
Most Common Occupations - Construction and extraction occupations (%)
Most Common Occupations - Installation, maintenance, and repair occupations (%)
Most Common Occupations - Production, transportation, and material moving occupations (%)
Most Common Occupations - Production occupations (%)
Most Common Occupations - Transportation occupations (%)
Most Common Occupations - Material moving occupations (%)
People in Group quarters - Institutionalized population (%)
People in Group quarters - Correctional institutions (%)
People in Group quarters - Federal prisons and detention centers (%)
People in Group quarters - Halfway houses (%)
People in Group quarters - Local jails and other confinement facilities (including police lockups) (%)
People in Group quarters - Military disciplinary barracks (%)
People in Group quarters - State prisons (%)
People in Group quarters - Other types of correctional institutions (%)
People in Group quarters - Nursing homes (%)
People in Group quarters - Hospitals/wards, hospices, and schools for the handicapped (%)
People in Group quarters - Hospitals/wards and hospices for chronically ill (%)
People in Group quarters - Hospices or homes for chronically ill (%)
People in Group quarters - Military hospitals or wards for chronically ill (%)
People in Group quarters - Other hospitals or wards for chronically ill (%)
People in Group quarters - Hospitals or wards for drug/alcohol abuse (%)
People in Group quarters - Mental (Psychiatric) hospitals or wards (%)
People in Group quarters - Schools, hospitals, or wards for the mentally retarded (%)
People in Group quarters - Schools, hospitals, or wards for the physically handicapped (%)
People in Group quarters - Institutions for the deaf (%)
People in Group quarters - Institutions for the blind (%)
People in Group quarters - Orthopedic wards and institutions for the physically handicapped (%)
People in Group quarters - Wards in general hospitals for patients who have no usual home elsewhere (%)
People in Group quarters - Wards in military hospitals for patients who have no usual home elsewhere (%)
People in Group quarters - Juvenile institutions (%)
People in Group quarters - Long-term care (%)
People in Group quarters - Homes for abused, dependent, and neglected children (%)
People in Group quarters - Residential treatment centers for emotionally disturbed children (%)
People in Group quarters - Training schools for juvenile delinquents (%)
People in Group quarters - Short-term care, detention or diagnostic centers for delinquent children (%)
People in Group quarters - Type of juvenile institution unknown (%)
People in Group quarters - Noninstitutionalized population (%)
People in Group quarters - College dormitories (includes college quarters off campus) (%)
People in Group quarters - Military quarters (%)
People in Group quarters - On base (%)
People in Group quarters - Barracks, unaccompanied personnel housing (UPH), (Enlisted/Officer), ;and similar group living quarters for military personnel (%)
People in Group quarters - Transient quarters for temporary residents (%)
People in Group quarters - Military ships (%)
People in Group quarters - Group homes (%)
People in Group quarters - Homes or halfway houses for drug/alcohol abuse (%)
People in Group quarters - Homes for the mentally ill (%)
People in Group quarters - Homes for the mentally retarded (%)
People in Group quarters - Homes for the physically handicapped (%)
People in Group quarters - Other group homes (%)
People in Group quarters - Religious group quarters (%)
People in Group quarters - Dormitories (%)
People in Group quarters - Agriculture workers' dormitories on farms (%)
People in Group quarters - Job Corps and vocational training facilities (%)
People in Group quarters - Other workers' dormitories (%)
People in Group quarters - Crews of maritime vessels (%)
People in Group quarters - Other nonhousehold living situations (%)
People in Group quarters - Other noninstitutional group quarters (%)
Residents speaking English at home (%)
Residents speaking English at home - Born in the United States (%)
Residents speaking English at home - Native, born elsewhere (%)
Residents speaking English at home - Foreign born (%)
Residents speaking Spanish at home (%)
Residents speaking Spanish at home - Born in the United States (%)
Residents speaking Spanish at home - Native, born elsewhere (%)
Residents speaking Spanish at home - Foreign born (%)
Residents speaking other language at home (%)
Residents speaking other language at home - Born in the United States (%)
Residents speaking other language at home - Native, born elsewhere (%)
Residents speaking other language at home - Foreign born (%)
Class of Workers - Employee of private company (%)
Class of Workers - Self-employed in own incorporated business (%)
Class of Workers - Private not-for-profit wage and salary workers (%)
Class of Workers - Local government workers (%)
Class of Workers - State government workers (%)
Class of Workers - Federal government workers (%)
Class of Workers - Self-employed workers in own not incorporated business and Unpaid family workers (%)
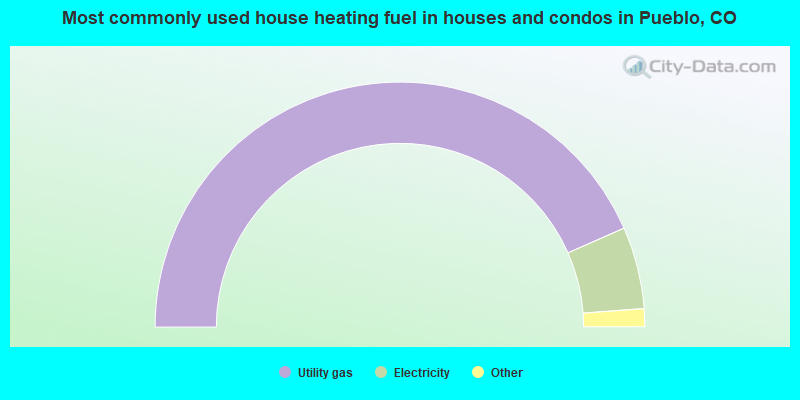
House heating fuel used in houses and condos - Utility gas (%)
House heating fuel used in houses and condos - Bottled, tank, or LP gas (%)
House heating fuel used in houses and condos - Electricity (%)
House heating fuel used in houses and condos - Fuel oil, kerosene, etc. (%)
House heating fuel used in houses and condos - Coal or coke (%)
House heating fuel used in houses and condos - Wood (%)
House heating fuel used in houses and condos - Solar energy (%)
House heating fuel used in houses and condos - Other fuel (%)
House heating fuel used in houses and condos - No fuel used (%)
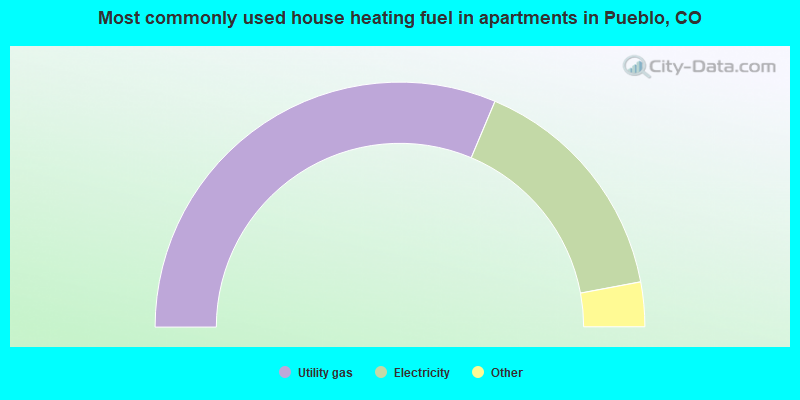
House heating fuel used in apartments - Utility gas (%)
House heating fuel used in apartments - Bottled, tank, or LP gas (%)
House heating fuel used in apartments - Electricity (%)
House heating fuel used in apartments - Fuel oil, kerosene, etc. (%)
House heating fuel used in apartments - Coal or coke (%)
House heating fuel used in apartments - Wood (%)
House heating fuel used in apartments - Solar energy (%)
House heating fuel used in apartments - Other fuel (%)
House heating fuel used in apartments - No fuel used (%)
Armed forces status - In Armed Forces (%)
Armed forces status - Civilian (%)
Armed forces status - Civilian - Veteran (%)
Armed forces status - Civilian - Nonveteran (%)
Fatal accidents locations in years 2005-2021
Fatal accidents locations in 2005
Fatal accidents locations in 2006
Fatal accidents locations in 2007
Fatal accidents locations in 2008
Fatal accidents locations in 2009
Fatal accidents locations in 2010
Fatal accidents locations in 2011
Fatal accidents locations in 2012
Fatal accidents locations in 2013
Fatal accidents locations in 2014
Fatal accidents locations in 2015
Fatal accidents locations in 2016
Fatal accidents locations in 2017
Fatal accidents locations in 2018
Fatal accidents locations in 2019
Fatal accidents locations in 2020
Fatal accidents locations in 2021
Alcohol use - People drinking some alcohol every month (%)
Alcohol use - People not drinking at all (%)
Alcohol use - Average days/month drinking alcohol
Alcohol use - Average drinks/week
Alcohol use - Average days/year people drink much
Audiometry - Average condition of hearing (%)
Audiometry - People that can hear a whisper from across a quiet room (%)
Audiometry - People that can hear normal voice from across a quiet room (%)
Audiometry - Ears ringing, roaring, buzzing (%)
Audiometry - Had a job exposure to loud noise (%)
Audiometry - Had off-work exposure to loud noise (%)
Blood Pressure & Cholesterol - Has high blood pressure (%)
Blood Pressure & Cholesterol - Checking blood pressure at home (%)
Blood Pressure & Cholesterol - Frequently checking blood cholesterol (%)
Blood Pressure & Cholesterol - Has high cholesterol level (%)
Consumer Behavior - Money monthly spent on food at supermarket/grocery store
Consumer Behavior - Money monthly spent on food at other stores
Consumer Behavior - Money monthly spent on eating out
Consumer Behavior - Money monthly spent on carryout/delivered foods
Consumer Behavior - Income spent on food at supermarket/grocery store (%)
Consumer Behavior - Income spent on food at other stores (%)
Consumer Behavior - Income spent on eating out (%)
Consumer Behavior - Income spent on carryout/delivered foods (%)
Current Health Status - General health condition (%)
Current Health Status - Blood donors (%)
Current Health Status - Has blood ever tested for HIV virus (%)
Current Health Status - Left-handed people (%)
Dermatology - People using sunscreen (%)
Diabetes - Diabetics (%)
Diabetes - Had a blood test for high blood sugar (%)
Diabetes - People taking insulin (%)
Diet Behavior & Nutrition - Diet health (%)
Diet Behavior & Nutrition - Milk product consumption (# of products/month)
Diet Behavior & Nutrition - Meals not home prepared (#/week)
Diet Behavior & Nutrition - Meals from fast food or pizza place (#/week)
Diet Behavior & Nutrition - Ready-to-eat foods (#/month)
Diet Behavior & Nutrition - Frozen meals/pizza (#/month)
Drug Use - People that ever used marijuana or hashish (%)
Drug Use - Ever used hard drugs (%)
Drug Use - Ever used any form of cocaine (%)
Drug Use - Ever used heroin (%)
Drug Use - Ever used methamphetamine (%)
Health Insurance - People covered by health insurance (%)
Kidney Conditions-Urology - Avg. # of times urinating at night
Medical Conditions - People with asthma (%)
Medical Conditions - People with anemia (%)
Medical Conditions - People with psoriasis (%)
Medical Conditions - People with overweight (%)
Medical Conditions - Elderly people having difficulties in thinking or remembering (%)
Medical Conditions - People who ever received blood transfusion (%)
Medical Conditions - People having trouble seeing even with glass/contacts (%)
Medical Conditions - People with arthritis (%)
Medical Conditions - People with gout (%)
Medical Conditions - People with congestive heart failure (%)
Medical Conditions - People with coronary heart disease (%)
Medical Conditions - People with angina pectoris (%)
Medical Conditions - People who ever had heart attack (%)
Medical Conditions - People who ever had stroke (%)
Medical Conditions - People with emphysema (%)
Medical Conditions - People with thyroid problem (%)
Medical Conditions - People with chronic bronchitis (%)
Medical Conditions - People with any liver condition (%)
Medical Conditions - People who ever had cancer or malignancy (%)
Mental Health - People who have little interest in doing things (%)
Mental Health - People feeling down, depressed, or hopeless (%)
Mental Health - People who have trouble sleeping or sleeping too much (%)
Mental Health - People feeling tired or having little energy (%)
Mental Health - People with poor appetite or overeating (%)
Mental Health - People feeling bad about themself (%)
Mental Health - People who have trouble concentrating on things (%)
Mental Health - People moving or speaking slowly or too fast (%)
Mental Health - People having thoughts they would be better off dead (%)
Oral Health - Average years since last visit a dentist
Oral Health - People embarrassed because of mouth (%)
Oral Health - People with gum disease (%)
Oral Health - General health of teeth and gums (%)
Oral Health - Average days a week using dental floss/device
Oral Health - Average days a week using mouthwash for dental problem
Oral Health - Average number of teeth
Pesticide Use - Households using pesticides to control insects (%)
Pesticide Use - Households using pesticides to kill weeds (%)
Physical Activity - People doing vigorous-intensity work activities (%)
Physical Activity - People doing moderate-intensity work activities (%)
Physical Activity - People walking or bicycling (%)
Physical Activity - People doing vigorous-intensity recreational activities (%)
Physical Activity - People doing moderate-intensity recreational activities (%)
Physical Activity - Average hours a day doing sedentary activities
Physical Activity - Average hours a day watching TV or videos
Physical Activity - Average hours a day using computer
Physical Functioning - People having limitations keeping them from working (%)
Physical Functioning - People limited in amount of work they can do (%)
Physical Functioning - People that need special equipment to walk (%)
Physical Functioning - People experiencing confusion/memory problems (%)
Physical Functioning - People requiring special healthcare equipment (%)
Prescription Medications - Average number of prescription medicines taking
Preventive Aspirin Use - Adults 40+ taking low-dose aspirin (%)
Reproductive Health - Vaginal deliveries (%)
Reproductive Health - Cesarean deliveries (%)
Reproductive Health - Deliveries resulted in a live birth (%)
Reproductive Health - Pregnancies resulted in a delivery (%)
Reproductive Health - Women breastfeeding newborns (%)
Reproductive Health - Women that had a hysterectomy (%)
Reproductive Health - Women that had both ovaries removed (%)
Reproductive Health - Women that have ever taken birth control pills (%)
Reproductive Health - Women taking birth control pills (%)
Reproductive Health - Women that have ever used Depo-Provera or injectables (%)
Reproductive Health - Women that have ever used female hormones (%)
Sexual Behavior - People 18+ that ever had sex (vaginal, anal, or oral) (%)
Sexual Behavior - Males 18+ that ever had vaginal sex with a woman (%)
Sexual Behavior - Males 18+ that ever performed oral sex on a woman (%)
Sexual Behavior - Males 18+ that ever had anal sex with a woman (%)
Sexual Behavior - Males 18+ that ever had any sex with a man (%)
Sexual Behavior - Females 18+ that ever had vaginal sex with a man (%)
Sexual Behavior - Females 18+ that ever performed oral sex on a man (%)
Sexual Behavior - Females 18+ that ever had anal sex with a man (%)
Sexual Behavior - Females 18+ that ever had any kind of sex with a woman (%)
Sexual Behavior - Average age people first had sex
Sexual Behavior - Average number of female sex partners in lifetime (males 18+)
Sexual Behavior - Average number of female vaginal sex partners in lifetime (males 18+)
Sexual Behavior - Average age people first performed oral sex on a woman (18+)
Sexual Behavior - Average number of woman performed oral sex on in lifetime (18+)
Sexual Behavior - Average number of male sex partners in lifetime (males 18+)
Sexual Behavior - Average number of male anal sex partners in lifetime (males 18+)
Sexual Behavior - Average age people first performed oral sex on a man (18+)
Sexual Behavior - Average number of male oral sex partners in lifetime (18+)
Sexual Behavior - People using protection when performing oral sex (%)
Sexual Behavior - Average number of times people have vaginal or anal sex a year
Sexual Behavior - People having sex without condom (%)
Sexual Behavior - Average number of male sex partners in lifetime (females 18+)
Sexual Behavior - Average number of male vaginal sex partners in lifetime (females 18+)
Sexual Behavior - Average number of female sex partners in lifetime (females 18+)
Sexual Behavior - Circumcised males 18+ (%)
Sleep Disorders - Average hours sleeping at night
Sleep Disorders - People that has trouble sleeping (%)
Smoking-Cigarette Use - People smoking cigarettes (%)
Taste & Smell - People 40+ having problems with smell (%)
Taste & Smell - People 40+ having problems with taste (%)
Taste & Smell - People 40+ that ever had wisdom teeth removed (%)
Taste & Smell - People 40+ that ever had tonsils teeth removed (%)
Taste & Smell - People 40+ that ever had a loss of consciousness because of a head injury (%)
Taste & Smell - People 40+ that ever had a broken nose or other serious injury to face or skull (%)
Taste & Smell - People 40+ that ever had two or more sinus infections (%)
Weight - Average height (inches)
Weight - Average weight (pounds)
Weight - Average BMI
Weight - People that are obese (%)
Weight - People that ever were obese (%)
Weight - People trying to lose weight (%)
56,122 50.4% Hispanic 47,742 42.8% White alone 2,985 2.7% Black alone 2,534 2.3% Two or more races 948 0.9% American Indian alone 609 0.5% Asian alone 375 0.3% Other race alone 134 0.1% Native Hawaiian and Other
The City-Data.com crime index weighs serious crimes and violent crimes more heavily. Higher means more crime, U.S. average is 246.1. It adjusts for the number of visitors and daily workers commuting into cities.
- means the value is smaller than the state average.
- means the value is about the same as the state average.
- means the value is bigger than the state average.
- means the value is much bigger than the state average.
Crime rate in Pueblo detailed stats: murders, rapes, robberies, assaults, burglaries, thefts, arson Officers per 1,000 residents here:
1.78Colorado average:
2.14
Latest news from Pueblo, CO collected exclusively by city-data.com from local newspapers, TV, and radio stations
Ancestries: German (7.3%), Italian (5.7%), American (4.7%), Irish (4.0%), English (4.0%), European (1.5%).
Current Local Time:
Incorporated on 11/15/1885
Land area: 45.1 square miles.
Population density: 2,473 people per square mile (low).
4,410 residents are foreign born (2.8% Latin America , 0.5% Asia , 0.5% Europe ).
This city:
3.9%Colorado:
9.5%
Median real estate property taxes paid for housing units with mortgages in 2022: $1,387 (0.5%)Median real estate property taxes paid for housing units with no mortgage in 2022: $944 (0.4%)
Nearest city with pop. 200,000+: Colorado Springs, CO
Nearest city with pop. 1,000,000+: Phoenix, AZ
Nearest cities:
Latitude: 38.27 N, Longitude: 104.62 W
Pueblo nicknames or aliases (official or unofficial):
Home of Heroes, Pride City, Steel City of the WestDaytime population change due to commuting: +9,018 (+8.1%)Workers who live and work in this city: 30,518 (70.4%)
Pueblo tourist attractions:
Unemployment in December 2023:
Population change in the 1990s: +3,111 (+3.1%).
Most common occupations in Pueblo, CO (%)
Both Males Females
Cooks and food preparation workers (9.5%)
Other management occupations, except farmers and farm managers (3.9%)
Customer service representatives (3.8%)
Building and grounds cleaning and maintenance occupations (3.7%)
Nursing, psychiatric, and home health aides (3.7%)
Cashiers (3.5%)
Supervisors and other personal care and service workers, except child care workers (2.8%)
Cooks and food preparation workers (9.4%)
Laborers and material movers, hand (4.5%)
Driver/sales workers and truck drivers (4.4%)
Other management occupations, except farmers and farm managers (4.1%)
Building and grounds cleaning and maintenance occupations (3.9%)
Metal workers and plastic workers (3.8%)
Electrical equipment mechanics and other installation, maintenance, and repair workers, including supervisors (3.3%)
Cooks and food preparation workers (9.6%)
Nursing, psychiatric, and home health aides (6.0%)
Customer service representatives (5.1%)
Cashiers (5.0%)
Secretaries and administrative assistants (4.8%)
Information and record clerks, except customer service representatives (4.3%)
Supervisors and other personal care and service workers, except child care workers (4.2%)
Air pollution and air quality trends(lower is better)
AQI Ozone Pb
Tornado activity:
Pueblo-area historical tornado activity is below Colorado state average. It is 60% smaller than the overall U.S. average.
On 8/21/1984, a category F2 (max. wind speeds 113-157 mph) tornado 1.6 miles away from the Pueblo city center caused between $500 and $5000 in damages.
On 6/24/1979, a category F3 (max. wind speeds 158-206 mph) tornado 40.6 miles away from the city center injured one person and caused between $50,000 and $500,000 in damages.
Earthquake activity:
Pueblo-area historical earthquake activity is significantly above Colorado state average. It is 707% greater than the overall U.S. average. On 8/18/1959 at 06:37:13, a magnitude 7.7 (7.7 UK, Class: Major, Intensity: VIII - XII) earthquake occurred 536.1 miles away from the city center, causing $26,000,000 total damage On 8/23/2011 at 05:46:18, a magnitude 5.3 (5.3 MW, Depth: 2.5 mi, Class: Moderate, Intensity: VI - VII) earthquake occurred 83.4 miles away from the city center On 8/10/2005 at 22:08:22, a magnitude 5.0 (5.0 MW, Depth: 3.1 mi) earthquake occurred 92.0 miles away from Pueblo center On 8/10/2005 at 22:08:22, a magnitude 5.0 (5.0 MB, 4.7 MS, 5.0 MW) earthquake occurred 93.5 miles away from Pueblo center On 8/22/2011 at 23:30:19, a magnitude 4.7 (4.7 MW, Depth: 3.1 mi, Class: Light, Intensity: IV - V) earthquake occurred 85.5 miles away from the city center On 9/5/2001 at 10:52:07, a magnitude 4.5 (4.5 MB, Depth: 3.1 mi) earthquake occurred 77.7 miles away from Pueblo center Magnitude types: body-wave magnitude (MB), surface-wave magnitude (MS), moment magnitude (MW) Natural disasters: The number of natural disasters in Pueblo County (14) is near the US average (15).Major Disasters (Presidential) Declared: 6Emergencies Declared: 6Floods: 5, Storms: 5, Landslides: 3, Mudslides: 3, Snows: 3, Fires: 2, Tornadoes: 2, Drought: 1, Flash Flood: 1, Heavy Rain: 1, Hurricane: 1, Snowstorm: 1, Other: 1 (Note: some incidents may be assigned to more than one category). Hospitals in Pueblo: CENTURA HEALTH-ST MARY CORWIN MEDICAL CENTER (Voluntary non-profit - Church, provides emergency services, 1008 MINNEQUA AVE) CMHIP - GENERAL HOSPITAL (1600 WEST 24TH ST) COLORADO MENTAL HEALTH INSTITUTE AT PUEBLO PSYCH (1600 WEST 24TH ST) FRONTIER HOSPICE, LLC (503 N MAIN STE 103W) PARKVIEW MEDICAL CENTER INC (Voluntary non-profit - Private, 400 W 16TH STREET) SANGRE DE CRISTO HOSPICE AND PALLIATIVE CARE (1207 PUEBLO BLVD WAY) Nursing Homes in Pueblo: BELMONT LODGE HEALTH CARE CENTER (1601 CONSTITUTION ROAD) CENTURA HEALTH-PAVILION AT VILLA PUEBLO THE (855 HUNTER DRIVE) CITADEL HEALTH CARE (431 QUINCY) HIGHLAND PARK NRSG COMPLEX (1610 SCRANTON AVE) LIFE CARE CENTER OF PUEBLO (2118 CHATALET LANE) MINNEQUA MEDICENTER (2701 CALIFORNIA ST) PUEBLO CARE AND REHABILITATION CENTER (2611 JONES AVENUE) SHARMAR VILLAGE CARE CENTER (1201 WEST ABRIENDO AVENUE) SOUTH SIDE MANOR NURSING HOME (1611 ACERO ST) UNIVERSITY PARK CARE CENTER (945 DESERT FLOWER BOULEVARD) WESTWIND VILLAGE (2515 PITMAN PLACE) Dialysis Facilities in Pueblo: LIBERTY DIALYSIS - PUEBLO (850 EAGLERIDGE BLVD) PUEBLO DIALYSIS (FMC) (41 MONTEBELLO RD STE 200) PUEBLO SOUTH DIALYSIS (FMC) (3426 LAKE AVENUE STE 110) Home Health Centers in Pueblo: ABC HOME HEALTH CARE INC (2320 NORTH GRAND) ANGELS CARE HOME HEALTH OF PUEBLO (1310 FORTINO BLVD SUITE D) ARGUS HOME CARE, INC (807 W 4TH STREET) CENTURA HEALTH-ST MARY CORWIN HOME SERVICES (4025 CLUB MANOR DRIVE) COMPLETE HOME HEALTH CARE (41 MONTEBELLO ROAD #222) HOME CARE PLUS (704 ELMHURST PL) INTERIM HEALTHCARE OF PUEBLO (720 NORTH MAIN, ST, #400) MAXIM HEALTHCARE SERVICES (3691 PARKER BLVD SUITE 120) PARKVIEW HOMECARE (54 CLUB MANOR DRIVE, #103) Amtrak station: PUEBLO (703 W. U.S. 50) - Bus Station
.
Services: enclosed waiting area, free short-term parking, call for taxi service, public transit connection.
Colleges/Universities in Pueblo: Colorado State University-Pueblo Full-time enrollment: 5,993; Location: 2200 Bonforte Blvd; Public; Website: www.colostate-pueblo.edu; Offers Master's degree )
Pueblo Community College Full-time enrollment: 5,329; Location: 900 West Orman Avenue; Public; Website: www.pueblocc.edu)
Other colleges/universities with over 2000 students near Pueblo:
Pikes Peak Community College (about 36 miles; Colorado Springs, CO ; Full-time enrollment: 10,395)
Colorado College (about 42 miles; Colorado Springs, CO ; FT enrollment: 2,199)
University of Colorado Colorado Springs (about 45 miles; Colorado Springs, CO ; FT enrollment: 8,700)
Colorado Technical University-Online (about 45 miles; Colorado Springs, CO ; FT enrollment: 22,771)
Colorado Technical University-Colorado Springs (about 45 miles; Colorado Springs, CO ; FT enrollment: 2,049)
United States Air Force Academy (about 54 miles; USAFA, CO ; FT enrollment: 5,088)
Adams State University (about 88 miles; Alamosa, CO ; FT enrollment: 2,805)
Biggest public high schools in Pueblo: CENTENNIAL HIGH SCHOOL Students: 1,040, Location: 2525 MONTVIEW DIRVE, Grades: 9-12)PUEBLO COUNTY HIGH SCHOOL Students: 881, Location: 1050 35TH LANE, Grades: 9-12)YOUTH & FAMILY ACADEMY CHARTER Students: 222, Location: 1920 VALLEY DRIVE, Grades: 7-12, Charter school )ROCKY MOUNTAIN DIGITAL ACADEMY Location: 107 WEST 11TH STREET, Grades: 6-12)
CENTRAL HIGH SCHOOL Location: 216 EAST ORMAN AVENUE, Grades: 9-12)
EAST HIGH SCHOOL Location: 9 MAC NEIL ROAD, Grades: 9-12)
SOUTH HIGH SCHOOL Location: 1801 HOLLYWOOD DRIVE, Grades: 9-12)
CHAVEZ/HUERTA K-12 PREPARATORY ACADEMY Location: 2500 WEST 18TH STREET, Grades: KG-12, Charter school )
PUEBLO YOUTH SERVICE CENTER Location: 1406 WEST 17TH STREET, Grades: 4-12)
70 ONLINE Location: 301 LANE 28, Grades: KG-12)
Private high schools in Pueblo: ST THERESE CATHOLIC SCHOOL Students: 163, Location: 320 GOODNIGHT AVE, Grades: PK-9)
PARKHILL CHRISTIAN ACADEMY Students: 85, Location: 4235 PARKHILL PL, Grades: PK-12)
Biggest public elementary/middle schools in Pueblo: W H HEATON MIDDLE SCHOOL Students: 657, Location: 6 ADAIR ROAD, Grades: 6-8)GOODNIGHT ELEMENTARY SCHOOL Students: 607, Location: 624 WINDY WAY, Grades: PK-8)HIGHLAND PARK ELEMENTARY SCHOOL Students: 522, Location: 2701 VINEWOOD LANE, Grades: PK-6)SUNSET PARK ELEMENTARY SCHOOL Students: 514, Location: 110 UNIVERSITY CIRCLE, Grades: PK-6)BELMONT ELEMENTARY SCHOOL Students: 486, Location: 31 MACNAUGHTON ROAD, Grades: PK-5)BESSEMER ELEMENTARY SCHOOL Students: 473, Location: 1125 E ROUTT AVENUE, Grades: PK-8)BENJAMIN FRANKLIN ELEMENTARY SCHOOL Students: 466, Location: 1315 HORSESHOE DRIVE, Grades: PK-5)MORTON ELEMENTARY SCHOOL Students: 453, Location: 1900 WEST 31ST STREET, Grades: PK-6)PUEBLO CHARTER SCHOOL FOR THE ARTS & SCIENCES Students: 373, Location: 1745 ACERO, Grades: KG-8, Charter school )PLEASANT VIEW MIDDLE SCHOOL Students: 362, Location: 23600 EVERETT ROAD, Grades: 6-8)Private elementary/middle schools in Pueblo: TRINITY LUTHERAN SCHOOL Students: 149, Location: 701 W EVANS AVE, Grades: PK-8)
ST JOHN NEUMANN CATHOLIC SCHOOL Students: 146, Location: 2415 E ORMAN AVE, Grades: PK-8)
THE MCCLELLAND SCHOOL Students: 121, Location: 415 E ABRIENDO AVE, Grades: PK-8)
PUEBLO SDA SCHOOL (DAYSTAR) Students: 10, Location: 3912 ONEAL AVE, Grades: 1-7)
See full list of schools located in Pueblo Library in Pueblo: PUEBLO CITY-COUNTY LIBRARY DISTRICT Operating income: $7,346,695; Location: 100 E ABRIENDO AVE; 459,745 books ; 334 e-books ; 23,686 audio materials ; 37,153 video materials ; 12 local licensed databases ; 3 state licensed databases ; 81 other licensed databases ; 511 print serial subscriptions )
User-submitted facts and corrections:
Southern Colorado University has recently changed its name to Colorado State University-Pueblo (2003)
added by Jeremy Shawn Fogg
The website for Pueblo Community College has changed to www.pueblocc.edu
The City of Pueblo's official website address is: www.pueblo.us added by Bobby
Southern Colorado University has recently changed its name to Colorado State University-Pueblo (2003)
Pueblo West High School is a 9-12 Grade High School. Its located in Pueblo West.
University of Southern Colorado is now Colorado State University-Pueblo
Notable locations in Pueblo: (A) , Southside Landfill (B) , Travelaire Ambulance (C) , Children's Hospital Colorado Therapy Care Pueblo (D) , Colorado Mental Health Institute at Pueblo (E) , Flight for Life Colorado 4 (F) , American Medical Response Pueblo (G) , Rocky Mountain Steel Mills Plant Fire Rescue EMS (H) , Pueblo Fire Department Station 9 (I) , Pueblo Fire Department Station 7 (J) , Pueblo Fire Department Station 4 (K) , Pueblo Fire Department Station 3 (L) , Pueblo Fire Department Station 10 (M) , Pueblo Fire Department Station 6 (N) , Pueblo Fire Department Station 1 (O) , Pueblo Fire Department Station 5 (P) , Pueblo Fire Department Station 2 (Q) , Pueblo Fire Department Station 8 (R) , US Marshals Service Pueblo Office (S) , Pueblo County Sheriff's Office at Colorado State University Pueblo (T) . Display/hide their locations on the map
Churches in Pueblo include: (A) , Plainview Church (B) , Holy Family Church (C) . Display/hide their locations on the map
Cemeteries: (1) , Valhalla Memorial Park (2) , Masonic Cemetery (3) . Display/hide their locations on the map
Reservoirs: (A) , Lake Minnequa Reservoir (B) , South Colorado Power Company Reservoir (C) , Lake Minnequa (D) , Northside Reservoir (E) , Southside Reservoirs (F) . Display/hide their locations on the map
Creek: (A) . Display/hide its location on the map
Parks in Pueblo include: (1) , Bessemer Park (2) , Bradford Park (3) , Henkle Park (4) , Runyan Field (5) , Crome Park (6) , Royal Park (7) , Bruner Park (8) , Mineral Palace Park (9) . Display/hide their locations on the map
Tourist attractions: (1) , Carriage House Restaurant at Rosemount (Museums; 419 West 14th Street) (2) , Pueblo Zoo (Cultural Attractions- Events- & Facilities; City Park) (3) , Southeastern Colorado Heritage Center (Cultural Attractions- Events- & Facilities; 201 West B Street) (4) , Pueblo City Government - Parks and Recreation- Zoo- Zoological Society-City (Cultural Attractions- Events- & Facilities; 3455 Nuckolls Avenue) (5) , Rosemount Museum (Cultural Attractions- Events- & Facilities; 419 West 14th Street) (6) , Pueblo Weisbro Aircraft Museum (Cultural Attractions- Events- & Facilities; 31001 Magnuson Avenue) (7) , Sangre de Cristo Arts & Conference Center (Cultural Attractions- Events- & Facilities; 210 North Santa Fe Avenue) (8) , Martin L King Culture Center (Cultural Attractions- Events- & Facilities; 2713 North Grand Avenue) (9) . Display/hide their approximate locations on the map
Hotels: (1) , Homestead Studio Suites (9650 East Geddes Avenue) (2) , Days Inn (4201 North Elizabeth Street) (3) , Country Bunk Inn Motel (3369 South Interstate 25) (4) , Hampton Inn & Suites (3315 Gateway Drive) (5) , Econo Lodge Pueblo (4615 North Elizabeth Street) (6) , Best Western Eagleridge Inn (4727 North Elizabeth) (7) , Comfort Inn (77 South Radnor Drive) (8) , Abriendo Inn (300 W Abriendo Ave) (9) . Display/hide their approximate locations on the map
Courts: (1) , Federal Bureau Of Investigation (720 North Main Street) (2) , Colorado State Government - Combined Court-Tenth Judicial District- Probation Depart (1120 Court Street) (3) , Colorado State Government - Combined Court-Tenth Judicial District (320 West 10th Street) (4) , Pueblo City Government - Municipal Court (140 Central Main Street) (5) . Display/hide their approximate locations on the map
Birthplace of: David Packard - Electrical engineer, Kathleen Carley - Social scientist, Tad Boyle - Basketball player-coach, Frank DeSimone - Mob boss, Grant Withers - Actor, J. D. Brookhart - Football coach, Raymond G. Murphy - Marine Corps Medal of Honor recipient, William J. Crawford - Army Medal of Honor recipient, George Zaharias - Wrestlers, Abel Tapia - Politician.
Pueblo County has a predicted average indoor radon screening level greater than 4 pCi/L (pico curies per liter) - Highest Potential Drinking water stations with addresses in Pueblo and their reported violations in the past:
YMCA CAMP JACKSON (Population served: 120, Surface water):
Past monitoring violations:
Monitoring, Turbidity (Enhanced SWTR) - In MAY-2008, Contaminant: IESWTR. Follow-up actions: St Public Notif requested (JUN-26-2008), St Violation/Reminder Notice (JUN-26-2008), St Compliance achieved (AUG-25-2008)
3 routine major monitoring violations
One minor monitoring violation
Population served: 100, Purch groundwater):
Past monitoring violations:
Monitoring and Reporting (DBP) - Between OCT-2010 and DEC-2010, Contaminant: Chlorine. Follow-up actions: St Public Notif requested (NOV-30-2010), St Violation/Reminder Notice (NOV-30-2010), St Compliance achieved (APR-13-2011)
Monitoring and Reporting (DBP) - Between JUL-2010 and SEP-2010, Contaminant: Chlorine. Follow-up actions: St Public Notif requested (AUG-31-2010), St Violation/Reminder Notice (AUG-31-2010), St Compliance achieved (APR-13-2011)
Monitoring and Reporting (DBP) - Between APR-2010 and JUN-2010, Contaminant: Chlorine. Follow-up actions: St Public Notif requested (JUN-24-2010), St Violation/Reminder Notice (JUN-24-2010), St Compliance achieved (APR-13-2011)
Monitoring and Reporting (DBP) - Between JAN-2010 and MAR-2010, Contaminant: Chlorine. Follow-up actions: St Public Notif requested (MAR-30-2010), St Violation/Reminder Notice (MAR-30-2010), St Compliance achieved (APR-13-2011)
9 routine major monitoring violations
Average household size: This city:
2.4 peopleColorado:
2.5 people
Percentage of family households: This city:
60.8%Whole state:
63.9%
Percentage of households with unmarried partners: This city:
7.6%Whole state:
6.5%
Likely homosexual households (counted as self-reported same-sex unmarried-partner households)
Lesbian couples: 0.4% of all households Gay men: 0.2% of all households
People in group quarters in Pueblo in 2010:
1,444 people in nursing facilities/skilled-nursing facilities
839 people in correctional residential facilities
656 people in college/university student housing
519 people in local jails and other municipal confinement facilities
203 people in state prisons
113 people in other noninstitutional facilities
91 people in emergency and transitional shelters (with sleeping facilities) for people experiencing homelessness
70 people in group homes intended for adults
46 people in residential treatment centers for adults
40 people in correctional facilities intended for juveniles
19 people in workers' group living quarters and job corps centers
5 people in hospitals with patients who have no usual home elsewhere
People in group quarters in Pueblo in 2000:
1,115 people in nursing homes
496 people in state prisons
494 people in mental (psychiatric) hospitals or wards
446 people in local jails and other confinement facilities (including police lockups)
428 people in college dormitories (includes college quarters off campus)
301 people in other noninstitutional group quarters
244 people in unknown juvenile institutions
76 people in halfway houses
64 people in homes for the mentally ill
64 people in other nonhousehold living situations
54 people in short-term care, detention or diagnostic centers for delinquent children
39 people in other group homes
22 people in homes for the physically handicapped
20 people in homes or halfway houses for drug/alcohol abuse
11 people in hospitals or wards for drug/alcohol abuse
7 people in homes for the mentally retarded
6 people in residential treatment centers for emotionally disturbed children
5 people in agriculture workers' dormitories on farms
2 people in religious group quarters
Arenas or stadiums:
Massari Gym. Colorado State University - Pueblo.
Colorado State Fair Events Center. Capacity: 8,225.
Banks with most branches in Pueblo (2011 data):
U.S. Bank National Association: 7 branches. Info updated 2012/01/30: Bank assets: $330,470.8 mil, Deposits: $236,091.5 mil, headquarters in Cincinnati, OH, positive income , 3121 total offices , Holding Company: U.S. Bancorp
Wells Fargo Bank, National Association: Santa Fe Branch, Branch Messenger Service, Sunset Park Branch, Pueblo Branch, Pueblo North Branch, South Prairie Branch. Info updated 2011/04/05: Bank assets: $1,161,490.0 mil, Deposits: $905,653.0 mil, headquarters in Sioux Falls, SD, positive income , 6395 total offices , Holding Company: Wells Fargo & Company
The Pueblo Bank and Trust Company: Drive-In Facility, The Pueblo Bank And Trust Company, South Pueblo Branch, Jerry Murphy Road Branch. Info updated 2012/03/01: Bank assets: $309.6 mil, Deposits: $272.8 mil, local headquarters , negative income in the last year , Commercial Lending Specialization, 10 total offices , Holding Company: Pueblo Bancorporation
Legacy Bank: Branch, Mobile Branch, Branch. Info updated 2009/10/05: Bank assets: $252.4 mil, Deposits: $213.1 mil, headquarters in Wiley, CO, positive income , Commercial Lending Specialization, 9 total offices
Sunflower Bank, National Association: Pueblo Regency Office, Pueblo Northside Office, Pueblo Santa Fe Office. Info updated 2011/09/20: Bank assets: $1,733.8 mil, Deposits: $1,299.6 mil, headquarters in Salina, KS, positive income , Commercial Lending Specialization, 34 total offices , Holding Company: Sunflower Financial, Inc.
Vectra Bank Colorado, National Association: Pueblo South, Pueblo Downtown Branch, Pueblo North. Info updated 2006/11/03: Bank assets: $2,356.9 mil, Deposits: $2,003.6 mil, headquarters in Farmington, NM, negative income in the last year , Commercial Lending Specialization, 39 total offices , Holding Company: Zions Bancorporation
Academy Bank, National Association: Walmart Pueblo Branch, Dillon Drive Branch, Pueblo West Branch. Info updated 2008/06/10: Bank assets: $282.1 mil, Deposits: $218.0 mil, headquarters in Colorado Springs, CO, positive income , Commercial Lending Specialization, 54 total offices , Holding Company: Dickinson Financial Corporation Ii
Colorado East Bank & Trust: Pueblo Branch at 1515 Fortino Boulevard, branch established on 2001/06/11; Prairie Avenue Branch at 1219 S. Prairie Avenue, branch established on 2007/04/30. Info updated 2011/11/01: Bank assets: $798.2 mil, Deposits: $704.8 mil, headquarters in Lamar, CO, negative income in the last year , Agricultural Specialization, 18 total offices , Holding Company: Coloeast Bankshares, Inc.
Canon National Bank: Pueblo Anherst Branch at 2 Amherst Avenue, branch established on 2005/01/07; Pueblo Branch at 101 West 5th Street, branch established on 1994/05/02. Info updated 2006/11/03: Bank assets: $226.6 mil, Deposits: $201.0 mil, headquarters in Canon City, CO, positive income , Commercial Lending Specialization, 9 total offices , Holding Company: Canon Bank Corporation
5 other banks with 5 local branches
For population 15 years and over in Pueblo:
Never married: 35.8%Now married: 39.7%Separated: 2.5%Widowed: 6.1%Divorced: 16.1% For population 25 years and over in Pueblo:
High school or higher: 87.9%Bachelor's degree or higher: 22.4%Graduate or professional degree: 8.7%Unemployed: 7.2%Mean travel time to work (commute): 18.4 minutes
Education Gini index (Inequality in education) Here:
10.3Colorado average:
11.1
Religion statistics for Pueblo, CO (based on Pueblo County data)
Religion Adherents Congregations Catholic 72,405 18 Evangelical Protestant 14,339 88 Mainline Protestant 6,572 26 Other 4,946 20 Black Protestant 615 3 Orthodox 135 2 None 60,051 -
Source: Clifford Grammich, Kirk Hadaway, Richard Houseal, Dale E.Jones, Alexei Krindatch, Richie Stanley and Richard H.Taylor. 2012. 2010 U.S.Religion Census: Religious Congregations & Membership Study. Association of Statisticians of American Religious Bodies. Jones, Dale E., et al. 2002. Congregations and Membership in the United States 2000. Nashville, TN: Glenmary Research Center. Graphs represent county-level data
Food Environment Statistics: Number of grocery stores : 18Here :
1.16 / 10,000 pop.Colorado :
1.50 / 10,000 pop.
Number of supercenters and club stores : 3Pueblo County :
0.19 / 10,000 pop.Colorado :
0.15 / 10,000 pop.
Number of convenience stores (no gas) : 3Pueblo County :
0.19 / 10,000 pop.Colorado :
0.45 / 10,000 pop.
Number of convenience stores (with gas) : 66This county :
4.27 / 10,000 pop.Colorado :
3.13 / 10,000 pop.
Number of full-service restaurants : 119Pueblo County :
7.69 / 10,000 pop.Colorado :
8.99 / 10,000 pop.
Adult diabetes rate : Pueblo County :
7.0%Colorado :
5.3%
Adult obesity rate : Pueblo County :
23.3%State :
18.4%
Low-income preschool obesity rate : Health and Nutrition: Healthy diet rate : This city:
49.5%Colorado:
49.4%
Average overall health of teeth and gums : This city:
48.0%Colorado:
47.8%
Average BMI : This city:
28.7Colorado:
28.5
People feeling badly about themselves : This city:
21.0%State:
20.7%
People not drinking alcohol at all : This city:
11.0%Colorado:
9.7%
Average hours sleeping at night : Overweight people : Pueblo:
34.9%Colorado:
33.3%
General health condition : Average condition of hearing : Pueblo:
79.5%Colorado:
80.2%
More about Health and Nutrition of Pueblo, CO Residents
Local government employment and payroll (March 2022)
Function
Full-time employees
Monthly full-time payroll
Average yearly full-time wage
Part-time employees
Monthly part-time payroll
Police Protection - Officers
198 $1,367,222 $82,862 0 $0 Firefighters
136 $989,047 $87,269 0 $0 Water Supply
128 $839,544 $78,707 10 $7,044 Sewerage
65 $336,849 $62,188 3 $4,677 Police - Other
62 $319,055 $61,753 26 $32,230 Streets and Highways
48 $250,151 $62,538 0 $0 Financial Administration
42 $238,760 $68,217 10 $13,053 Transit
39 $160,419 $49,360 0 $0 Parks and Recreation
35 $164,177 $56,289 82 $72,761 Other and Unallocable
31 $224,906 $87,060 3 $5,589 Other Government Administration
29 $236,221 $97,747 3 $8,876 Judicial and Legal
20 $121,991 $73,195 6 $12,310 Airports
12 $59,439 $59,439 0 $0 Solid Waste Management
7 $23,209 $39,787 0 $0 Fire - Other
5 $38,361 $92,066 1 $1,842 Housing and Community Development (Local)
3 $18,315 $73,260 2 $3,210
Totals for Government
860 $5,387,667 $75,177 146 $161,592
Pueblo government finances - Expenditure in 2021 (per resident):
Construction - Sewerage: $7,534,000 ($67.60)
General - Other: $5,430,000 ($48.72)Water Utilities: $4,659,000 ($41.80)Air Transportation: $275,000 ($2.47)Current Operations - Police Protection: $32,679,000 ($293.20)
Water Utilities: $26,108,000 ($234.24)Local Fire Protection: $19,748,000 ($177.18)Sewerage: $17,292,000 ($155.15)General - Other: $14,560,000 ($130.63)Central Staff Services: $12,430,000 ($111.52)Parks and Recreation: $8,682,000 ($77.90)Regular Highways: $7,111,000 ($63.80)Housing and Community Development: $6,516,000 ($58.46)Transit Utilities: $5,131,000 ($46.04)Air Transportation: $3,829,000 ($34.35)Parking Facilities: $710,000 ($6.37)General - Interest on Debt: $1,184,000 ($10.62)
Other Capital Outlay - Sewerage: $5,525,000 ($49.57)
Water Utilities: $1,609,000 ($14.44)General - Other: $1,474,000 ($13.22)Housing and Community Development: $983,000 ($8.82)Transit Utilities: $891,000 ($7.99)Air Transportation: $621,000 ($5.57)Police Protection: $111,000 ($1.00)Parks and Recreation: $103,000 ($0.92)Parking Facilities: $4,000 ($0.04)Total Salaries and Wages: $9,438,000 ($84.68)
Water Utilities - Interest on Debt: $1,102,000 ($9.89)
Pueblo government finances - Revenue in 2021 (per resident):
Charges - Sewerage: $30,437,000 ($273.09)
Other: $7,698,000 ($69.07)Regular Highways: $2,441,000 ($21.90)Parks and Recreation: $2,284,000 ($20.49)Air Transportation: $638,000 ($5.72)Parking Facilities: $266,000 ($2.39)Housing and Community Development: $42,000 ($0.38)Federal Intergovernmental - Housing and Community Development: $1,781,000 ($15.98)
Air Transportation: $842,000 ($7.55)Miscellaneous - Sale of Property: $3,492,000 ($31.33)
Interest Earnings: $3,473,000 ($31.16)Fines and Forfeits: $1,961,000 ($17.59)General Revenue - Other: $1,837,000 ($16.48)Rents: $1,049,000 ($9.41)Donations From Private Sources: $274,000 ($2.46)Special Assessments: $199,000 ($1.79)Revenue - Water Utilities: $39,300,000 ($352.61)
Transit Utilities: $857,000 ($7.69)State Intergovernmental - Other: $11,288,000 ($101.28)
Transit Utilities: $3,062,000 ($27.47)General Local Government Support: $2,998,000 ($26.90)Sewerage: $411,000 ($3.69)Tax - General Sales and Gross Receipts: $80,391,000 ($721.28)
Property: $15,508,000 ($139.14)Other License: $1,070,000 ($9.60)
Pueblo government finances - Debt in 2021 (per resident):
Long Term Debt - Beginning Outstanding - Unspecified Public Purpose: $74,173,000 ($665.49)
Outstanding Unspecified Public Purpose: $41,311,000 ($370.65)Retired Unspecified Public Purpose: $32,862,000 ($294.84)
Pueblo government finances - Cash and Securities in 2021 (per resident):
Bond Funds - Cash and Securities: $658,000 ($5.90)
Other Funds - Cash and Securities: $249,010,000 ($2234.16)
Sinking Funds - Cash and Securities: $2,412,000 ($21.64)
Businesses in Pueblo, CO
Name Count Name Count
7-Eleven 6 Lane Furniture 2 AT&T 3 LensCrafters 1 Advance Auto Parts 2 Little Caesars Pizza 4 Albertsons 1 Lowe's 2 Applebee's 2 Marriott 1 Arby's 2 MasterBrand Cabinets 8 AutoZone 3 Maurices 1 Barnes & Noble 1 Mazda 1 Bath & Body Works 1 McDonald's 6 Bed Bath & Beyond 1 Microtel 1 Best Western 1 Motel 6 1 Big O Tires 1 Nike 3 Blockbuster 2 Nissan 1 Buffalo Wild Wings 1 Office Depot 1 Burger King 3 OfficeMax 1 Cambria 1 Old Navy 1 Carl\s Jr. 3 Olive Garden 1 Chevrolet 1 Pac Sun 1 Chipotle 1 Papa John's Pizza 2 Clarion 1 Payless 2 Cold Stone Creamery 1 Penske 1 Comfort Inn 1 PetSmart 1 Cracker Barrel 1 Pizza Hut 4 Cricket Wireless 7 Popeyes 2 Curves 1 Quality 1 Dairy Queen 5 Quiznos 1 Days Inn 1 RadioShack 2 Dennys 1 Ramada 1 Discount Tire 1 Red Lobster 1 Domino's Pizza 4 Rodeway Inn 1 DressBarn 1 Ruby Tuesday 1 Dressbarn 1 Rue21 1 Econo Lodge 1 SONIC Drive-In 4 Famous Footwear 2 Safeway 4 FedEx 14 Sam's Club 1 Finish Line 1 Sears 3 Firestone Complete Auto Care 1 Sleep Inn 1 Foot Locker 1 Spencer Gifts 1 Ford 1 Sprint Nextel 1 GNC 1 Staples 1 GameStop 3 Starbucks 4 H&R Block 8 Subaru 1 Hilton 2 Subway 11 Hobby Lobby 1 Super 8 1 Holiday Inn 1 T-Mobile 6 Home Depot 1 Taco Bell 5 Honda 1 Target 1 Hot Topic 1 Toyota 1 Howard Johnson 1 True Value 1 IHOP 2 U-Haul 5 JCPenney 1 UPS 15 Jack In The Box 1 Vans 3 Jones New York 3 Verizon Wireless 1 Journeys 1 Victoria's Secret 1 Justice 1 Village Inn 2 KFC 4 Vons 4 Kincaid 1 Walgreens 4 Kmart 2 Walmart 2 Kohl's 1 Wendy's 4 Kroger 28 Wingate 1 La Quinta 1 World Gym 1 La-Z-Boy 1 YMCA 1
Strongest AM radio stations in Pueblo:
KGHF (1350 AM; 5 kW; PUEBLO, CO; Owner: CLEAR CHANNEL BROADCASTING LICENSES, INC.)
KFEL (970 AM; 3 kW; PUEBLO, CO; Owner: WELLSPRING HARVEST MINISTRIES, INC.)
KKPC (1230 AM; 1 kW; PUEBLO, CO; Owner: PUBLIC BROADCASTING OF COLORADO, INC.)
KAVA (1480 AM; 1 kW; PUEBLO, CO)
KRMX (690 AM; 0 kW; PUEBLO, CO; Owner: METROPOLITAN RADIO GROUP, INC.)
KCSJ (590 AM; 1 kW; PUEBLO, CO; Owner: CLEAR CHANNEL BROADCASTING LICENSES, INC.)
KCBR (1040 AM; daytime; 15 kW; MONUMENT, CO; Owner: KLZ RADIO, INC.)
KOA (850 AM; 50 kW; DENVER, CO; Owner: JACOR BROADCASTING OF COLORADO, INC.)
KCMN (1530 AM; 15 kW; COLORADO SPRINGS, CO)
KWYD (1580 AM; 10 kW; COLORADO SPRINGS, CO; Owner: PILGRIM COMMUNICATIONS, INC.)
KLTT (670 AM; 50 kW; COMMERCE CITY, CO; Owner: KLZ RADIO, INC.)
KMXA (1090 AM; 50 kW; AURORA, CO; Owner: ENTRAVISION HOLDINGS, LLC)
KKZN (760 AM; 50 kW; THORNTON, CO; Owner: JACOR BROADCASTING OF COLORADO, INC.)
Strongest FM radio stations in Pueblo:
KKMG (98.9 FM; PUEBLO, CO; Owner: CITADEL BROADCASTING COMPANY)
KTSC-FM (89.5 FM; PUEBLO, CO; Owner: UNIVERSITY OF SOUTHERN COLORADO)
KCFP (91.9 FM; PUEBLO, CO; Owner: PUBLIC BROADCASTING OF COLORADO, INC)
K201CZ (88.1 FM; PUEBLO, CO; Owner: FAMILY STATIONS, INC.)
KYZX (103.9 FM; PUEBLO WEST, CO; Owner: COLORADO SPRINGS RADIO B/CASTRS, INC)
KCCY (96.9 FM; PUEBLO, CO; Owner: CAPSTAR TX LIMITED PARTNERSHIP)
KDZA-FM (107.9 FM; PUEBLO, CO; Owner: CAPSTAR TX LIMITED PARTNERSHIP)
K209ET (89.7 FM; PUEBLO WEST, CO; Owner: MAKE A DIFFERENCE FOUNDATION, INC.)
KNKN (107.1 FM; PUEBLO, CO; Owner: METROPOLITAN RADIO GROUP, INC.)
KKFM (98.1 FM; COLORADO SPRINGS, CO; Owner: CITADEL BROADCASTING COMPANY)
KKCS-FM (101.9 FM; COLORADO SPRINGS, CO; Owner: WALTON STATIONS - COLORADO, INC.)
KBIQ (102.7 FM; MANITOU SPRINGS, CO; Owner: BISON MEDIA, INC.)
KRCC (91.5 FM; COLORADO SPRINGS, CO; Owner: THE COLORADO COLLEGE)
KSKX (105.5 FM; SECURITY, CO; Owner: OPTIMA COMMUNICATIONS, INC.)
KKLI (106.3 FM; WIDEFIELD, CO; Owner: CAPSTAR TX LIMITED PARTNERSHIP)
KGFT (100.7 FM; PUEBLO, CO; Owner: BISON MEDIA, INC)
KTLF (90.5 FM; COLORADO SPRINGS, CO; Owner: EDUCATIONAL COMMUNICATIONS OF COLORADO SPRINGS, INC.)
K203AT (88.5 FM; WESTCLIFFE, ETC., CO; Owner: THE COLORADO COLLEGE)
KSPZ (92.9 FM; COLORADO SPRINGS, CO; Owner: CITADEL BROADCASTING COMPANY)
KVUU (99.9 FM; PUEBLO, CO; Owner: CAPSTAR TX LIMITED PARTNERSHIP)
TV broadcast stations around Pueblo:
K34FB (Channel 34; PUEBLO, CO; Owner: TELEMUNDO OF STEAMBOAT SPRINGS COLO. LIC. CORP.)
K48CU (Channel 48; PUEBLO, CO; Owner: FULL GOSPEL OUTREACH, INC.)
KOAA-TV (Channel 5; PUEBLO, CO; Owner: SANGRE DE CRISTO COMMUNICATIONS, INC.)
K03FH (Channel 3; COALDALE, CO; Owner: COALDALE TV CLUB)
K10AR (Channel 10; COALDALE, CO; Owner: COALDALE TV CLUB)
Medal of Honor Recipients
Medal of Honor Recipients born in Pueblo: Raymond G. Murphy, William J. Crawford.
National Bridge Inventory (NBI) Statistics 160 Number of bridges2,372ft / 723m Total length $76,092,000 Total costs2,235,983 Total average daily traffic152,753 Total average daily truck traffic
New bridges - historical statistics
1 1900-1909 11 1920-1929 8 1930-1939 1 1940-1949 30 1950-1959 31 1960-1969 25 1970-1979 10 1980-1989 15 1990-1999 12 2000-2009 15 2010-2019 1 2020-2022
See full National Bridge Inventory statistics for Pueblo, CO
Home Mortgage Disclosure Act Aggregated Statistics For Year 2009(Based on 28 full and 9 partial tracts) A) FHA, FSA/RHS & VA B) Conventional C) Refinancings D) Home Improvement Loans E) Loans on Dwellings For 5+ Families F) Non-occupant Loans on G) Loans On Manufactured Number Average Value Number Average Value Number Average Value Number Average Value Number Average Value Number Average Value Number Average Value
LOANS ORIGINATED 559 $107,033 309 $98,630 1,224 $119,611 117 $32,019 7 $1,999,494 230 $70,627 8 $45,886 APPLICATIONS APPROVED, NOT ACCEPTED 37 $106,856 29 $117,736 126 $115,252 12 $22,780 0 $0 23 $77,192 5 $46,362 APPLICATIONS DENIED 65 $111,996 58 $88,419 520 $106,703 136 $21,689 0 $0 74 $73,086 5 $40,890 APPLICATIONS WITHDRAWN 45 $101,468 53 $94,394 285 $112,602 24 $53,212 1 $120,000 30 $68,138 4 $64,480 FILES CLOSED FOR INCOMPLETENESS 5 $104,882 5 $73,636 75 $111,932 6 $90,872 1 $138,000 9 $73,711 2 $45,975
Aggregated Statistics For Year 2008(Based on 27 full and 9 partial tracts) A) FHA, FSA/RHS & VA B) Conventional C) Refinancings D) Home Improvement Loans E) Loans on Dwellings For 5+ Families F) Non-occupant Loans on G) Loans On Manufactured Number Average Value Number Average Value Number Average Value Number Average Value Number Average Value Number Average Value Number Average Value
LOANS ORIGINATED 449 $106,978 561 $93,779 1,033 $102,687 184 $28,388 11 $474,341 406 $76,743 11 $55,628 APPLICATIONS APPROVED, NOT ACCEPTED 24 $106,659 68 $99,799 179 $101,503 38 $22,981 1 $183,000 52 $82,899 3 $45,983 APPLICATIONS DENIED 48 $110,339 131 $87,873 951 $102,221 243 $30,660 0 $0 170 $71,373 17 $36,866 APPLICATIONS WITHDRAWN 37 $96,652 74 $80,428 329 $118,073 43 $50,171 1 $1,700,000 48 $73,257 1 $29,880 FILES CLOSED FOR INCOMPLETENESS 6 $160,485 8 $84,299 73 $107,945 9 $65,778 0 $0 18 $87,379 1 $46,720
Aggregated Statistics For Year 2007(Based on 29 full and 9 partial tracts) A) FHA, FSA/RHS & VA B) Conventional C) Refinancings D) Home Improvement Loans E) Loans on Dwellings For 5+ Families F) Non-occupant Loans on G) Loans On Manufactured Number Average Value Number Average Value Number Average Value Number Average Value Number Average Value Number Average Value Number Average Value
LOANS ORIGINATED 240 $107,092 1,032 $97,303 1,275 $94,388 229 $30,712 6 $2,509,002 509 $78,760 23 $63,248 APPLICATIONS APPROVED, NOT ACCEPTED 18 $101,246 131 $95,459 283 $93,276 62 $38,566 1 $77,000 84 $80,051 5 $62,418 APPLICATIONS DENIED 31 $109,299 365 $89,256 1,376 $104,512 267 $44,088 2 $385,790 263 $82,148 23 $45,699 APPLICATIONS WITHDRAWN 16 $111,166 137 $89,397 613 $109,731 30 $64,928 1 $2,207,250 81 $98,896 5 $62,806 FILES CLOSED FOR INCOMPLETENESS 2 $127,500 136 $79,560 130 $100,185 9 $66,200 0 $0 26 $80,040 0 $0
Aggregated Statistics For Year 2006(Based on 29 full and 9 partial tracts) A) FHA, FSA/RHS & VA B) Conventional C) Refinancings D) Home Improvement Loans E) Loans on Dwellings For 5+ Families F) Non-occupant Loans on G) Loans On Manufactured Number Average Value Number Average Value Number Average Value Number Average Value Number Average Value Number Average Value Number Average Value
LOANS ORIGINATED 329 $104,430 1,816 $82,205 1,911 $84,746 231 $35,564 6 $656,935 809 $73,876 26 $61,987 APPLICATIONS APPROVED, NOT ACCEPTED 8 $97,421 224 $74,694 402 $90,550 59 $44,346 0 $0 135 $77,411 7 $64,230 APPLICATIONS DENIED 28 $103,849 695 $75,507 1,744 $95,836 307 $37,581 3 $214,000 306 $71,617 30 $53,409 APPLICATIONS WITHDRAWN 27 $106,113 317 $81,117 1,011 $103,635 52 $65,731 2 $2,679,765 140 $74,495 3 $52,193 FILES CLOSED FOR INCOMPLETENESS 1 $114,000 58 $92,332 195 $102,037 4 $40,000 0 $0 29 $79,066 1 $84,910
Aggregated Statistics For Year 2005(Based on 29 full and 9 partial tracts) A) FHA, FSA/RHS & VA B) Conventional C) Refinancings D) Home Improvement Loans E) Loans on Dwellings For 5+ Families F) Non-occupant Loans on G) Loans On Manufactured Number Average Value Number Average Value Number Average Value Number Average Value Number Average Value Number Average Value Number Average Value
LOANS ORIGINATED 351 $101,719 1,821 $79,666 2,317 $87,182 232 $40,915 7 $642,299 815 $74,610 26 $57,227 APPLICATIONS APPROVED, NOT ACCEPTED 19 $104,322 278 $80,200 379 $89,266 43 $45,814 2 $156,000 94 $93,940 6 $41,043 APPLICATIONS DENIED 38 $98,323 577 $73,825 1,828 $95,182 326 $35,063 2 $95,000 265 $79,677 59 $64,618 APPLICATIONS WITHDRAWN 27 $101,035 397 $91,801 1,172 $104,581 78 $84,850 1 $109,000 183 $82,518 16 $72,259 FILES CLOSED FOR INCOMPLETENESS 1 $108,950 52 $68,723 331 $107,907 7 $73,221 0 $0 22 $77,863 7 $96,229
Aggregated Statistics For Year 2004(Based on 29 full and 9 partial tracts) A) FHA, FSA/RHS & VA B) Conventional C) Refinancings D) Home Improvement Loans E) Loans on Dwellings For 5+ Families F) Non-occupant Loans on G) Loans On Manufactured Number Average Value Number Average Value Number Average Value Number Average Value Number Average Value Number Average Value Number Average Value
LOANS ORIGINATED 422 $96,490 1,407 $86,764 2,742 $89,591 250 $36,244 5 $299,200 832 $80,062 27 $65,816 APPLICATIONS APPROVED, NOT ACCEPTED 19 $92,069 225 $90,837 578 $92,716 49 $31,376 0 $0 151 $87,073 14 $65,334 APPLICATIONS DENIED 54 $96,387 411 $78,074 1,921 $93,266 297 $37,333 0 $0 239 $85,098 66 $58,484 APPLICATIONS WITHDRAWN 28 $103,471 224 $88,279 1,104 $98,876 46 $59,797 1 $30,000 121 $80,812 21 $92,570 FILES CLOSED FOR INCOMPLETENESS 3 $120,197 30 $105,178 289 $105,068 13 $49,505 0 $0 21 $90,720 2 $55,505
Aggregated Statistics For Year 2003(Based on 29 full and 9 partial tracts) A) FHA, FSA/RHS & VA B) Conventional C) Refinancings D) Home Improvement Loans E) Loans on Dwellings For 5+ Families F) Non-occupant Loans on Number Average Value Number Average Value Number Average Value Number Average Value Number Average Value Number Average Value
LOANS ORIGINATED 424 $95,322 1,160 $87,599 4,619 $88,595 298 $22,922 8 $649,632 1,006 $72,664 APPLICATIONS APPROVED, NOT ACCEPTED 18 $82,600 139 $101,814 664 $87,167 23 $23,562 0 $0 129 $76,661 APPLICATIONS DENIED 44 $94,061 283 $80,717 1,814 $88,579 295 $19,088 2 $210,500 239 $73,854 APPLICATIONS WITHDRAWN 59 $95,007 147 $84,488 1,132 $93,713 43 $24,772 0 $0 144 $74,171 FILES CLOSED FOR INCOMPLETENESS 6 $65,500 38 $90,385 223 $96,047 11 $29,059 0 $0 29 $70,081
Aggregated Statistics For Year 2001(Based on 29 full and 9 partial tracts) A) FHA, FSA/RHS & VA B) Conventional C) Refinancings D) Home Improvement Loans E) Loans on Dwellings For 5+ Families F) Non-occupant Loans on Number Average Value Number Average Value Number Average Value Number Average Value Number Average Value Number Average Value
LOANS ORIGINATED 361 $88,279 895 $81,942 2,656 $78,568 414 $19,493 10 $825,292 603 $62,726 APPLICATIONS APPROVED, NOT ACCEPTED 14 $95,439 134 $78,808 374 $77,073 35 $21,117 0 $0 63 $80,736 APPLICATIONS DENIED 38 $88,754 305 $90,771 1,616 $71,865 271 $18,287 1 $229,140 122 $62,144 APPLICATIONS WITHDRAWN 35 $81,470 136 $78,546 1,063 $82,290 56 $26,417 1 $147,000 89 $63,862 FILES CLOSED FOR INCOMPLETENESS 13 $95,241 43 $89,548 224 $84,605 19 $14,953 0 $0 31 $78,546
Aggregated Statistics For Year 2000(Based on 29 full and 9 partial tracts) A) FHA, FSA/RHS & VA B) Conventional C) Refinancings D) Home Improvement Loans E) Loans on Dwellings For 5+ Families F) Non-occupant Loans on Number Average Value Number Average Value Number Average Value Number Average Value Number Average Value Number Average Value
LOANS ORIGINATED 468 $81,022 875 $77,989 1,462 $60,540 434 $18,429 9 $1,490,663 420 $55,589 APPLICATIONS APPROVED, NOT ACCEPTED 35 $74,447 159 $70,059 352 $63,225 87 $19,167 0 $0 62 $61,256 APPLICATIONS DENIED 68 $75,266 590 $59,685 1,142 $60,855 372 $17,847 1 $198,000 132 $62,772 APPLICATIONS WITHDRAWN 63 $73,781 135 $75,285 701 $67,125 30 $32,723 2 $1,422,000 60 $58,067 FILES CLOSED FOR INCOMPLETENESS 14 $82,880 33 $89,619 186 $77,933 7 $21,103 0 $0 14 $72,911
Aggregated Statistics For Year 1999(Based on 30 full and 8 partial tracts) A) FHA, FSA/RHS & VA B) Conventional C) Refinancings D) Home Improvement Loans E) Loans on Dwellings For 5+ Families F) Non-occupant Loans on Number Average Value Number Average Value Number Average Value Number Average Value Number Average Value Number Average Value
LOANS ORIGINATED 508 $77,286 921 $77,592 2,397 $69,000 392 $17,576 11 $311,655 456 $58,310 APPLICATIONS APPROVED, NOT ACCEPTED 19 $75,935 237 $66,521 463 $60,988 88 $17,560 1 $46,000 45 $46,187 APPLICATIONS DENIED 37 $78,049 768 $58,234 1,209 $60,192 328 $16,387 4 $121,315 138 $53,367 APPLICATIONS WITHDRAWN 49 $79,533 200 $79,502 826 $67,277 54 $35,347 2 $2,260,000 66 $65,831 FILES CLOSED FOR INCOMPLETENESS 10 $86,493 42 $77,275 203 $69,580 6 $18,317 0 $0 23 $61,330
Detailed mortgage data for all 37 tracts in Pueblo, CO
Private Mortgage Insurance Companies Aggregated Statistics For Year 2009(Based on 22 full and 8 partial tracts) A) Conventional B) Refinancings C) Non-occupant Loans on Number Average Value Number Average Value Number Average Value
LOANS ORIGINATED 49 $142,304 49 $148,182 4 $77,750 APPLICATIONS APPROVED, NOT ACCEPTED 12 $92,065 15 $156,414 1 $31,000 APPLICATIONS DENIED 13 $184,982 21 $127,243 1 $96,000 APPLICATIONS WITHDRAWN 3 $55,150 2 $139,065 0 $0 FILES CLOSED FOR INCOMPLETENESS 3 $81,420 2 $110,000 1 $86,000
Aggregated Statistics For Year 2008(Based on 27 full and 9 partial tracts) A) Conventional B) Refinancings C) Non-occupant Loans on Number Average Value Number Average Value Number Average Value
LOANS ORIGINATED 242 $97,845 82 $130,122 59 $71,986 APPLICATIONS APPROVED, NOT ACCEPTED 60 $114,759 40 $110,684 17 $95,678 APPLICATIONS DENIED 35 $86,401 15 $173,923 22 $99,110 APPLICATIONS WITHDRAWN 6 $128,965 3 $196,830 3 $65,667 FILES CLOSED FOR INCOMPLETENESS 5 $113,778 0 $0 0 $0
Aggregated Statistics For Year 2007(Based on 27 full and 9 partial tracts) A) Conventional B) Refinancings C) Non-occupant Loans on D) Loans On Manufactured Number Average Value Number Average Value Number Average Value Number Average Value
LOANS ORIGINATED 481 $104,808 185 $116,305 109 $88,005 1 $36,640 APPLICATIONS APPROVED, NOT ACCEPTED 43 $91,609 28 $130,045 10 $78,193 0 $0 APPLICATIONS DENIED 12 $114,059 7 $89,590 1 $47,000 0 $0 APPLICATIONS WITHDRAWN 15 $111,057 10 $124,562 2 $96,825 0 $0 FILES CLOSED FOR INCOMPLETENESS 4 $84,070 1 $131,000 0 $0 0 $0
Aggregated Statistics For Year 2006(Based on 27 full and 9 partial tracts) A) Conventional B) Refinancings C) Non-occupant Loans on D) Loans On Manufactured Number Average Value Number Average Value Number Average Value Number Average Value
LOANS ORIGINATED 258 $103,899 111 $111,574 57 $87,883 1 $61,070 APPLICATIONS APPROVED, NOT ACCEPTED 18 $102,963 26 $116,677 9 $87,540 0 $0 APPLICATIONS DENIED 1 $35,000 5 $136,644 3 $78,740 0 $0 APPLICATIONS WITHDRAWN 10 $87,092 6 $109,712 3 $81,333 0 $0 FILES CLOSED FOR INCOMPLETENESS 2 $109,000 0 $0 0 $0 0 $0
Aggregated Statistics For Year 2005(Based on 27 full and 9 partial tracts) A) Conventional B) Refinancings C) Non-occupant Loans on D) Loans On Manufactured Number Average Value Number Average Value Number Average Value Number Average Value
LOANS ORIGINATED 188 $98,561 204 $102,983 75 $83,353 2 $88,500 APPLICATIONS APPROVED, NOT ACCEPTED 17 $96,891 39 $117,446 8 $89,980 0 $0 APPLICATIONS DENIED 11 $77,727 2 $132,500 4 $67,250 0 $0 APPLICATIONS WITHDRAWN 7 $86,700 8 $99,000 3 $53,910 0 $0 FILES CLOSED FOR INCOMPLETENESS 0 $0 4 $112,500 1 $51,000 0 $0
Aggregated Statistics For Year 2004(Based on 27 full and 9 partial tracts) A) Conventional B) Refinancings C) Non-occupant Loans on D) Loans On Manufactured Number Average Value Number Average Value Number Average Value Number Average Value
LOANS ORIGINATED 278 $104,270 285 $105,819 140 $83,768 2 $56,870 APPLICATIONS APPROVED, NOT ACCEPTED 54 $110,436 79 $105,345 30 $91,862 0 $0 APPLICATIONS DENIED 11 $85,507 3 $74,160 10 $87,915 0 $0 APPLICATIONS WITHDRAWN 15 $100,275 20 $104,940 7 $85,301 0 $0 FILES CLOSED FOR INCOMPLETENESS 1 $99,000 4 $84,278 2 $98,000 0 $0
Aggregated Statistics For Year 2003(Based on 27 full and 9 partial tracts) A) Conventional B) Refinancings C) Non-occupant Loans on Number Average Value Number Average Value Number Average Value
LOANS ORIGINATED 358 $103,843 670 $104,833 139 $82,512 APPLICATIONS APPROVED, NOT ACCEPTED 41 $119,542 138 $113,533 29 $121,924 APPLICATIONS DENIED 7 $108,019 13 $109,555 6 $86,365 APPLICATIONS WITHDRAWN 6 $93,513 31 $115,379 4 $89,665 FILES CLOSED FOR INCOMPLETENESS 0 $0 0 $0 0 $0
Aggregated Statistics For Year 2002(Based on 29 full and 9 partial tracts) A) Conventional B) Refinancings C) Non-occupant Loans on Number Average Value Number Average Value Number Average Value
LOANS ORIGINATED 344 $104,945 497 $102,497 114 $77,586 APPLICATIONS APPROVED, NOT ACCEPTED 39 $93,397 93 $98,836 17 $68,655 APPLICATIONS DENIED 5 $79,954 8 $109,878 8 $95,034 APPLICATIONS WITHDRAWN 13 $103,495 39 $100,006 13 $86,464 FILES CLOSED FOR INCOMPLETENESS 1 $175,400 1 $90,000 0 $0
Aggregated Statistics For Year 2001(Based on 27 full and 9 partial tracts) A) Conventional B) Refinancings C) Non-occupant Loans on Number Average Value Number Average Value Number Average Value
LOANS ORIGINATED 329 $99,249 453 $99,976 99 $73,129 APPLICATIONS APPROVED, NOT ACCEPTED 56 $88,222 82 $100,307 17 $77,819 APPLICATIONS DENIED 4 $85,152 18 $93,252 5 $78,240 APPLICATIONS WITHDRAWN 4 $104,982 16 $104,015 3 $115,643 FILES CLOSED FOR INCOMPLETENESS 1 $76,020 1 $239,660 0 $0
Aggregated Statistics For Year 2000(Based on 28 full and 9 partial tracts) A) Conventional B) Refinancings C) Non-occupant Loans on Number Average Value Number Average Value Number Average Value
LOANS ORIGINATED 318 $95,383 196 $78,751 80 $70,420 APPLICATIONS APPROVED, NOT ACCEPTED 30 $91,444 38 $91,171 13 $83,260 APPLICATIONS DENIED 20 $80,968 23 $77,769 11 $59,273 APPLICATIONS WITHDRAWN 11 $88,036 5 $81,548 4 $71,000 FILES CLOSED FOR INCOMPLETENESS 3 $94,000 4 $60,250 5 $57,800
Aggregated Statistics For Year 1999(Based on 29 full and 8 partial tracts) A) Conventional B) Refinancings C) Non-occupant Loans on Number Average Value Number Average Value Number Average Value
LOANS ORIGINATED 268 $96,139 198 $92,414 53 $67,436 APPLICATIONS APPROVED, NOT ACCEPTED 20 $86,228 27 $87,606 8 $67,279 APPLICATIONS DENIED 17 $91,232 11 $82,545 4 $103,485 APPLICATIONS WITHDRAWN 6 $49,833 13 $80,838 3 $32,220 FILES CLOSED FOR INCOMPLETENESS 4 $98,738 2 $105,895 2 $102,000
Fire-safe hotels and motels in Pueblo, Colorado:
Ramada Inn Pueblo, 4703 N Fwy, Pueblo, Colorado 81008 Phone: (719) 544-4700, Fax: (719) 544-6526
Rodeway Inn, 960 Hwy 50 W, Pueblo, Colorado 81008 Phone: (719) 583-0333, Fax: (719) 583-0332
Baymont Inn & Suites, 3626 N Fwy, Pueblo, Colorado 81008 Phone: (719) 583-4000, Fax: (719) 583-4083
Courtyard By Marriott Pueblo, 110 W 1ST St, Pueblo, Colorado 81003 Phone: (719) 542-3200
Wingate Inn Pueblo, 4711 N Elizabeth St, Pueblo, Colorado 81008 Phone: (719) 586-9000, Fax: (719) 586-9000
Pueblo Clarion Inn, 4001 N Elizabeth St, Pueblo, Colorado 81008 Phone: (719) 543-8050, Fax: (719) 545-2271
Econo Lodge, 4615 N Elizabeth St, Pueblo, Colorado 81008 Phone: (719) 542-9933, Fax: (719) 543-2871
Comfort Inn, 77 S Radnor Dr, Pueblo, Colorado 81007 Phone: (719) 547-9400, Fax: (719) 647-9048
9 other hotels and motels
All 17 fire-safe hotels and motels in Pueblo, Colorado
Most common first names in Pueblo, CO among deceased individuals Name Count Lived (average)
Mary 1,143 80.0 years John 1,046 75.6 years William 694 74.1 years James 574 72.8 years Robert 564 70.7 years Charles 514 74.2 years Frank 493 76.5 years Joe 491 75.9 years George 446 75.3 years Joseph 373 73.9 years
Most common last names in Pueblo, CO among deceased individuals Last name Count Lived (average)
Martinez 470 71.5 years Trujillo 312 70.9 years Smith 304 77.4 years Johnson 265 78.6 years Garcia 222 73.3 years Vigil 204 70.7 years Gonzales 203 74.0 years Williams 177 76.5 years Brown 165 77.2 years Lucero 163 71.1 years
Pueblo compared to Colorado state average:
Median household income below state average. Median house value below state average. Unemployed percentage below state average. Hispanic race population percentage above state average. Foreign-born population percentage below state average. House age above state average. Institutionalized population percentage above state average. Pueblo, CO compared to other similar cities:
#4 on the list of "Top 101 cities with largest percentage of females in industries: health care and social assistance (population 50,000+)"
#5 on the list of "Top 101 cities with the smallest sunshine amount differences during a year (population 50,000+)"
#12 on the list of "Top 101 cities with the largest differences between daily high and daily low temperatures (population 50,000+)"
#18 on the list of "Top 101 cities with largest percentage of males in industries: utilities (population 50,000+)"
#22 on the list of "Top 101 cities with largest percentage of females in occupations: healthcare support occupations (population 50,000+)"
#22 on the list of "Top 101 cities with the largest city-data.com crime index increase from 2002 to 2012 (population 50,000+)"
#25 on the list of "Top 100 least-safe cities (highest city-data.com crime index) (pop. 50,000+)"
#28 on the list of "Top 101 cities with largest percentage of males in occupations: transportation occupations (population 50,000+)"
#29 on the list of "Top 100 highest located cities (pop. 50,000+)"
#30 on the list of "Top 101 cities with largest percentage of females in occupations: community and social service occupations (population 50,000+)"
#34 on the list of "Top 101 cities with the highest number of thefts per 100,000 residents, excludes tourist destinations and others with a lot of outsiders visiting based on city industries data (population 50,000+)"
#36 on the list of "Top 101 cities with the highest number of burglaries per 100,000 residents, excludes tourist destinations and others with a lot of outsiders visiting based on city industries data (population 50,000+)"
#57 on the list of "Top 101 cities with the lowest average humidity (population 50,000+)"
#60 on the list of "Top 101 cities with largest percentage of males in occupations: construction and extraction occupations (population 50,000+)"
#60 on the list of "Top 101 cities with the lowest maximum monthly morning or afternoon humidity (population 50,000+)"
#66 on the list of "Top 101 cities with largest percentage of males in occupations: law enforcement workers including supervisors (population 50,000+)"
#67 on the list of "Top 101 cities with largest percentage of females in industries: accommodation and food services (population 50,000+)"
#72 on the list of "Top 101 cities with largest percentage of males in occupations: food preparation and serving related occupations (population 50,000+)"
#73 on the list of "Top 101 cities with the largest city-data.com crime index per police officer (population 50,000+)"
#77 on the list of "Top 101 cities with largest percentage of males in industries: accommodation and food services (population 50,000+)"
#57 on the list of "Top 101 counties with the smallest number of children under 18 without health insurance coverage in 2000 (pop. 50,000+)"
#93 on the list of "Top 101 counties with the lowest Particulate Matter (PM2.5 ) Annual air pollution readings in 2012 (µg/m3 )"
Top Patent Applicants
James Scott Hacsi (5)
Stefan G. Siegel (5)
Brian B. Elson (5)
Stephen D. Szarkowski (4)
James William Fahrny (4)
Brian C. Large (4)
Rodney R. Mishmash (4)
John Linck (4)
Kathryn J. Chavez (3)
John Miller Conn (3)
Total of 114 patent applications in 2008-2024.
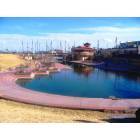

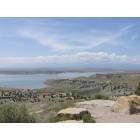
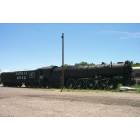
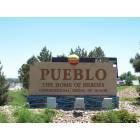
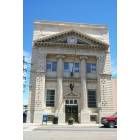
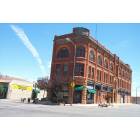
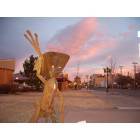
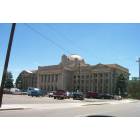
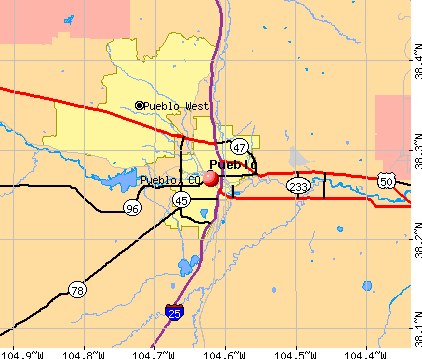


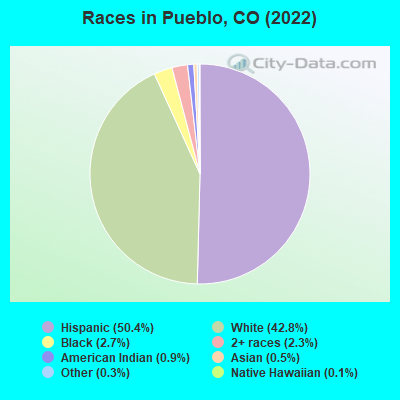
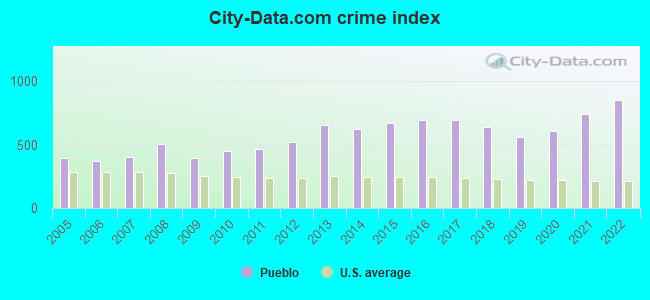
 Recent articles from our blog. Our writers, many of them Ph.D. graduates or candidates, create easy-to-read articles on a wide variety of topics.

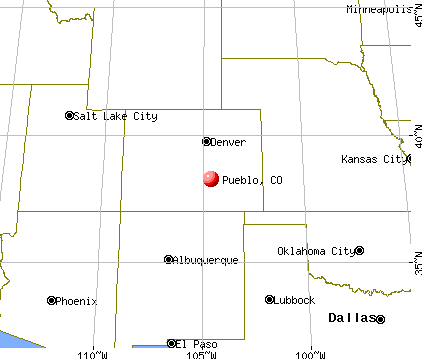
 (42.3 miles
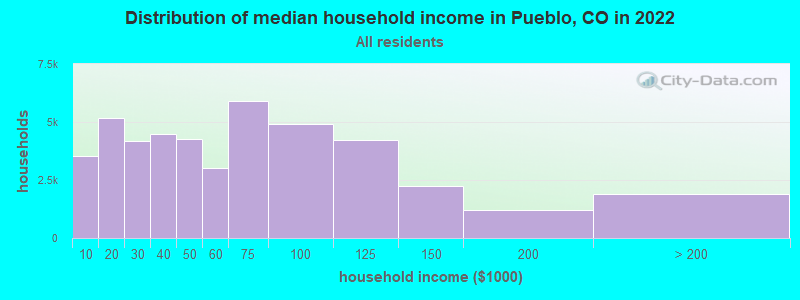
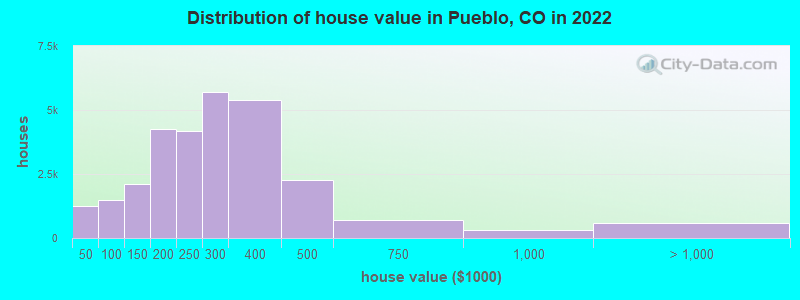

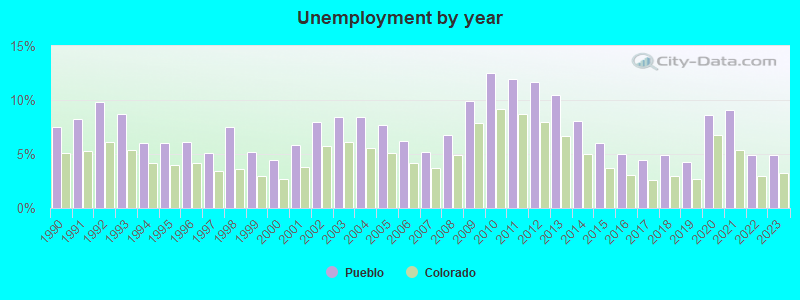
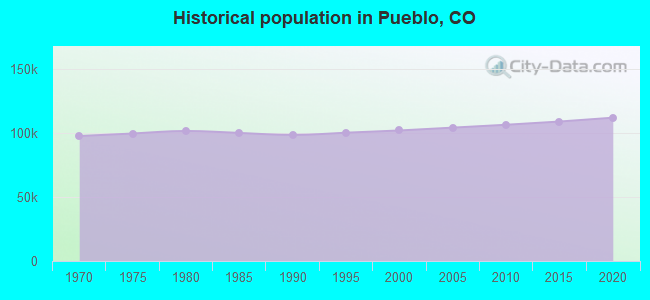
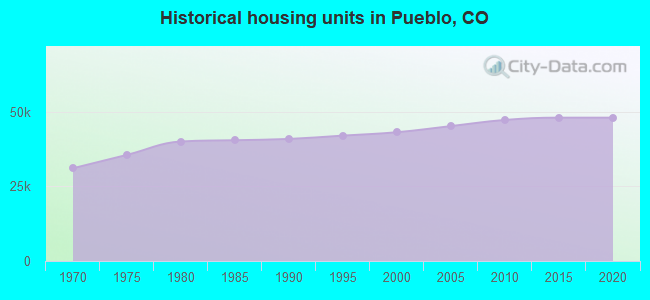
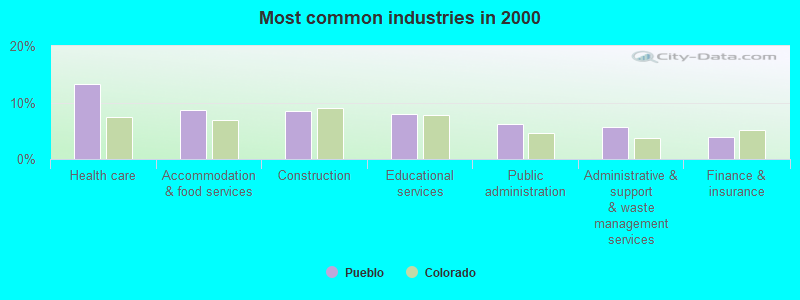
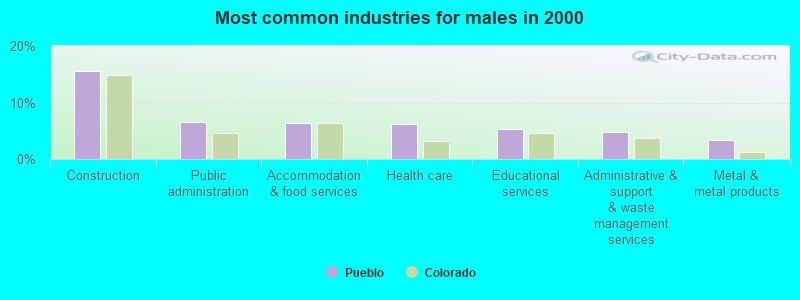
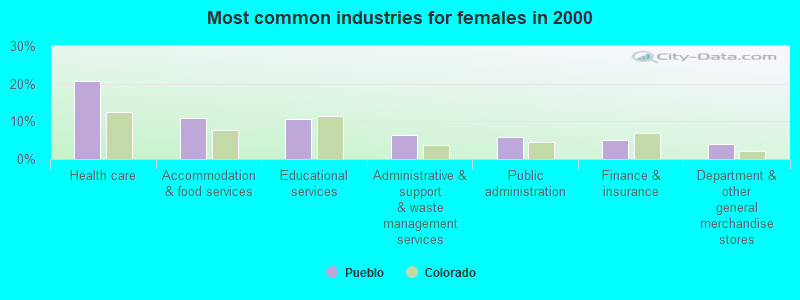
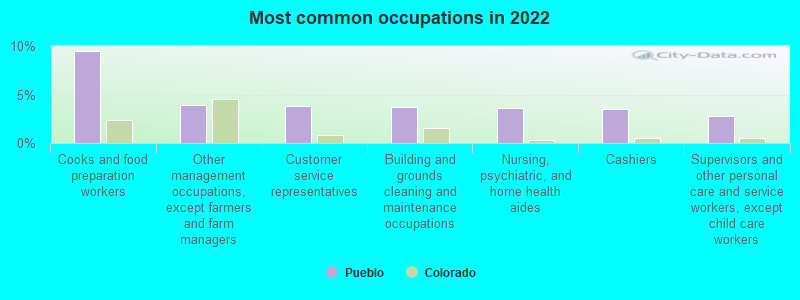
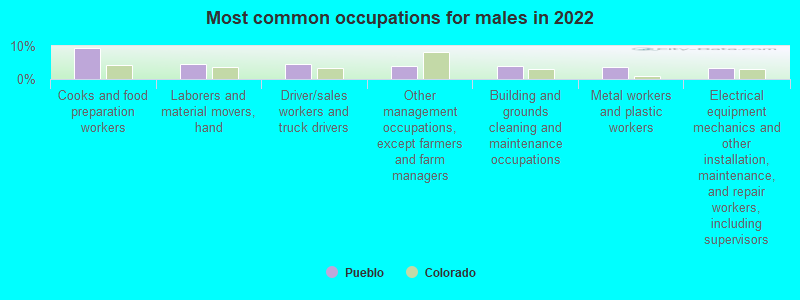
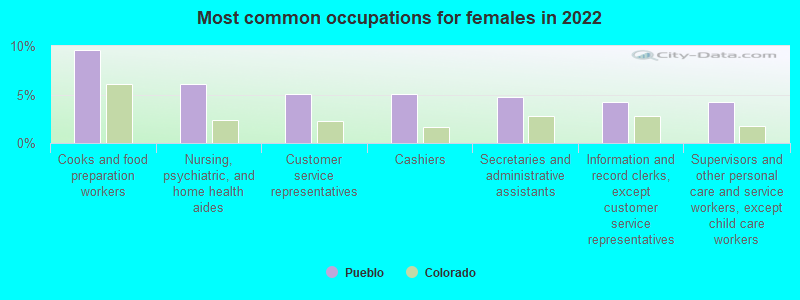

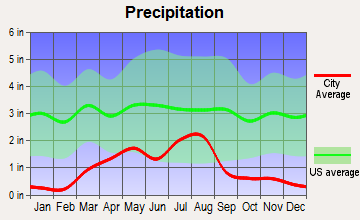
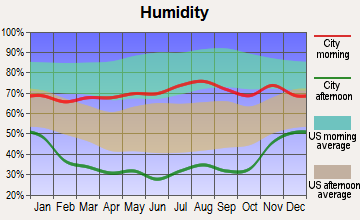
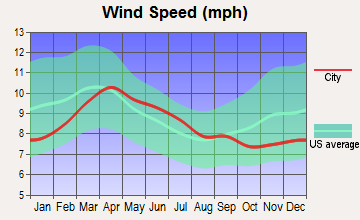
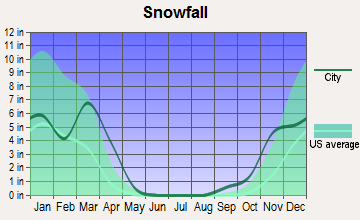
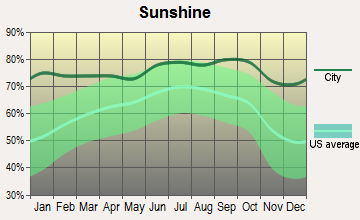
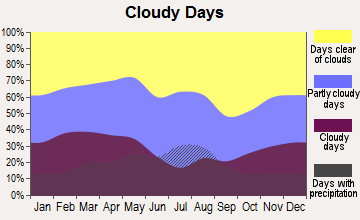
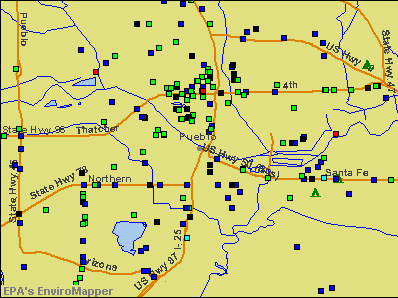

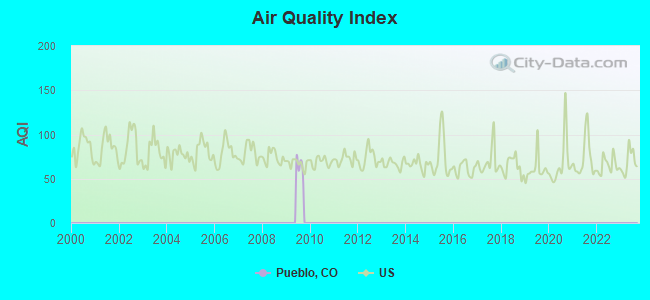
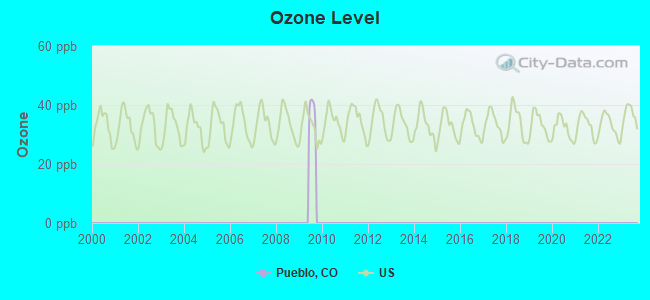
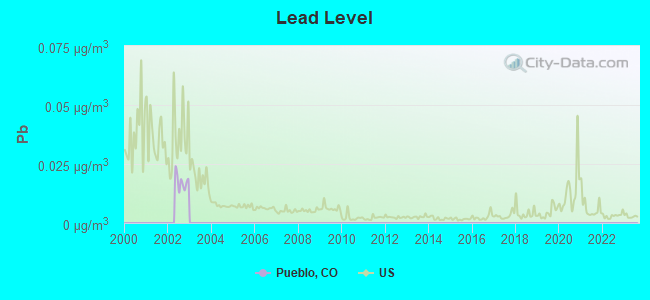

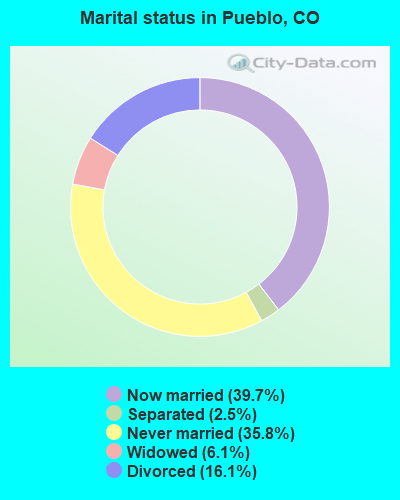

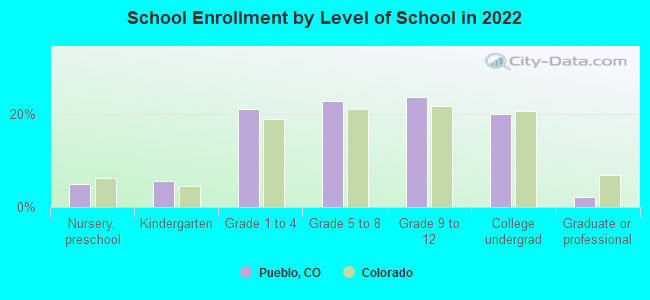
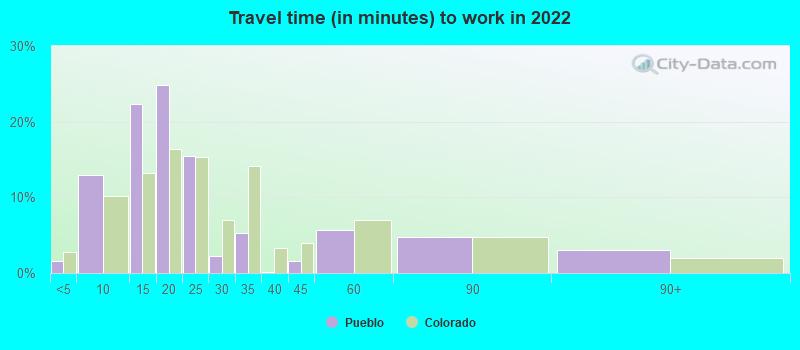
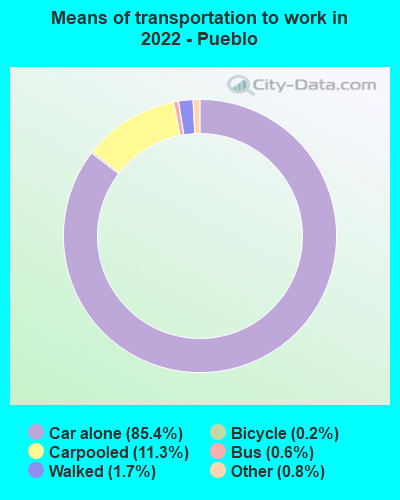
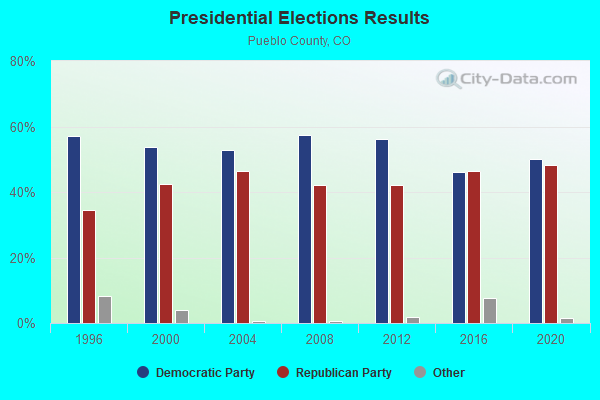
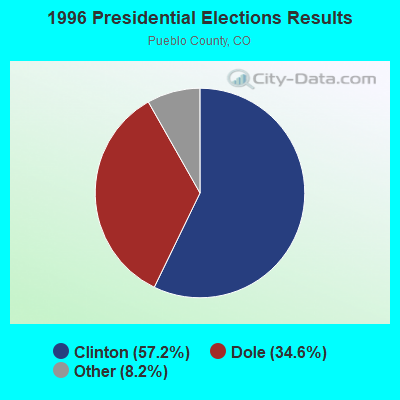
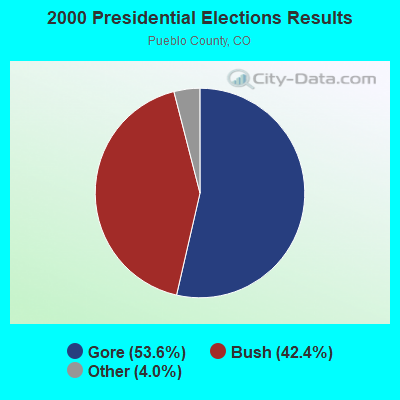
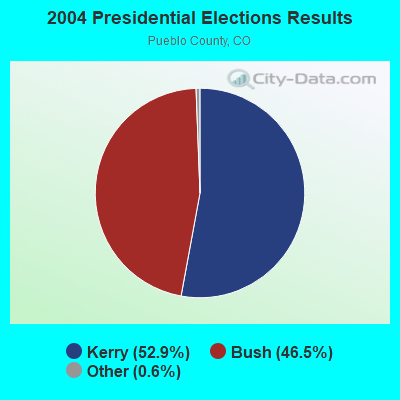

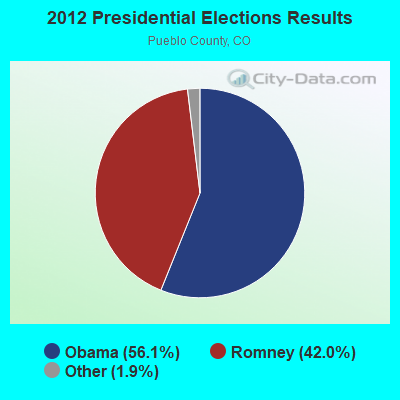
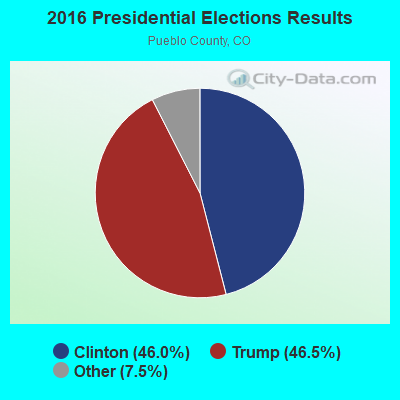
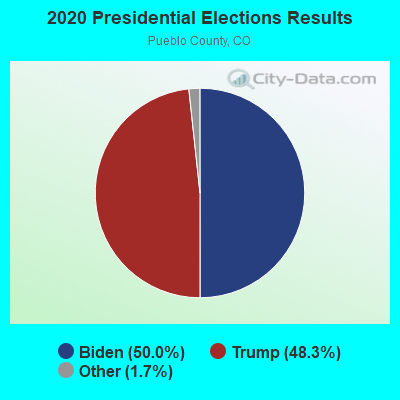
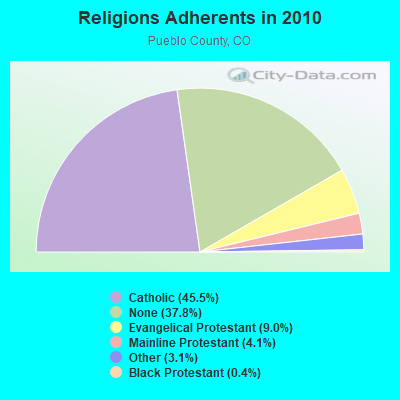
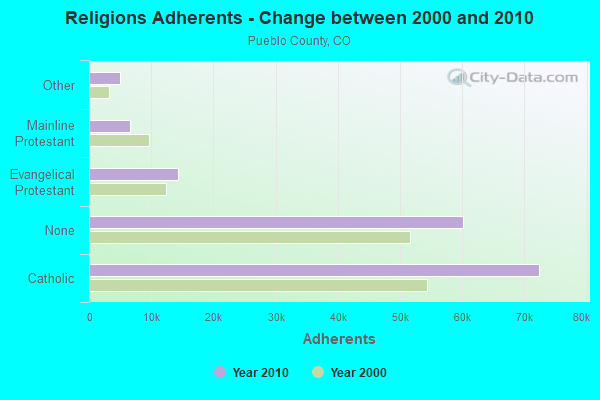
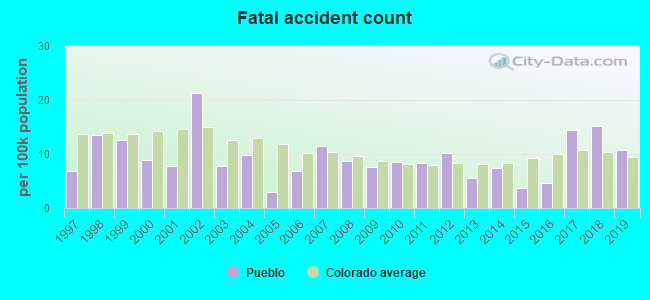
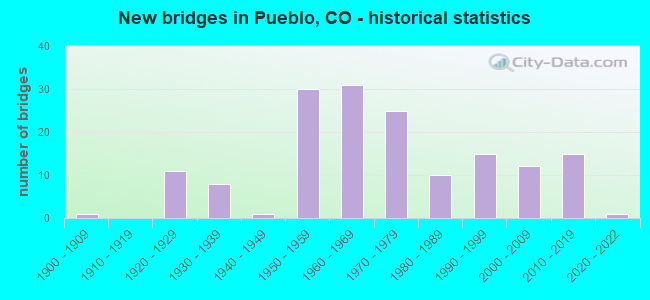
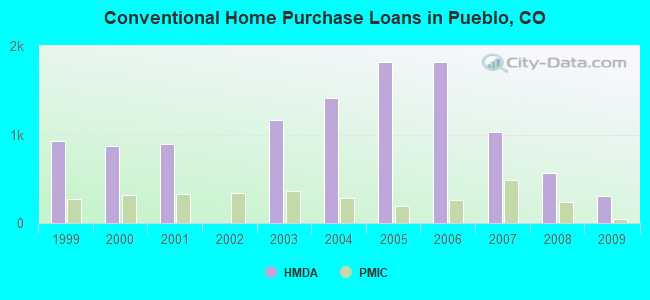
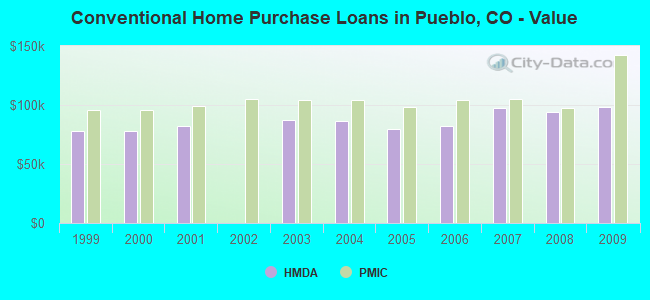
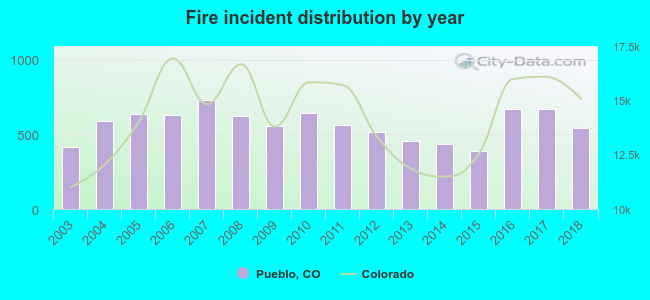 According to the data from the years 2003 - 2018 the average number of fires per year is 567. The highest number of fire incidents - 728 took place in 2007, and the least - 388 in 2015. The data has a growing trend.
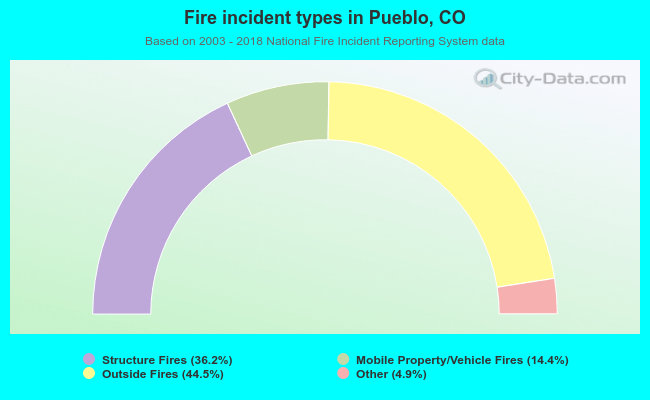 When looking into fire subcategories, the most incidents belonged to: Outside Fires (44.5%), and Structure Fires (36.2%).