Estimated zip code population in 2022: 27,134 Zip code population in 2010: 27,400 Zip code population in 2000: 23,230
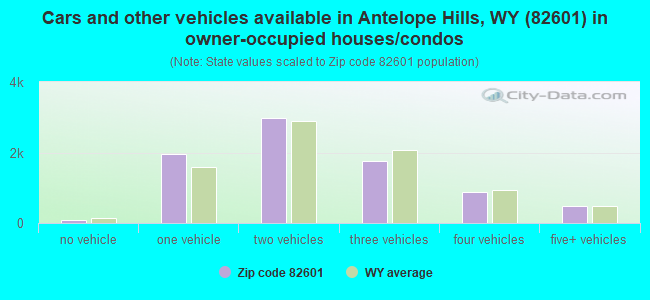
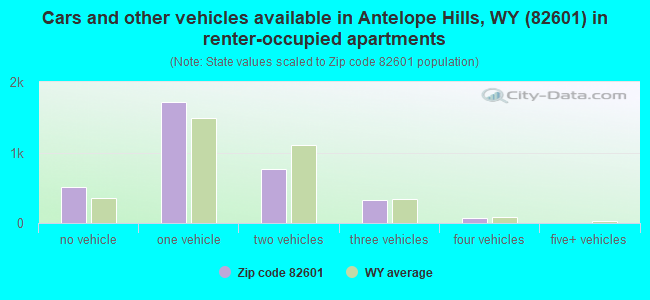
Houses and condos: 13,087 Renter-occupied apartments: 3,391
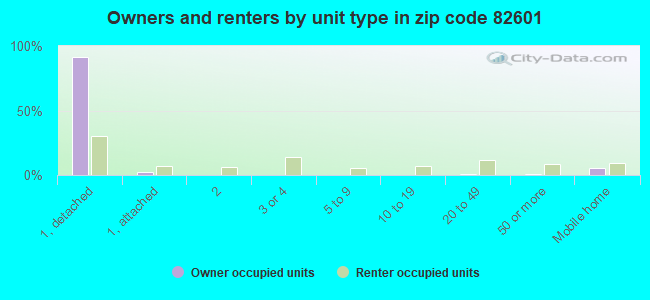
% of renters here:
29%
State:
27%
March 2022 cost of living index in zip code 82601: 81.6 (low, U.S. average is 100)
Land area: 570.2 sq. mi. Water area: 2.0 sq. mi.
Population density: 48 people per square mile
(very low).
OSM Map
General Map
Google Map
MSN Map
OSM Map
General Map
Google Map
MSN Map
OSM Map
General Map
Google Map
MSN Map
OSM Map
General Map
Google Map
MSN Map
Please wait while loading the map...
Real estate property taxes paid for housing units in 2022:
This zip code:
0.6% ($1,484)
Wyoming:
0.6% ($1,609)
Median real estate property taxes paid for housing units with mortgages in 2022: $1,527 (0.6%) Median real estate property taxes paid for housing units with no mortgage in 2022: $1,428 (0.6%)
Business Search- 14 Million verified businesses
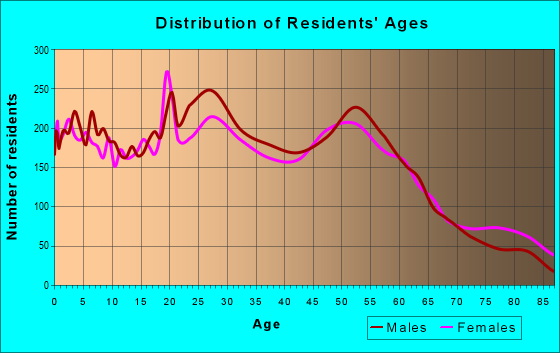
Males: 14,116
(52.0%)
Females: 13,017
(48.0%)
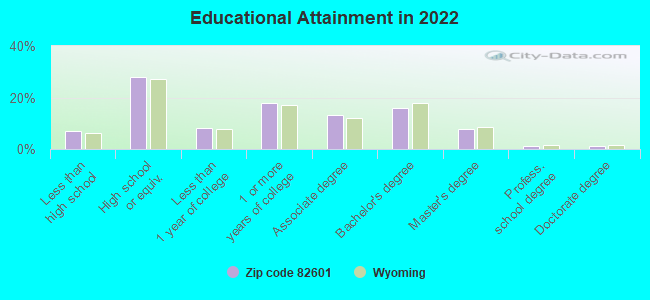
For population 25 years and over in 82601:
High school or higher: 92.9%
Bachelor's degree or higher: 25.6%
Graduate or professional degree: 9.8%
Unemployed: 2.7%
Mean travel time to work (commute): 17.0 minutes
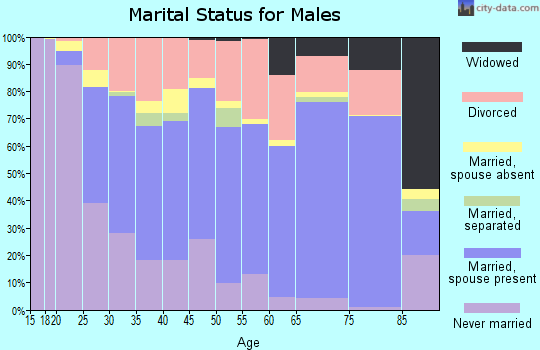
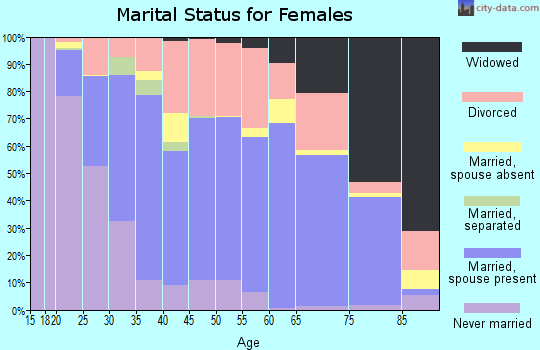
For population 15 years and over in 82601:
Never married: 33.4%
Now married: 44.9%
Separated: 1.1%
Widowed: 5.1%
Divorced: 15.5%
Zip code 82601 compared to state average:
Black race population percentage significantly below state average.
Foreign-born population percentage below state average.
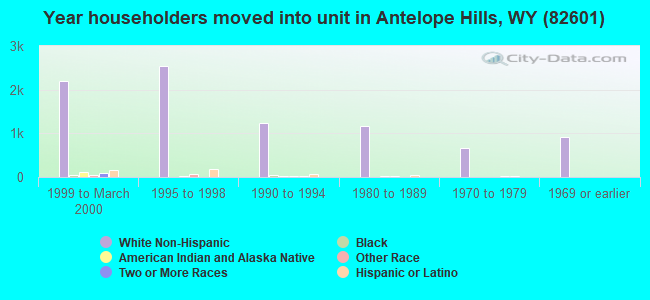
Length of stay since moving in significantly above state average.
Averages for the 2020 tax year for zip code 82601, filed in 2021:
Average Adjusted Gross Income (AGI) in 2020: $68,655 (Individual Income Tax Returns)
Here:
$68,655
State:
$93,756
Salary/wage: $50,480 (reported on 85.6% of returns)
Here:
$50,480
State:
$58,022
(% of AGI for various income ranges: 1217.0% for AGIs below $25k, 3567.2% for AGIs $25k-50k, 6303.6% for AGIs $50k-75k, 9293.9% for AGIs $75k-100k, 16309.8% for AGIs $100k-200k, 62058.5% for AGIs over 200k)
Taxable interest for individuals: $1,752 (reported on 25.9% of returns)
This zip code:
$1,752
Wyoming:
$3,185
(% of AGI for various income ranges: 13.1% for AGIs below $25k, 14.0% for AGIs $25k-50k, 38.7% for AGIs $50k-75k, 53.7% for AGIs $75k-100k, 98.9% for AGIs $100k-200k, 2199.2% for AGIs over 200k)
Ordinary dividends: $10,362 (reported on 15.6% of returns)
Here:
$10,362
State:
$18,054
(% of AGI for various income ranges: 23.2% for AGIs below $25k, 41.1% for AGIs $25k-50k, 104.6% for AGIs $50k-75k, 158.3% for AGIs $75k-100k, 271.5% for AGIs $100k-200k, 9746.9% for AGIs over 200k)
Net capital gain/loss in AGI: +$20,070 (reported on 15.3% of returns)
Here:
+$20,070
State:
+$61,860
(% of AGI for various income ranges: 11.3% for AGIs below $25k, 21.8% for AGIs $25k-50k, 60.9% for AGIs $50k-75k, 104.1% for AGIs $75k-100k, 507.8% for AGIs $100k-200k, 23087.7% for AGIs over 200k)
Profit/loss from business: +$14,343 (reported on 14.0% of returns)
Here:
+$14,343
State:
+$12,816
(% of AGI for various income ranges: 91.9% for AGIs below $25k, 154.0% for AGIs $25k-50k, 209.4% for AGIs $50k-75k, 328.5% for AGIs $75k-100k, 714.2% for AGIs $100k-200k, 4087.7% for AGIs over 200k)
Taxable individual retirement arrangement distribution: $22,556 (reported on 8.1% of returns)
82601:
$22,556
Wyoming:
$22,959
(% of AGI for various income ranges: 37.4% for AGIs below $25k, 78.7% for AGIs $25k-50k, 191.7% for AGIs $50k-75k, 244.6% for AGIs $75k-100k, 736.6% for AGIs $100k-200k, 5702.3% for AGIs over 200k)
Self-employed (Keogh) retirement plans: $20,075 (reported on 0.3% of returns)
82601:
$20,075
Wyoming:
$25,938
(% of AGI for various income ranges: 13.4% for AGIs $25k-50k, 362.3% for AGIs over 200k)
Total itemized deductions: $46,528 (reported on 4.4% of returns)
Here:
$46,528
State:
$59,861
(% of AGI for various income ranges: 31.5% for AGIs below $25k, 60.0% for AGIs $25k-50k, 169.9% for AGIs $50k-75k, 241.6% for AGIs $75k-100k, 397.9% for AGIs $100k-200k, 11126.9% for AGIs over 200k)
Charity contributions: $24,746 (reported on 3.4% of returns)
Here:
$24,746
State:
$40,531
(% of AGI for various income ranges: 1.8% for AGIs below $25k, 8.9% for AGIs $25k-50k, 30.8% for AGIs $50k-75k, 34.1% for AGIs $75k-100k, 124.8% for AGIs $100k-200k, 6119.2% for AGIs over 200k)
Taxes paid: $4,839 (reported on 4.4% of returns)
82601:
$4,839
State:
$5,690
(% of AGI for various income ranges: 2.4% for AGIs below $25k, 6.7% for AGIs $25k-50k, 21.6% for AGIs $50k-75k, 37.2% for AGIs $75k-100k, 65.1% for AGIs $100k-200k, 874.6% for AGIs over 200k)
Earned income credit: $1,990 (reported on 17.5% of returns)
Here:
$1,990
State:
$2,106
(% of AGI for various income ranges: 84.7% for AGIs below $25k, 63.6% for AGIs $25k-50k, 1.3% for AGIs $50k-75k)
Percentage of individuals using paid preparers for their 2020 taxes: 94.4%
Here:
94%
State:
94%
(% for various income ranges: 92.8% for AGIs below $25k, 95.1% for AGIs $25k-50k, 95.1% for AGIs $50k-75k, 96.5% for AGIs $75k-100k, 94.9% for AGIs $100k-200k, 95.6% for AGIs over 200k)
Averages for the 2012 tax year for zip code 82601, filed in 2013:
Average Adjusted Gross Income (AGI) in 2012: $60,253 (Individual Income Tax Returns)
Here:
$60,253
State:
$69,135
Salary/wage: $47,730 (reported on 85.8% of returns)
Here:
$47,730
State:
$48,877
(% of AGI for various income ranges: 75.4% for AGIs below $25k, 80.9% for AGIs $25k-50k, 80.6% for AGIs $50k-75k, 82.9% for AGIs $75k-100k, 78.9% for AGIs $100k-200k, 37.8% for AGIs over 200k)
Taxable interest for individuals: $1,963 (reported on 24.5% of returns)
This zip code:
$1,963
Wyoming:
$3,063
(% of AGI for various income ranges: 1.2% for AGIs below $25k, 0.6% for AGIs $25k-50k, 0.7% for AGIs $50k-75k, 0.6% for AGIs $75k-100k, 0.5% for AGIs $100k-200k, 1.1% for AGIs over 200k)
Ordinary dividends: $9,962 (reported on 19.3% of returns)
Here:
$9,962
State:
$14,293
(% of AGI for various income ranges: 9.7% for AGIs below $25k, 3.7% for AGIs $25k-50k, 1.9% for AGIs $50k-75k, 1.1% for AGIs $75k-100k, 1.7% for AGIs $100k-200k, 3.7% for AGIs over 200k)
Net capital gain/loss in AGI: +$14,572 (reported on 12.9% of returns)
Here:
+$14,572
State:
+$37,851
(% of AGI for various income ranges: 0.2% for AGIs below $25k, 0.5% for AGIs $25k-50k, 0.8% for AGIs $50k-75k, 0.8% for AGIs $75k-100k, 2.0% for AGIs $100k-200k, 8.4% for AGIs over 200k)
Profit/loss from business: +$23,198 (reported on 12.1% of returns)
Here:
+$23,198
State:
+$13,804
(% of AGI for various income ranges: 3.9% for AGIs below $25k, 3.3% for AGIs $25k-50k, 3.1% for AGIs $50k-75k, 2.3% for AGIs $75k-100k, 4.1% for AGIs $100k-200k, 7.9% for AGIs over 200k)
Taxable individual retirement arrangement distribution: $15,404 (reported on 7.3% of returns)
82601:
$15,404
Wyoming:
$18,551
(% of AGI for various income ranges: 1.8% for AGIs below $25k, 1.7% for AGIs $25k-50k, 1.7% for AGIs $50k-75k, 2.2% for AGIs $75k-100k, 2.3% for AGIs $100k-200k, 1.6% for AGIs over 200k)
Self-employment retirement plans: $24,512 (reported on 0.6% of returns)
82601:
$24,512
Wyoming:
$19,269
(% of AGI for various income ranges: 0.2% for AGIs $25k-50k, 0.2% for AGIs $100k-200k, 0.6% for AGIs over 200k)
Total itemized deductions: $21,695 (16% of AGI, reported on 20.9% of returns)
Here:
$21,695
State:
$25,377
Here:
15.9% of AGI
State:
15.6% of AGI
(% of AGI for various income ranges: 4.2% for AGIs below $25k, 7.1% for AGIs $25k-50k, 7.9% for AGIs $50k-75k, 7.5% for AGIs $75k-100k, 8.9% for AGIs $100k-200k, 7.6% for AGIs over 200k)
Charity contributions: $6,952 (reported on 13.4% of returns)
Here:
$6,952
State:
$7,424
(% of AGI for various income ranges: 0.5% for AGIs below $25k, 0.6% for AGIs $25k-50k, 0.9% for AGIs $50k-75k, 1.0% for AGIs $75k-100k, 1.3% for AGIs $100k-200k, 3.2% for AGIs over 200k)
Taxes paid: $3,695 (reported on 20.5% of returns)
82601:
$3,695
State:
$4,979
(% of AGI for various income ranges: 0.5% for AGIs below $25k, 0.8% for AGIs $25k-50k, 1.4% for AGIs $50k-75k, 1.3% for AGIs $75k-100k, 1.7% for AGIs $100k-200k, 1.3% for AGIs over 200k)
Earned income credit: $1,953 (reported on 15.8% of returns)
Here:
$1,953
State:
$1,989
(% of AGI for various income ranges: 4.7% for AGIs below $25k, 0.8% for AGIs $25k-50k)
Percentage of individuals using paid preparers for their 2012 taxes: 44.7%
Here:
45%
State:
50%
(% for various income ranges: 35.9% for AGIs below $25k, 43.1% for AGIs $25k-50k, 48.5% for AGIs $50k-75k, 52.2% for AGIs $75k-100k, 59.1% for AGIs $100k-200k, 83.7% for AGIs over 200k)
Averages for the 2004 tax year for zip code 82601, filed in 2005:
Average Adjusted Gross Income (AGI) in 2004: $44,154 (Individual Income Tax Returns)
Here:
$44,154
State:
$50,131
Salary/wage: $34,543 (reported on 86.9% of returns)
Here:
$34,543
State:
$37,659
(% of AGI for various income ranges: 149.0% for AGIs below $10k, 82.1% for AGIs $10k-25k, 83.6% for AGIs $25k-50k, 80.9% for AGIs $50k-75k, 78.0% for AGIs $75k-100k, 42.8% for AGIs over 100k)
Taxable interest for individuals: $2,279 (reported on 36.5% of returns)
This zip code:
$2,279
Wyoming:
$2,408
(% of AGI for various income ranges: 6.0% for AGIs below $10k, 1.9% for AGIs $10k-25k, 1.0% for AGIs $25k-50k, 1.3% for AGIs $50k-75k, 1.2% for AGIs $75k-100k, 2.7% for AGIs over 100k)
Taxable dividends: $4,568 (reported on 21.4% of returns)
Here:
$4,568
State:
$6,819
(% of AGI for various income ranges: 5.2% for AGIs below $10k, 1.6% for AGIs $10k-25k, 1.0% for AGIs $25k-50k, 1.5% for AGIs $50k-75k, 1.9% for AGIs $75k-100k, 3.4% for AGIs over 100k)
Net capital gain/loss: +$15,722 (reported on 18.1% of returns)
Here:
+$15,722
State:
+$23,705
(% of AGI for various income ranges: -2.0% for AGIs below $10k, -0.1% for AGIs $10k-25k, 0.9% for AGIs $25k-50k, 1.4% for AGIs $50k-75k, 1.8% for AGIs $75k-100k, 15.6% for AGIs over 100k)
Profit/loss from business: +$15,853 (reported on 14.2% of returns)
Here:
+$15,853
State:
+$10,523
(% of AGI for various income ranges: 3.9% for AGIs below $10k, 3.9% for AGIs $10k-25k, 3.4% for AGIs $25k-50k, 3.3% for AGIs $50k-75k, 4.4% for AGIs $75k-100k, 7.6% for AGIs over 100k)
IRA payment deduction: $2,687 (reported on 2.8% of returns)
82601:
$2,687
Wyoming:
$2,989
(% of AGI for various income ranges: 0.2% for AGIs $10k-25k, 0.3% for AGIs $25k-50k, 0.2% for AGIs $50k-75k, 0.2% for AGIs $75k-100k, 0.1% for AGIs over 100k)
Self-employed pension: $16,082 (reported on 1.1% of returns)
Here:
$16,082
Wyoming:
$14,169
(% of AGI for various income ranges: 0.1% for AGIs $25k-50k, 0.1% for AGIs $50k-75k, 0.3% for AGIs $75k-100k, 0.9% for AGIs over 100k)
Total itemized deductions: $15,933 (17% of AGI, reported on 17.3% of returns)
Here:
$15,933
State:
$18,912
Here:
17.2% of AGI
State:
17.8% of AGI
(% of AGI for various income ranges: 7.8% for AGIs below $10k, 4.3% for AGIs $10k-25k, 6.3% for AGIs $25k-50k, 6.8% for AGIs $50k-75k, 8.6% for AGIs $75k-100k, 5.7% for AGIs over 100k)
Charity contributions deductions: $4,316 (4% of AGI, reported on 13.3% of returns)
Here:
$4,316
State:
$5,489
Here:
4.1% of AGI
State:
4.7% of AGI
(% of AGI for various income ranges: 0.6% for AGIs below $10k, 0.4% for AGIs $10k-25k, 0.7% for AGIs $25k-50k, 0.8% for AGIs $50k-75k, 1.7% for AGIs $75k-100k, 2.0% for AGIs over 100k)
Total tax: $7,842 (reported on 74.7% of returns)
82601:
$7,842
State:
$8,551
(% of AGI for various income ranges: 3.4% for AGIs below $10k, 4.3% for AGIs $10k-25k, 7.2% for AGIs $25k-50k, 9.6% for AGIs $50k-75k, 11.5% for AGIs $75k-100k, 21.8% for AGIs over 100k)
Earned income credit: $1,520 (reported on 17.5% of returns)
Here:
$1,520
State:
$1,544
Percentage of individuals using paid preparers for their 2004 taxes: 58.8%
Here:
59%
State:
59%
(% for various income ranges: 51.4% for AGIs below $10k, 58.7% for AGIs $10k-25k, 58.5% for AGIs $25k-50k, 60.5% for AGIs $50k-75k, 65.3% for AGIs $75k-100k, 75.7% for AGIs over 100k)
Likely homosexual households (counted as self-reported same-sex unmarried-partner households)
Lesbian couples: 0.1% of all households
Gay men: 0.0% of all households
Household received Food Stamps/SNAP in the past 12 months: 831 Household did not receive Food Stamps/SNAP in the past 12 months: 10,721
Women who had a birth in the past 12 months: 468 (219 now married, 262 unmarried) Women who did not have a birth in the past 12 months: 5,724 (2,332 now married, 3,404 unmarried)
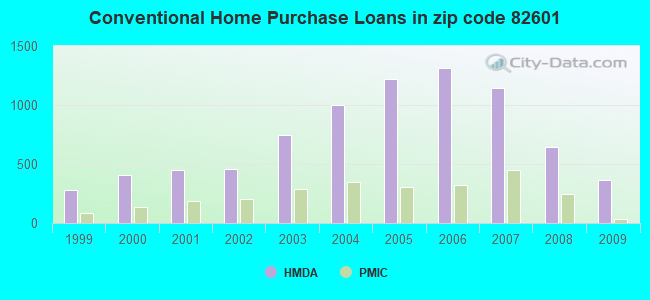
Housing units in zip code 82601 with a mortgage: 5,335 (371 second mortgage, 20 home equity loan, 133 both second mortgage and home equity loan) Houses without a mortgage: 94
Median monthly owner costs for units with a mortgage: $1,446 Median monthly owner costs for units without a mortgage: $424
Residents with income below the poverty level in 2022:
This zip code:
10.3%
Whole state:
11.8%
Residents with income below 50% of the poverty level in 2022:
This zip code:
5.9%
Whole state:
6.8%
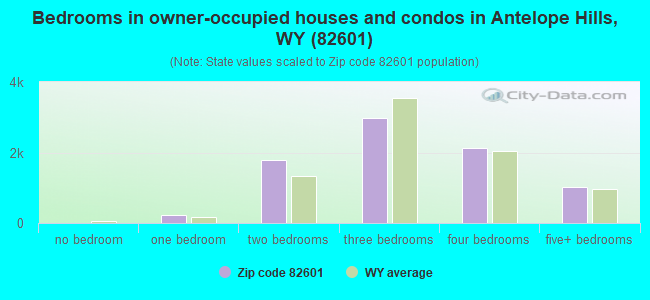
Median number of rooms in houses and condos:
Here:
6.5
State:
6.7
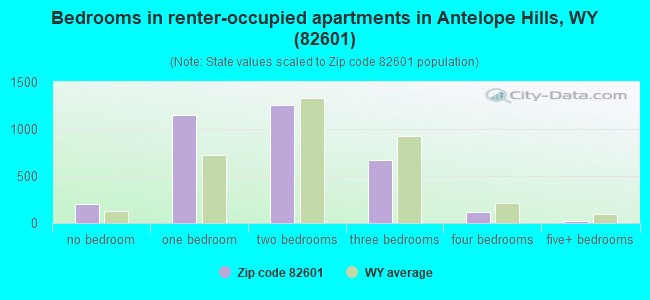
Median number of rooms in apartments:
Here:
4.0
State:
4.4
Notable locations in this zip code not listed on our city pages
Tourist attractions (not listed on the city page) : Casper Area Convention and Visitor Bureau (992 North Poplar Street), Parkway Plaza Hotel & Convention Centre (123 West E Street), Wyoming Outtfitters & Guides Association (Tours & Charters; 128 West Midwest Avenue), Restoration Fellowship (Tours & Charters; 956 North Poplar Street).
3,422 married couples with children.
1,979 single-parent households (405 men, 1,574 women).
94.5% of residents of 82601 zip code speak English at home.
3.4% of residents speak Spanish at home (80% very well, 12% well, 4% not well, 4% not at all).
1.1% of residents speak other Indo-European language at home (100% very well).
0.5% of residents speak Asian or Pacific Island language at home (95% very well, 4% well, 1% not well).
0.2% of residents speak other language at home (100% very well).
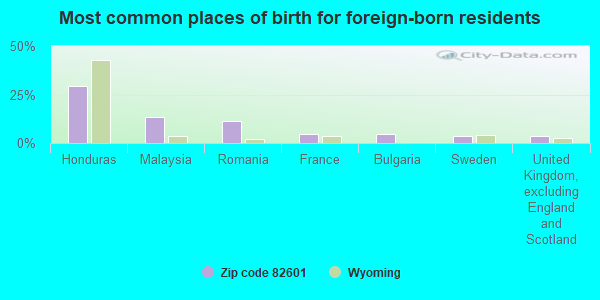
Foreign born population: 529 (2.0%) (63.3% of them are naturalized citizens)
This zip code:
2.0%
Whole state:
3.1%
30%Honduras
14%Malaysia
11%Romania
5%France
4%Bulgaria
4%Sweden
4%United Kingdom, excluding England and Scotland
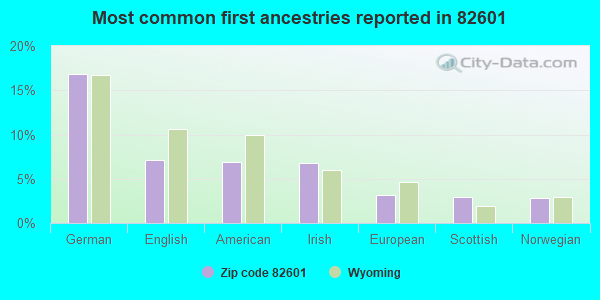
17%German
7%English
7%American
7%Irish
3%European
3%Scottish
3%Norwegian
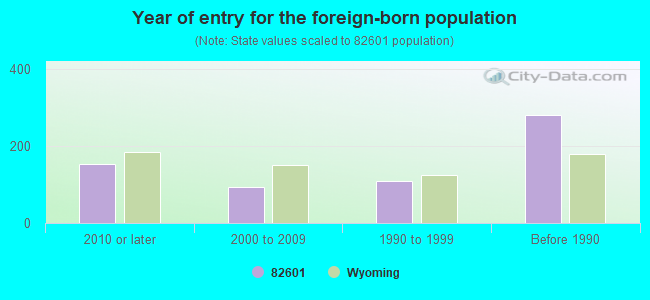
Year of entry for the foreign-born population
1532010 or later
932000 to 2009
1091990 to 1999
280Before 1990
Major facilities with environmental interests located in this zip code:
BROKEN WRENCH LLC (1510 GARDEN CREEK ROAD in CASPER, WY)
(Integrated Compliance Information System) - ICIS-08-2001-0080, FORMAL ENFORCEMENT ACTION, ICIS-08-2005-0194, ENFORCEMENT/COMPLIANCE ACTIVITY (Integrated Compliance Information System) - ICIS-08-2001-0080, FORMAL ENFORCEMENT ACTION, ICIS-08-2005-0194, ENFORCEMENT/COMPLIANCE ACTIVITY COMMUNITY WATER SYSTEM (SDWIS) - SDWIS-WY5600074 16922, WATER TREATMENT PLANT Business SIC classification: WATER SUPPLY
HOGADON SKI AREA (1800 E K STREET in CASPER, WY)
ENFORCEMENT/COMPLIANCE ACTIVITY (Integrated Compliance Information System) - ICIS-08-2001-0116, FORMAL ENFORCEMENT ACTION (Integrated Compliance Information System) - ICIS-08-2001-0116, FORMAL ENFORCEMENT ACTION
AMOCO PIPELINE TANK FARM (301 TANK FARM ROAD in CASPER, WY)
AIR MINOR (AIRS/AFS) (Integrated Compliance Information System) - ICIS-08-1992-0069, FORMAL ENFORCEMENT ACTION HAZARDOUS WASTE BIENNIAL REPORTER (Resource Conservation and Recovery Act (tracking hazardous waste)) TSD (Resource Conservation and Recovery Act (tracking hazardous waste)) Business SIC classification: COTTON; CRUDE PETROLEUM AND NATURAL GAS; PETROLEUM REFINING
GREINER MOTOR CO INC (3333 CY AVE in CASPER, WY)
(Integrated Compliance Information System) - ICIS-08-1987-0030, FORMAL ENFORCEMENT ACTION Small Quantity Generators, between 100 kg and 1000 kg of hazardous waste/month (Resource Conservation and Recovery Act (tracking hazardous waste)) - notification Business SIC classification: MOTOR VEHICLE DEALERS (NEW AND USED); BOAT DEALERS Organizations: GREINER-SCHMIDT MOTOR CO INC (CONTACT/OWNER)
Alternative names: GREINER-SCHMIDT MOTOR CO INC
BLACK HILLS BENTONITE, LLC (55 SOUTH SALT CREEK HIGHWAY in CASPER, WY)
AIR SYNTHETIC MINOR (AIRS/AFS) ENFORCEMENT/COMPLIANCE ACTIVITY (Integrated Compliance Information System) CRITERIA AND HAZARDOUS AIR POLLUTANT INVENTORY (Inventory of air pollution sources) National Pollutant Discharge Elimination System NON-MAJOR (Tracking pollutant discharge elimination systems) - permit Conditionally Exempt Small Quantity Generators, less than 100 kg/month of hazardous waste (Resource Conservation and Recovery Act (tracking hazardous waste)) - notification Business SIC classification: CLAY, CERAMIC, AND REFRACTORY MINERALS Organizations: BLACK HILLS BENT LTD LIAB CO. (CONTACT/OWNER)
Alternative names: BLACK HILLS BENTONITE CASPER PLANT, CASPER PLANT
BIG WYOMING OLDS GMC (FORMERLY ANSELMI) (3250 E. YELLOWSTONE in CASPER, WY)
(Integrated Compliance Information System) - ICIS-08-1995-0107, FORMAL ENFORCEMENT ACTION Small Quantity Generators, between 100 kg and 1000 kg of hazardous waste/month (Resource Conservation and Recovery Act (tracking hazardous waste)) - notification
DEAN MORGAN JUNIOR HIGH SCHOOL (1440 SOUTH ELM in CASPER, WY)
(Geographic Names Information System) (National Center for Education Statistics) - STATE ID-1301051 Organizations: NATRONA #1 (SCHOOL DISTRICT)
AMES TEXACO (911 CY AVENUE in CASPER, WY)
(Integrated Compliance Information System) - ICIS-08-1992-0527, FORMAL ENFORCEMENT ACTION Conditionally Exempt Small Quantity Generators, less than 100 kg/month of hazardous waste (Resource Conservation and Recovery Act (tracking hazardous waste)) - notification Business SIC classification: GASOLINE SERVICE STATIONS Organizations: MICHAEL J & JOHN J WRIGHT (CONTACT/OWNER)
CASPER, CITY OF (200 NORTH DAVID STREET in CASPER, WY)
(Integrated Compliance Information System) - ICIS-08-1991-0056, FORMAL ENFORCEMENT ACTION ENFORCEMENT/COMPLIANCE ACTIVITY (Integrated Compliance Information System) National Pollutant Discharge Elimination System MAJOR (Tracking pollutant discharge elimination systems) - permit Business SIC classification: SEWERAGE SYSTEMS Alternative names: CASPER BUILDING OF PUBLIC UTILITIES, CASPER BD. OF PUBLIC UTILITIES, CASPER WASTEWATER LAGOON, CASPER WWTF, CITY OF CASPER
JEFFERSON ELEMENTARY (522 SOUTH JEFFERSON in CASPER, WY)
(National Center for Education Statistics) - STATE ID-1301010 Organizations: NATRONA #1 (SCHOOL DISTRICT)
FAIRDALE ELEMENTARY (1400 SOUTH FAIRDALE AVENUE in CASPER, WY)
(National Center for Education Statistics) - STATE ID-1301004 Organizations: NATRONA #1 (SCHOOL DISTRICT)
BAR NUNN ELEMENTARY (100 SIEBKE DRIVE in CASPER, WY)
(National Center for Education Statistics) - STATE ID-1301033 Organizations: NATRONA #1 (SCHOOL DISTRICT)
GRANT ELEMENTARY (1536 OAKCREST AVENUE in CASPER, WY)
(National Center for Education Statistics) - STATE ID-1301008 Organizations: NATRONA #1 (SCHOOL DISTRICT)
Housing units lacking complete plumbing facilities: 3.1% Housing units lacking complete kitchen facilities: 2.8%
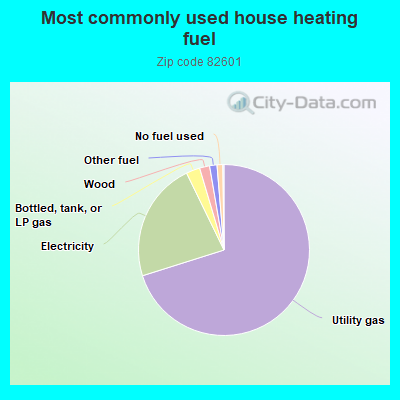
70.2%Utility gas
22.7%Electricity
2.6%Bottled, tank, or LP gas
1.9%Wood
1.4%Other fuel
1.1%No fuel used
Population in 1990: 21,224. Population change in the 1990s: +2,006 (+9.5%).
Place of birth for U.S.-born residents:
This state: 14,083
Northeast: 897
Midwest: 3,951
South: 2,120
West: 5,540
47% of the 82601 zip code residents lived in the same house 5 years ago. Out of people who lived in different houses, 61% lived in this county. Out of people who lived in different counties, 50% lived in Wyoming.
88% of the 82601 zip code residents lived in the same house 1 year ago. Out of people who lived in different houses, 64% moved from this county. Out of people who lived in different houses, 16% moved from different county within same state. Out of people who lived in different houses, 18% moved from different state. Out of people who lived in different houses, 2% moved from abroad.
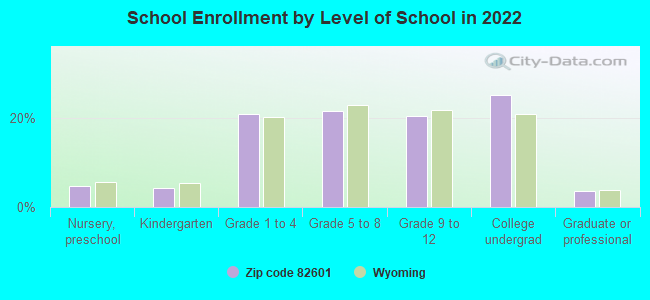
Private vs. public school enrollment:
Students in private schools in grades 1 to 8 (elementary and middle school): 205
Here:
7.8%
Wyoming:
7.3%
Students in private schools in grades 9 to 12 (high school): 53
Here:
4.1%
Wyoming:
6.0%
Students in private undergraduate colleges: 86
Here:
5.5%
Wyoming:
9.2%
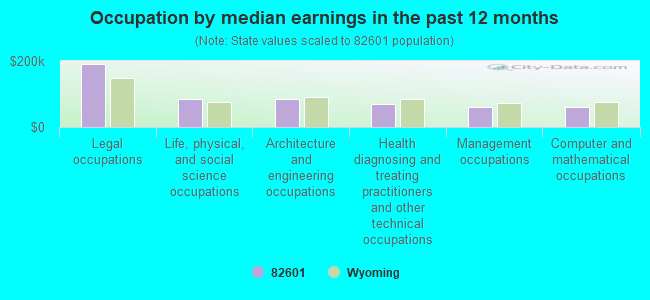
Occupation by median earnings in the past 12 months ($)
189,713Legal occupations
85,313Life, physical, and social science occupations
83,980Architecture and engineering occupations
71,114Health diagnosing and treating practitioners and other technical occupations
61,537Management occupations
60,177Computer and mathematical occupations
Companies with federal contracts located in this zip code (CASPER, WY):
SAL'S JANITORIAL SERVICE INC (851 WERNER CT STE 274; small business) : $2,377,645 in 9 contractsfrom 1999 to 2005
Contracts for Custodial Janitorial Services by Air Force Signed by year:2000: $484,523; 2001: $570,001; 2002: $664,539; 2003: $96,162; 2004: $0; 2005: -$22,723; 2006: $0.
Biggest contracts:
$592,072 with Air Force for Custodial Janitorial Services. Signed on 2002-10-01. Completion date: 2002-09-30.
$585,143, same as above.Signed on 1999-11-04. Completion date: 2000-09-30.
$570,001, same as above.Signed on 2001-10-31. Completion date: 2001-10-26.
$484,523, same as above.Signed on 2000-10-18. Completion date: 2001-09-30.
COMPRESSION LEASING SERVICES, (1935 N LOOP AVE; small business) : $150,650 in 13 contractsfrom 2004 to 2006
Contracts for Compressors and Vacuum Pumps by Army, U.S. Army Corps of Engineers - civil program financing only Signed by year:2000: $0; 2001: $0; 2002: $0; 2003: $0; 2004: $15,000; 2005: $98,996; 2006: $36,654.
Biggest contracts:
$22,000 with Army for Compressors and Vacuum Pumps. Signed on 2006-02-13. Completion date: 2006-04-13.
$21,998, same as above.Signed on 2005-09-08. Completion date: 2005-11-14.
$21,998 with U.S. Army Corps of Engineers - civil program financing only for Compressors and Vacuum Pumps. Signed on 2005-09-08. Completion date: 2005-11-14.
$15,000 with Army for Compressors and Vacuum Pumps. Signed on 2004-09-23. Completion date: 2004-10-23.
GORDER/SOUTH GROUP, P C (606 S DAVID ST; small business) : $131,929 in 9 contractsfrom 1999 to 2003
Contracts for Architect - Engineer Services (including landscaping, interior layout, and designing) by Air Force Signed by year:2000: $32,501; 2001: $0; 2002: $0; 2003: $84,764; 2004: $0; 2005: $0; 2006: $0.
Biggest contracts:
$40,846 with Air Force for Architect - Engineer Services (including landscaping, interior layout, and designing). Signed on 2003-05-16. Completion date: 2003-05-16.
$40,561, same as above.Signed on 2003-05-16. Completion date: 2003-05-16.
$32,501, same as above.Signed on 2000-09-30. Completion date: 2000-01-15.
$14,664, same as above.Signed on 1999-12-09. Completion date: 1999-12-09.
MODERN ELECTRIC CO (246 W 1ST ST; small business) : $75,406 in 7 contractsfrom 2001 to 2006
Contracts for Telephone and Telegraph Equipment, Maintenance, Repair or Alteration of Real Property -- Office Buildings, Signs, Advertising Displays, and Identification Plates, Maintenance, Repair or Alteration of Real Property -- Airport Runways, and moreby Federal Technology Service, Public Buildings Service, Air Force, Army, and others Signed by year:2000: $0; 2001: $38,000; 2002: $0; 2003: $11,785; 2004: $12,508; 2005: $345; 2006: $12,768.
Biggest contracts:
$38,000 with Federal Technology Service for Telephone and Telegraph Equipment. Signed on 2001-11-15. Completion date: 2002-01-15.
$11,785, same as above.Signed on 2003-02-15. Completion date: 2003-03-15.
$7,768 with Public Buildings Service for Maintenance, Repair or Alteration of Real Property -- Office Buildings. Signed on 2006-01-09. Completion date: 2006-02-20.
$6,254 with Air Force for Signs, Advertising Displays, and Identification Plates. Signed on 2004-11-02. Completion date: 2004-12-02.
EXCALIBUR INC (4765 BEL VISTA DR; small business) : $51,380 in 12 contractsfrom 2000 to 2005
Contracts for Custodial Janitorial Services by Army Signed by year:2000: $3,600; 2001: $7,050; 2002: $5,400; 2003: $17,080; 2004: $23,360; 2005: -$5,110; 2006: $0.
Biggest contracts:
$11,680 with Army for Custodial Janitorial Services. Signed on 2004-12-27. Completion date: 2006-03-31.
$11,680, same as above.Signed on 2004-03-17. Completion date: 2005-03-31.
$11,680, same as above.Signed on 2003-02-16. Completion date: 2004-03-31.
$5,400, same as above.Signed on 2003-11-24. Completion date: 2002-09-30.
CHILDREN AND NUTRITION SERVICE (800 WERNER CT STE 210)
$32,325 with Air Force for Other Social Services. Signed on 2005-08-30. Completion date: 2006-08-31.
FAR CING ENTERPRISES INC (1735 E YELLOWSTONE HWY; small business)
$11,785 with Navy for Other Defense -- Applied Research and Exploratory Development (R&D). Signed on 2005-09-20. Completion date: 2005-10-14.
CULLIGAN WATER TECHNOLOGIES IN (255 N WOLCOTT ST; small business)
$3,889 with Army for Miscellaneous Items. Signed on 2004-07-12. Completion date: 2004-06-11.
SHIRKS ENTERPRISES (4269 SALT CREEK HWY; small business) : $240 in 3 contractsin 2005
$960 with Army for Trash/Garbage Collection Services - Including Portable Sanitation Services. Signed on 2005-07-17. Completion date: 2006-07-31.
$0, same as above.Signed on 2005-10-21. Completion date: 2006-07-31.
-$720, same as above.Signed on 2005-10-21. Completion date: 2006-07-31.
Top industries in this zip code by the number of employees in 2005:
Health Care and Social Assistance: General Medical and Surgical Hospitals (over 1000 employees: 1 establishment)
Health Care and Social Assistance: Offices of Physicians (except Mental Health Specialists) (100-249: 1, 50-99: 1, 20-49: 2, 10-19: 8, 5-9: 17, 1-4: 23)
Finance and Insurance: Insurance Agencies and Brokerages (250-499: 1, 20-49: 1, 10-19: 1, 5-9: 3, 1-4: 26)
2002 - 2018 National Fire Incident Reporting System (NFIRS) incidents
According to the data from the years 2002 - 2018 the average number of fires per year is 85. The highest number of reported fire incidents - 157 took place in 2011, and the least - 0 in 2013. The data has a rising trend.
When looking into fire subcategories, the most reports belonged to: Outside Fires (42.0%), and Structure Fires (33.7%).
Fire incident types reported to NFIRS in Zip Code 82601


 Nearest zip codes: 82644, 82636, 82609, 82635, 82643, 82646.


 According to the data from the years 2002 - 2018 the average number of fires per year is 85. The highest number of reported fire incidents - 157 took place in 2011, and the least - 0 in 2013. The data has a rising trend.
 When looking into fire subcategories, the most reports belonged to: Outside Fires (42.0%), and Structure Fires (33.7%).