Estimated zip code population in 2022: 35,675 Zip code population in 2010: 31,348 Zip code population in 2000: 25,301
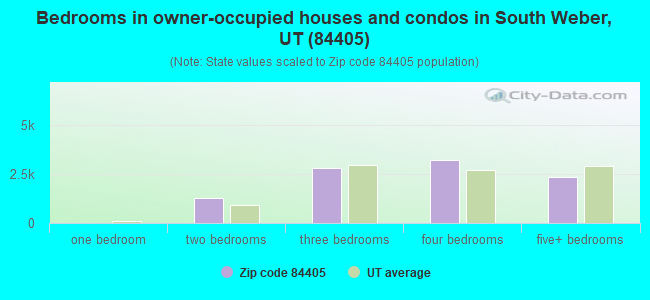
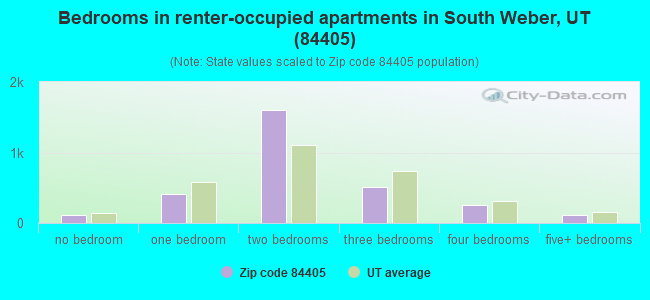
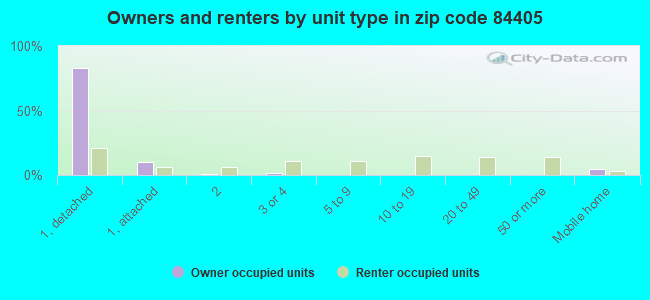
Houses and condos: 13,192 Renter-occupied apartments: 3,038
% of renters here:
24%
State:
29%
March 2022 cost of living index in zip code 84405: 88.8 (less than average, U.S. average is 100)
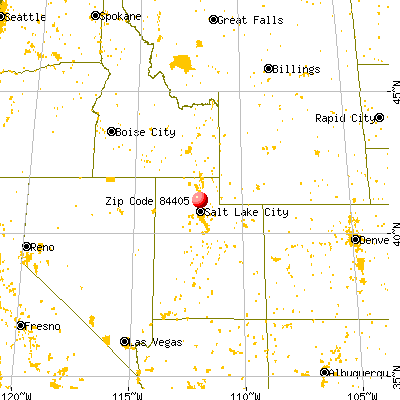
Land area: 18.0 sq. mi. Water area: 0.1 sq. mi.
Population density: 1,986 people per square mile
(low).
OSM Map
General Map
Google Map
MSN Map
OSM Map
General Map
Google Map
MSN Map
OSM Map
General Map
Google Map
MSN Map
OSM Map
General Map
Google Map
MSN Map
Please wait while loading the map...
Real estate property taxes paid for housing units in 2022:
This zip code:
0.5% ($2,116)
Utah:
0.5% ($2,376)
Median real estate property taxes paid for housing units with mortgages in 2022: $2,115 (0.5%) Median real estate property taxes paid for housing units with no mortgage in 2022: $2,122 (0.5%)
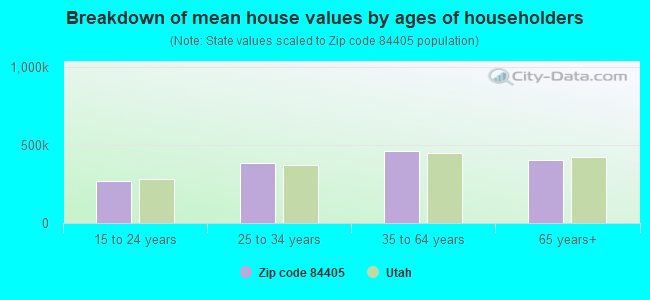
Estimated median house/condo value in 2022: $426,379
84405:
$426,379
Utah:
$499,500
According to our research of Utah and other state lists, there were 74 registered sex offenders living in 84405 zip code as of April 27, 2024. The ratio of all residents to sex offenders in zip code 84405 is 435 to 1. The ratio of registered sex offenders to all residents in this zip code is near the state average.
Median resident age:
This zip code:
33.8 years
Utah median age:
32.1 years
Average household size:
This zip code:
2.8 people
Utah:
3.0 people
Averages for the 2020 tax year for zip code 84405, filed in 2021:
Average Adjusted Gross Income (AGI) in 2020: $67,695 (Individual Income Tax Returns)
Here:
$67,695
State:
$81,660
Salary/wage: $57,388 (reported on 83.7% of returns)
Here:
$57,388
State:
$63,027
(% of AGI for various income ranges: 1265.7% for AGIs below $25k, 3689.5% for AGIs $25k-50k, 6384.0% for AGIs $50k-75k, 9433.8% for AGIs $75k-100k, 17201.6% for AGIs $100k-200k, 62479.4% for AGIs over 200k)
Taxable interest for individuals: $1,351 (reported on 29.3% of returns)
This zip code:
$1,351
Utah:
$2,255
(% of AGI for various income ranges: 11.8% for AGIs below $25k, 20.8% for AGIs $25k-50k, 33.1% for AGIs $50k-75k, 60.3% for AGIs $75k-100k, 116.5% for AGIs $100k-200k, 1171.1% for AGIs over 200k)
Ordinary dividends: $3,335 (reported on 14.0% of returns)
Here:
$3,335
State:
$7,362
(% of AGI for various income ranges: 10.5% for AGIs below $25k, 20.5% for AGIs $25k-50k, 32.0% for AGIs $50k-75k, 90.4% for AGIs $75k-100k, 109.4% for AGIs $100k-200k, 1686.1% for AGIs over 200k)
Net capital gain/loss in AGI: +$12,678 (reported on 14.0% of returns)
Here:
+$12,678
State:
+$43,433
(% of AGI for various income ranges: 4.1% for AGIs below $25k, 17.9% for AGIs $25k-50k, 62.3% for AGIs $50k-75k, 101.1% for AGIs $75k-100k, 384.0% for AGIs $100k-200k, 10582.2% for AGIs over 200k)
Profit/loss from business: +$6,595 (reported on 12.5% of returns)
Here:
+$6,595
State:
+$9,957
(% of AGI for various income ranges: 60.4% for AGIs below $25k, 66.4% for AGIs $25k-50k, 103.6% for AGIs $50k-75k, 167.5% for AGIs $75k-100k, 226.7% for AGIs $100k-200k, 854.4% for AGIs over 200k)
Taxable individual retirement arrangement distribution: $16,236 (reported on 8.1% of returns)
84405:
$16,236
Utah:
$21,167
(% of AGI for various income ranges: 39.0% for AGIs below $25k, 78.5% for AGIs $25k-50k, 133.4% for AGIs $50k-75k, 258.2% for AGIs $75k-100k, 539.4% for AGIs $100k-200k, 1963.3% for AGIs over 200k)
Total itemized deductions: $34,116 (reported on 11.0% of returns)
Here:
$34,116
State:
$41,056
(% of AGI for various income ranges: 18.7% for AGIs below $25k, 86.2% for AGIs $25k-50k, 290.4% for AGIs $50k-75k, 557.1% for AGIs $75k-100k, 1682.9% for AGIs $100k-200k, 10546.1% for AGIs over 200k)
Charity contributions: $17,283 (reported on 9.5% of returns)
Here:
$17,283
State:
$22,261
(% of AGI for various income ranges: 1.9% for AGIs below $25k, 12.7% for AGIs $25k-50k, 65.0% for AGIs $50k-75k, 159.3% for AGIs $75k-100k, 671.7% for AGIs $100k-200k, 6902.8% for AGIs over 200k)
Taxes paid: $7,646 (reported on 10.8% of returns)
84405:
$7,646
State:
$7,985
(% of AGI for various income ranges: 2.8% for AGIs below $25k, 14.0% for AGIs $25k-50k, 65.9% for AGIs $50k-75k, 130.8% for AGIs $75k-100k, 454.7% for AGIs $100k-200k, 1703.3% for AGIs over 200k)
Earned income credit: $2,179 (reported on 12.5% of returns)
Here:
$2,179
State:
$2,169
(% of AGI for various income ranges: 67.2% for AGIs below $25k, 61.2% for AGIs $25k-50k, 1.9% for AGIs $50k-75k)
Percentage of individuals using paid preparers for their 2020 taxes: 93.7%
Here:
94%
State:
94%
(% for various income ranges: 92.7% for AGIs below $25k, 93.7% for AGIs $25k-50k, 94.0% for AGIs $50k-75k, 94.1% for AGIs $75k-100k, 94.1% for AGIs $100k-200k, 96.4% for AGIs over 200k)
Averages for the 2012 tax year for zip code 84405, filed in 2013:
Average Adjusted Gross Income (AGI) in 2012: $53,205 (Individual Income Tax Returns)
Here:
$53,205
State:
$60,327
Salary/wage: $46,696 (reported on 83.9% of returns)
Here:
$46,696
State:
$48,762
(% of AGI for various income ranges: 78.6% for AGIs below $25k, 75.6% for AGIs $25k-50k, 75.7% for AGIs $50k-75k, 73.5% for AGIs $75k-100k, 77.3% for AGIs $100k-200k, 55.5% for AGIs over 200k)
Taxable interest for individuals: $1,057 (reported on 41.0% of returns)
This zip code:
$1,057
Utah:
$1,534
(% of AGI for various income ranges: 0.8% for AGIs below $25k, 0.8% for AGIs $25k-50k, 0.6% for AGIs $50k-75k, 0.6% for AGIs $75k-100k, 0.7% for AGIs $100k-200k, 1.8% for AGIs over 200k)
Ordinary dividends: $2,511 (reported on 14.3% of returns)
Here:
$2,511
State:
$5,711
(% of AGI for various income ranges: 0.8% for AGIs below $25k, 0.6% for AGIs $25k-50k, 0.4% for AGIs $50k-75k, 0.8% for AGIs $75k-100k, 0.7% for AGIs $100k-200k, 1.0% for AGIs over 200k)
Net capital gain/loss in AGI: +$7,423 (reported on 11.6% of returns)
Here:
+$7,423
State:
+$23,734
(% of AGI for various income ranges: 0.5% for AGIs $50k-75k, 0.5% for AGIs $75k-100k, 1.4% for AGIs $100k-200k, 9.2% for AGIs over 200k)
Profit/loss from business: +$6,725 (reported on 11.7% of returns)
Here:
+$6,725
State:
+$8,845
(% of AGI for various income ranges: 3.7% for AGIs below $25k, 1.3% for AGIs $25k-50k, 1.1% for AGIs $50k-75k, 1.2% for AGIs $75k-100k, 1.0% for AGIs $100k-200k, 2.2% for AGIs over 200k)
Taxable individual retirement arrangement distribution: $10,158 (reported on 9.0% of returns)
84405:
$10,158
Utah:
$15,565
(% of AGI for various income ranges: 2.0% for AGIs below $25k, 1.7% for AGIs $25k-50k, 1.7% for AGIs $50k-75k, 2.1% for AGIs $75k-100k, 1.9% for AGIs $100k-200k, 0.7% for AGIs over 200k)
Self-employment retirement plans: $14,600 (reported on 0.2% of returns)
84405:
$14,600
Utah:
$22,655
(% of AGI for various income ranges: 0.2% for AGIs $75k-100k)
Total itemized deductions: $20,915 (23% of AGI, reported on 37.0% of returns)
Here:
$20,915
State:
$25,197
Here:
23.0% of AGI
State:
22.4% of AGI
(% of AGI for various income ranges: 7.5% for AGIs below $25k, 11.3% for AGIs $25k-50k, 15.3% for AGIs $50k-75k, 16.5% for AGIs $75k-100k, 17.9% for AGIs $100k-200k, 13.0% for AGIs over 200k)
Charity contributions: $6,469 (reported on 32.1% of returns)
Here:
$6,469
State:
$8,502
(% of AGI for various income ranges: 0.9% for AGIs below $25k, 2.2% for AGIs $25k-50k, 3.7% for AGIs $50k-75k, 4.4% for AGIs $75k-100k, 5.3% for AGIs $100k-200k, 5.0% for AGIs over 200k)
Taxes paid: $5,741 (reported on 36.9% of returns)
84405:
$5,741
State:
$7,001
(% of AGI for various income ranges: 1.1% for AGIs below $25k, 2.2% for AGIs $25k-50k, 3.6% for AGIs $50k-75k, 4.6% for AGIs $75k-100k, 5.6% for AGIs $100k-200k, 4.9% for AGIs over 200k)
Earned income credit: $2,286 (reported on 16.2% of returns)
Here:
$2,286
State:
$2,259
(% of AGI for various income ranges: 5.8% for AGIs below $25k, 1.2% for AGIs $25k-50k)
Percentage of individuals using paid preparers for their 2012 taxes: 45.5%
Here:
45%
State:
51%
(% for various income ranges: 40.3% for AGIs below $25k, 44.7% for AGIs $25k-50k, 47.5% for AGIs $50k-75k, 49.3% for AGIs $75k-100k, 52.9% for AGIs $100k-200k, 72.7% for AGIs over 200k)
Averages for the 2004 tax year for zip code 84405, filed in 2005:
Average Adjusted Gross Income (AGI) in 2004: $42,653 (Individual Income Tax Returns)
Here:
$42,653
State:
$45,498
Salary/wage: $39,070 (reported on 84.3% of returns)
Here:
$39,070
State:
$38,975
(% of AGI for various income ranges: 109.2% for AGIs below $10k, 74.3% for AGIs $10k-25k, 76.8% for AGIs $25k-50k, 78.4% for AGIs $50k-75k, 81.9% for AGIs $75k-100k, 72.0% for AGIs over 100k)
Taxable interest for individuals: $956 (reported on 56.5% of returns)
This zip code:
$956
Utah:
$1,445
(% of AGI for various income ranges: 3.2% for AGIs below $10k, 1.7% for AGIs $10k-25k, 1.2% for AGIs $25k-50k, 1.1% for AGIs $50k-75k, 0.8% for AGIs $75k-100k, 1.5% for AGIs over 100k)
Taxable dividends: $1,561 (reported on 17.7% of returns)
Here:
$1,561
State:
$3,152
(% of AGI for various income ranges: 1.9% for AGIs below $10k, 0.6% for AGIs $10k-25k, 0.6% for AGIs $25k-50k, 0.5% for AGIs $50k-75k, 0.5% for AGIs $75k-100k, 0.9% for AGIs over 100k)
Net capital gain/loss: +$5,572 (reported on 13.9% of returns)
Here:
+$5,572
State:
+$14,059
(% of AGI for various income ranges: -1.5% for AGIs below $10k, 0.4% for AGIs $10k-25k, 0.2% for AGIs $25k-50k, 0.6% for AGIs $50k-75k, 1.0% for AGIs $75k-100k, 5.9% for AGIs over 100k)
Profit/loss from business: +$5,852 (reported on 11.9% of returns)
Here:
+$5,852
State:
+$6,903
(% of AGI for various income ranges: 1.4% for AGIs below $10k, 2.7% for AGIs $10k-25k, 1.2% for AGIs $25k-50k, 1.4% for AGIs $50k-75k, 1.6% for AGIs $75k-100k, 1.9% for AGIs over 100k)
IRA payment deduction: $2,593 (reported on 1.9% of returns)
84405:
$2,593
Utah:
$2,970
(% of AGI for various income ranges: 0.1% for AGIs $10k-25k, 0.2% for AGIs $25k-50k, 0.1% for AGIs $50k-75k, 0.1% for AGIs $75k-100k, 0.1% for AGIs over 100k)
Self-employed pension: $8,296 (reported on 0.2% of returns)
Here:
$8,296
Utah:
$14,916
Total itemized deductions: $17,620 (25% of AGI, reported on 39.6% of returns)
Here:
$17,620
State:
$20,312
Here:
24.9% of AGI
State:
24.9% of AGI
(% of AGI for various income ranges: 9.0% for AGIs below $10k, 8.3% for AGIs $10k-25k, 14.3% for AGIs $25k-50k, 18.5% for AGIs $50k-75k, 19.6% for AGIs $75k-100k, 17.6% for AGIs over 100k)
Charity contributions deductions: $4,847 (7% of AGI, reported on 36.6% of returns)
Here:
$4,847
State:
$6,250
Here:
6.7% of AGI
State:
7.4% of AGI
(% of AGI for various income ranges: 0.7% for AGIs below $10k, 1.4% for AGIs $10k-25k, 3.0% for AGIs $25k-50k, 4.5% for AGIs $50k-75k, 5.0% for AGIs $75k-100k, 5.6% for AGIs over 100k)
Total tax: $4,923 (reported on 75.4% of returns)
84405:
$4,923
State:
$6,523
(% of AGI for various income ranges: 2.3% for AGIs below $10k, 3.7% for AGIs $10k-25k, 5.8% for AGIs $25k-50k, 7.4% for AGIs $50k-75k, 9.3% for AGIs $75k-100k, 14.5% for AGIs over 100k)
Earned income credit: $1,665 (reported on 12.5% of returns)
Here:
$1,665
State:
$1,703
Percentage of individuals using paid preparers for their 2004 taxes: 48.0%
Here:
48%
State:
53%
(% for various income ranges: 38.6% for AGIs below $10k, 49.2% for AGIs $10k-25k, 48.7% for AGIs $25k-50k, 52.0% for AGIs $50k-75k, 49.4% for AGIs $75k-100k, 53.6% for AGIs over 100k)
Likely homosexual households (counted as self-reported same-sex unmarried-partner households)
Lesbian couples: 0.3% of all households
Gay men: 0.0% of all households
Household received Food Stamps/SNAP in the past 12 months: 512 Household did not receive Food Stamps/SNAP in the past 12 months: 12,250
Women who had a birth in the past 12 months: 396 (338 now married, 57 unmarried) Women who did not have a birth in the past 12 months: 8,938 (4,278 now married, 4,663 unmarried)
Housing units in zip code 84405 with a mortgage: 6,481 (907 second mortgage, 26 home equity loan, 657 both second mortgage and home equity loan) Houses without a mortgage: 127
Median monthly owner costs for units with a mortgage: $1,675 Median monthly owner costs for units without a mortgage: $490
Residents with income below the poverty level in 2022:
This zip code:
6.7%
Whole state:
8.2%
Residents with income below 50% of the poverty level in 2022:
This zip code:
3.0%
Whole state:
4.3%
Median number of rooms in houses and condos:
Here:
7.7
State:
7.6
Median number of rooms in apartments:
Here:
4.2
State:
4.3
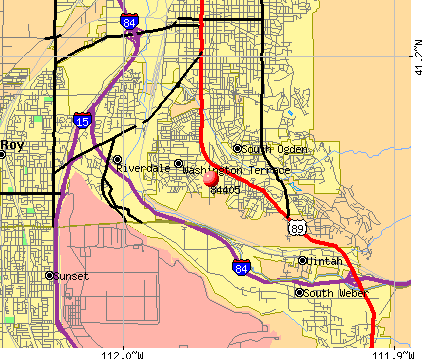
Notable locations in this zip code not listed on our city pages
Notable locations in zip code 84405: Riverdale Center (A), Weber Job Corps (B), Riverdale Power Plant (C), Ogden Golf and Country Club (D), Weber Canyon Commercial Subdivision (E), Riverdale Industrial Park (F), Weber Basin Job Corp Center (G), Hill Aerospace Museum (H), Uintah City Fire Department (I), Washington Terrace Fire Department Station 51 (J), Roy Heritage Museum (K), South Weber City Fire Department (L), The Family Center at Riverdale (M), Riverdale Fire Services (N). Display/hide their locations on the map
Churches in zip code 84405 include: Community United Methodist Church (A), Victory Christian Fellowship (B), Washington Heights Baptist Church (C), The Church of Jesus Christ of Latter Day Saints (D). Display/hide their locations on the map
6,562 married couples with children.
1,801 single-parent households (444 men, 1,357 women).
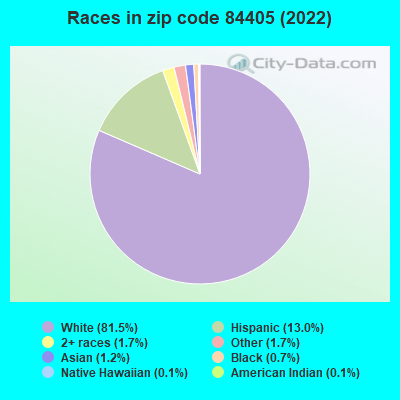
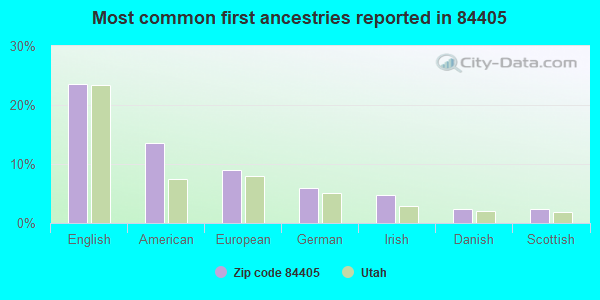
88.6% of residents of 84405 zip code speak English at home.
8.2% of residents speak Spanish at home (72% very well, 19% well, 7% not well, 2% not at all).
1.4% of residents speak other Indo-European language at home (90% very well, 6% well, 4% not well).
1.0% of residents speak Asian or Pacific Island language at home (73% very well, 11% well, 17% not well).
0.5% of residents speak other language at home (100% very well).
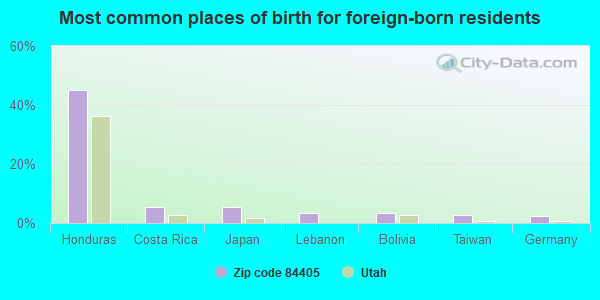
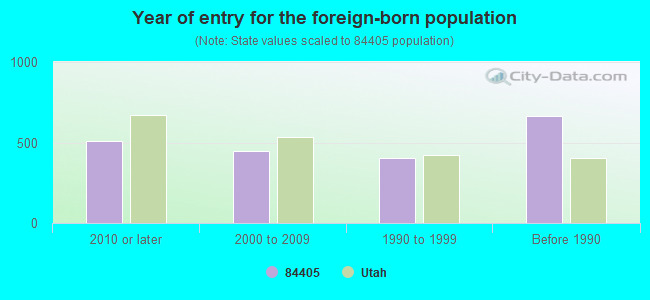
Foreign born population: 1,765 (4.9%) (43.5% of them are naturalized citizens)
Major facilities with environmental interests located in this zip code:
KMART STORES NUMBER 4115 (3656 WALL AVENUE in OGDEN, UT)
STATE MASTER (Utah compliance and permitting operations) - UST DATABASE-4, UNDERGROUND STORAGE TANK PROGRAM Small Quantity Generators, between 100 kg and 1000 kg of hazardous waste/month (Resource Conservation and Recovery Act (tracking hazardous waste)) - notification Business NAICS classification: ONE-HOUR PHOTOFINISHING. Organizations: CRAIG JAMIESON (WHSE. MGR.) (CONTACT/OPERATOR)
, COSTCO WHOLESALE CORP (CONTACT/OWNER)
, KIMCO CORPORATION (CONTACT/OWNER)
Alternative names: COSTCO WHOLESALE #770, K-MART STORE #4115, KMART # 4115
AUTOLIV NOTH AMERICA (OGDEN) (3350 AIRPORT ROAD in OGDEN, UT)
AIR MINOR (AIRS/AFS) CRITERIA AND HAZARDOUS AIR POLLUTANT INVENTORY (Inventory of air pollution sources) Small Quantity Generators, between 100 kg and 1000 kg of hazardous waste/month (Resource Conservation and Recovery Act (tracking hazardous waste)) - notification TRANSPORTER (Resource Conservation and Recovery Act (tracking hazardous waste)) - notification TSD (Resource Conservation and Recovery Act (tracking hazardous waste)) TRI REPORTER (Tracking of toxic chemicals releasing facilities) Business SIC classification: MOTOR VEHICLE PARTS AND ACCESSORIES; AUTOMOTIVE SERVICES, EXCEPT REPAIR AND CARWASHES Business NAICS classification: OTHER ORDNANCE AND ACCESSORIES MANUFACTURING.; ALL OTHER MOTOR VEHICLE PARTS MANUFACTURING. Organizations: MORTON CORPORATION (CONTACT/OWNER)
Alternative names: AUTOLIV ASP INC., AUTOLIV N.A. (OGDEN)
BONNEVILLE HIGH SCHOOL (251 E 4800 S in OGDEN, UT)
STATE MASTER (Utah compliance and permitting operations) (National Center for Education Statistics) - STATE ID-35 701 Organizations: WEBER SCHOOL DISTRICT (SCHOOL DISTRICT)
JIFFY LUBE OGDEN (192 36TH ST in OGDEN, UT)
STATE MASTER (Utah compliance and permitting operations) - UST DATABASE-4, UNDERGROUND STORAGE TANK PROGRAM Conditionally Exempt Small Quantity Generators, less than 100 kg/month of hazardous waste (Resource Conservation and Recovery Act (tracking hazardous waste)) - notification Organizations: PENNZOIL COMPANY (CONTACT/OWNER)
Alternative names: JIFFY LUBE #1
H GUY CHILD ELEM SCH (655 E 5500 S in OGDEN, UT)
(National Center for Education Statistics) - STATE ID-35 110 Organizations: WEBER SCHOOL DISTRICT (SCHOOL DISTRICT)
AUTOLIV ASP, INC/AUTO SAFETY (300 WEST 12TH STREET in OGDEN, UT)
AIR MINOR (AIRS/AFS) Small Quantity Generators, between 100 kg and 1000 kg of hazardous waste/month (Resource Conservation and Recovery Act (tracking hazardous waste)) - notification Business SIC classification: AUTOMOTIVE SERVICES, EXCEPT REPAIR AND CARWASHES Organizations: AUTOLIV ASP, INC. (CONTACT/OWNER)
Alternative names: AUTOLIV ASP, INC (CUSHION)
ANALYTICAL QUALITY SOLUTIONS (AQS) (2112 DEER RUN DRIVE in SOUTH WEBER, UT)
TRANSPORTER (Resource Conservation and Recovery Act (tracking hazardous waste))
AUTOLIV (MODULE FAC. 1000 WEST 33RD SO. in OGDEN, UT)
Conditionally Exempt Small Quantity Generators, less than 100 kg/month of hazardous waste (Resource Conservation and Recovery Act (tracking hazardous waste)) - notification TRANSPORTER (Resource Conservation and Recovery Act (tracking hazardous waste)) - notification Business NAICS classification: INDUSTRIAL TRUCK, TRACTOR, TRAILER, AND STACKER MACHINERY MANUFACTURING.
AUTOLIV NORTH AMERICA/AUTOLIV ASP. (1000 WEST 33 STREET in OGDEN, UT)
AIR MINOR (AIRS/AFS) Business SIC classification: AUTOMOTIVE SERVICES, EXCEPT REPAIR AND CARWASHES Alternative names: AUTOLIV ASP AUTO SAFETY
BONNEVILLE HIGH SCHOOL (251 EAST 4800 SOUTH in WASHINGTON TERRACE, UT)
AIR MINOR (AIRS/AFS) Business SIC classification: ELEMENTARY AND SECONDARY SCHOOLS Alternative names: BONNEVILLE HIGH SCHOOL HEATING PLANT, WEBER COUNTY SCHOOL DISTRICT
FEDERAL EXPRESS CORPORATION (4646 SOUTH 1500 WEST in OGDEN, UT)
Conditionally Exempt Small Quantity Generators, less than 100 kg/month of hazardous waste (Resource Conservation and Recovery Act (tracking hazardous waste)) - notification USED OIL PROGRAM (Resource Conservation and Recovery Act (tracking hazardous waste))
HOME DEPOT USA #4401 (999 WEST RIVERDALE ROAD in RIVERDALE, UT)
Conditionally Exempt Small Quantity Generators, less than 100 kg/month of hazardous waste (Resource Conservation and Recovery Act (tracking hazardous waste)) - notification Organizations: HOME DEPOT USA (CONTACT/OPERATOR)
, THE HOME DEPOT (CONTACT/OWNER)
Alternative names: HOME DEPOT #4401
CHEVY CHASE APARTMENTS (4250 SOUTH 1000 WEST in OGDEN, UT)
ENFORCEMENT/COMPLIANCE ACTIVITY (Integrated Compliance Information System) COMPLIANCE ACTIVITY (Tracking inspections of insecticide, fungicide, and rodenticide, and toxic substances) Business SIC classification: OPERATORS OF APARTMENT BUILDINGS
Housing units lacking complete plumbing facilities: 0.4% Housing units lacking complete kitchen facilities: 1.7%
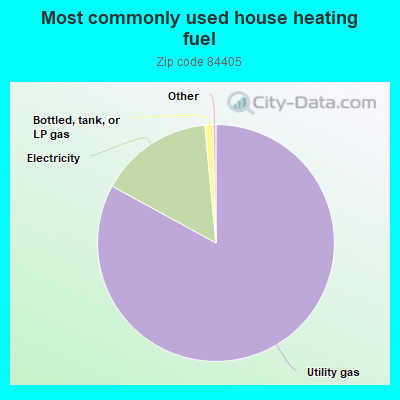
82.9%Utility gas
15.5%Electricity
1.1%Bottled, tank, or LP gas
Population in 1990: 18,982. Population change in the 1990s: +6,319 (+33.3%).
Place of birth for U.S.-born residents:
This state: 23,645
Northeast: 805
Midwest: 1,400
South: 1,777
West: 5,875
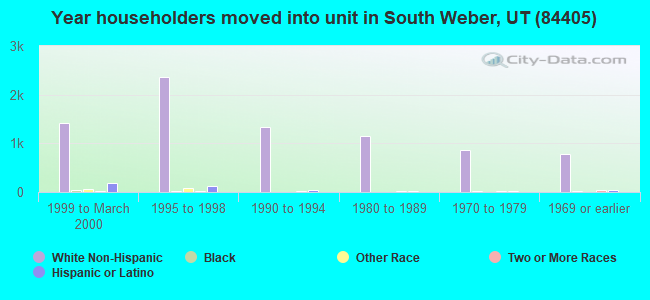
55% of the 84405 zip code residents lived in the same house 5 years ago. Out of people who lived in different houses, 58% lived in this county. Out of people who lived in different counties, 50% lived in Utah.
92% of the 84405 zip code residents lived in the same house 1 year ago. Out of people who lived in different houses, 51% moved from this county. Out of people who lived in different houses, 32% moved from different county within same state. Out of people who lived in different houses, 19% moved from different state. Out of people who lived in different houses, 1% moved from abroad.
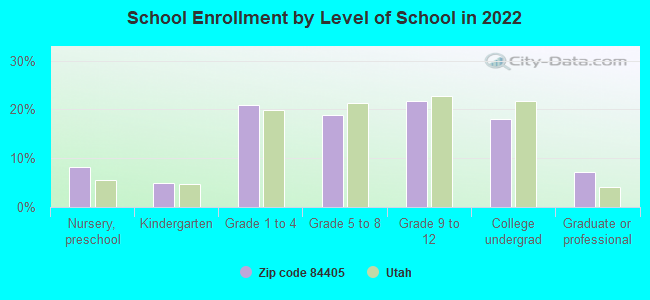
Private vs. public school enrollment:
Students in private schools in grades 1 to 8 (elementary and middle school): 169
Here:
4.7%
Utah:
7.2%
Students in private schools in grades 9 to 12 (high school): 26
Here:
1.4%
Utah:
5.3%
Students in private undergraduate colleges: 76
Here:
4.6%
Utah:
26.7%
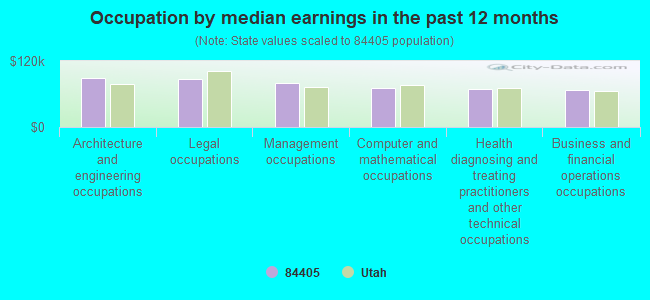
Occupation by median earnings in the past 12 months ($)
88,872Architecture and engineering occupations
86,683Legal occupations
80,754Management occupations
70,939Computer and mathematical occupations
69,306Health diagnosing and treating practitioners and other technical occupations
67,641Business and financial operations occupations
Companies with biggest federal contracts located in this zip code:
QUALITY SOLUTIONS CORPORATION (2112 DEER RUN DRIVE in SOUTH WEBER, UT; small business) : $4,209,091 in 21 contractsfrom 2000 to 2006
Contracts for Hazardous Substance Removal, Cleanup, and Disposal Services and Operational Support, Other Environmental Services, Studies, and Analytical Support, Data Analyses (other than scientific) by Army Signed by year:2000: $57,385; 2001: $36,381; 2002: $109,266; 2003: $79,008; 2004: $918,076; 2005: $2,325,000; 2006: $683,975.
Biggest contracts:
$525,000 with Army for Hazardous Substance Removal, Cleanup, and Disposal Services and Operational Support. Signed on 2005-07-28. Completion date: 2009-07-26.
$400,000, same as above.Signed on 2006-04-10. Completion date: 2009-07-26.
$400,000, same as above.Signed on 2005-12-22. Completion date: 2009-07-26.
$400,000, same as above.Signed on 2005-01-30. Completion date: 2009-07-26.
RLM CONSTRUCTION INC (3483 S AIRPORT RD #3 in OGDEN, UT; small business) : $2,882,832 in 5 contractsfrom 2000 to 2003
Contracts for Maintenance, Repair or Alteration of Real Property -- Other Non-Building Facilities by Air Force Signed by year:2000: $2,791,761; 2001: $35,393; 2002: $35,073; 2003: $20,605; 2004: $0; 2005: $0; 2006: $0.
Biggest contracts:
$2,791,761 with Air Force for Maintenance, Repair or Alteration of Real Property -- Other Non-Building Facilities. Signed on 2000-12-12. Completion date: 2001-12-05.
$35,393, same as above.Signed on 2001-11-13. Completion date: 2001-12-05.
$31,339, same as above.Signed on 2002-03-28. Completion date: 2002-12-31.
$20,605, same as above.Signed on 2003-02-13. Completion date: 2003-03-20.
NET COMMUNICATIONS AND MANAGEM (4048 S 600 W in RIVERDALE, UT; small business) : $931,774 in 7 contractsfrom 2000 to 2003
Contracts for Maintenance, Repair and Rebuilding of Equipment -- Miscellaneous, Programming Services by Air Force Signed by year:2000: $207,335; 2001: $288,800; 2002: $322,789; 2003: $112,850; 2004: $0; 2005: $0; 2006: $0.
Biggest contracts:
$288,800 with Air Force for Maintenance, Repair and Rebuilding of Equipment -- Miscellaneous. Signed on 2001-09-18. Completion date: 2002-09-24.
$207,335, same as above.Signed on 2000-09-20. Completion date: 2001-09-24.
$112,850 with Air Force for Programming Services. Signed on 2002-11-21. Completion date: 2003-01-24.
$109,984 with Air Force for Maintenance, Repair and Rebuilding of Equipment -- Miscellaneous. Signed on 2002-09-25. Completion date: 2002-11-30.
NETCMT LLC (4048 S 600 W in OGDEN, UT; small business)
$661,667 with Air Force for Programming Services. Signed on 2003-07-25. Completion date: 2004-07-24.
BBH CONSULTING LLC (643 W 3850 S in OGDEN, UT; small business) : $469,020 in 6 contractsfrom 2004 to 2006
Contracts for ADP Systems Development Services, Installation of Equipment -- Miscellaneous, Other ADP and Telecommunications Services (includes data storage on tapes, compact disks, etc.) by Air Force Signed by year:2000: $0; 2001: $0; 2002: $0; 2003: $0; 2004: $109,645; 2005: $144,356; 2006: $215,019.
Biggest contracts:
$218,500 with Air Force for ADP Systems Development Services. Signed on 2006-04-03. Completion date: 2011-04-02.
$119,684, same as above.Signed on 2005-10-01. Completion date: 2006-09-30.
$60,229 with Air Force for Installation of Equipment -- Miscellaneous. Signed on 2004-03-08. Completion date: 2004-09-30.
$49,416 with Air Force for Other ADP and Telecommunications Services (includes data storage on tapes, compact disks, etc.). Signed on 2004-09-30. Completion date: 2005-02-28.
D & S NEO TECH INC (3775 AIRPORT ROAD in OGDEN, UT; small business) : $251,108 in 6 contractsfrom 2002 to 2006
Contracts for Facilities Operations Support Services, Maintenance, Repair and Rebuilding of Equipment -- Miscellaneous, Technical Representation Services -- Maintenance and Repair Shop Equipment, Maintenance, Repair and Rebuilding of Equipment -- Electrical and Electronic Equipment Components, and moreby Air Force Signed by year:2000: $0; 2001: $0; 2002: $97,423; 2003: $194,623; 2004: $0; 2005: $47,000; 2006: -$87,938.
Biggest contracts:
$99,623 with Air Force for Facilities Operations Support Services. Signed on 2003-04-08. Completion date: 2003-07-09.
$97,423 with Air Force for Maintenance, Repair and Rebuilding of Equipment -- Miscellaneous. Signed on 2002-09-13. Completion date: 2002-11-18.
$48,000 with Air Force for Technical Representation Services -- Maintenance and Repair Shop Equipment. Signed on 2003-10-08. Completion date: 2007-09-30.
$47,000 with Air Force for Maintenance, Repair and Rebuilding of Equipment -- Miscellaneous. Signed on 2005-01-11. Completion date: 2005-09-30.
JLEX INC (7776 SOUTH 2175 EAST in OGDEN, UT; small business) : $110,085 in 2 contractsin 2003
$73,445 with Air Force for Radio and Television Communication Equipment, Except Airborne. Signed on 2003-09-12. Completion date: 2004-03-11.
$36,640 with Air Force for Maintenance, Repair and Rebuilding of Equipment -- Vehicular Equipment Components. Signed on 2003-08-11. Completion date: 2003-08-30.
BLAIR MANAGEMENT CORP (3745 S 250 W in OGDEN, UT; small business) : $105,995 in 4 contractsfrom 2003 to 2005
$49,363 with Air Force for Ground Effect Vehicles. Signed on 2003-09-10. Completion date: 2003-10-29.
$35,752, same as above.Signed on 2003-09-15. Completion date: 2003-09-29.
$10,446 with Air Force for Road Clearing, Cleaning and Marking Equipment. Signed on 2005-12-07. Completion date: 2005-12-09.
$10,434 with Air Force for Motorcycles, Motor Scooters, and Bicycles. Signed on 2005-08-22. Completion date: 2005-08-29.
HARNESS CONNECTION (1520 EASTCANYON DRIVE in SOUTH WEBER, UT; small business) : $91,404 in 2 contractsfrom 2000 to 2003
$59,424 with Defense Logistics Agency for Miscellaneous Aircraft Accessories and Components. Signed on 2000-01-18. Completion date: 2000-10-27.
$31,980 with Air Force for Aircraft Maintenance and Repair Shop Specialized Equipment. Signed on 2003-01-08. Completion date: 2003-04-08.
LIBERTY ASSOCIATES INC (2130 EAST 7800 SOUTH in OGDEN, UT; small business) : $49,336 in 3 contractsin 2002
$31,886 with Air Force for Maintenance, Repair or Alteration of Real Property -- Other Non-Building Facilities. Signed on 2002-09-30. Completion date: 2002-12-31.
$8,995, same as above.Signed on 2002-12-19. Completion date: 2003-01-08.
$8,455, same as above.Signed on 2002-11-25. Completion date: 2002-12-31.
Top industries in this zip code by the number of employees in 2005:
Administrative and Support and Waste Management and Remediation Services: Telemarketing Bureaus (over 1000 employees: 1 establishment, 10-19 employees: 1 establishment)
Health Care and Social Assistance: General Medical and Surgical Hospitals (500-999: 1)
2002 - 2018 National Fire Incident Reporting System (NFIRS) incidents
Based on the data from the years 2002 - 2018 the average number of fire incidents per year is 75. The highest number of fires - 124 took place in 2006, and the least - 33 in 2009. The data has a declining trend.
When looking into fire subcategories, the most incidents belonged to: Outside Fires (42.9%), and Structure Fires (34.2%).
Fire incident types reported to NFIRS in Zip Code 84405


 Nearest zip codes: 84056, 84403, 84040, 84067, 84401, 84041.
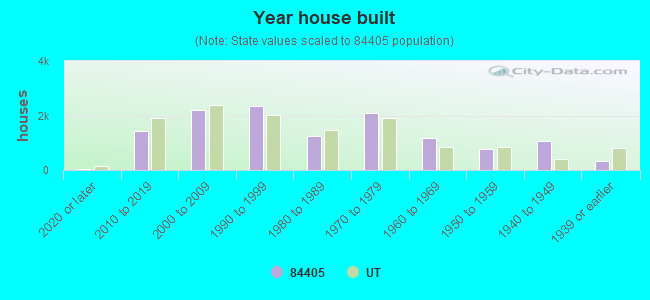


 Based on the data from the years 2002 - 2018 the average number of fire incidents per year is 75. The highest number of fires - 124 took place in 2006, and the least - 33 in 2009. The data has a declining trend.
 When looking into fire subcategories, the most incidents belonged to: Outside Fires (42.9%), and Structure Fires (34.2%).