Ogden, Utah
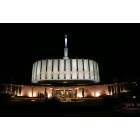
Ogden: Ogden LDS Temple at night
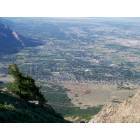
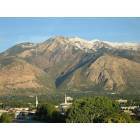
Ogden: Picture of Ogden from Ben Lomond Peak looking South
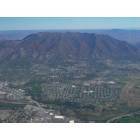
Ogden: Aerial view of Ogden looking east
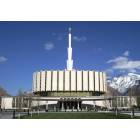
Ogden: MORMON TEMPLE IN OGDEN
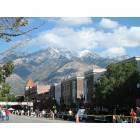
Ogden: CITY FESTIVAL IN OGDEN
Ogden: Ogden LDS (Mormon) Temple in downtown Ogden
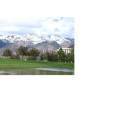
Ogden: View of wasatch front mountains from Weber State University campus
Ogden: OVERLOOKING DOWNTOWN OGDEN
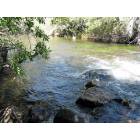
Ogden: Ogden River
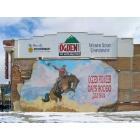
Ogden: Ogden Building Mural
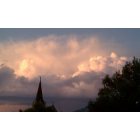
Ogden: Saint Joseph's steeple (24th St. & Adams Ave.)
- see
24
more - add
your
Submit your own pictures of this city and show them to the world
- OSM Map
- General Map
- Google Map
- MSN Map
Population change since 2000: +12.4%
 |
| Males: 45,513 | |
| Females: 41,312 |
| Median resident age: | 33.7 years |
| Utah median age: | 32.1 years |
| Ogden: | $67,102 |
| UT: | $89,168 |
Estimated per capita income in 2022: $32,492 (it was $16,632 in 2000)
Ogden city income, earnings, and wages data
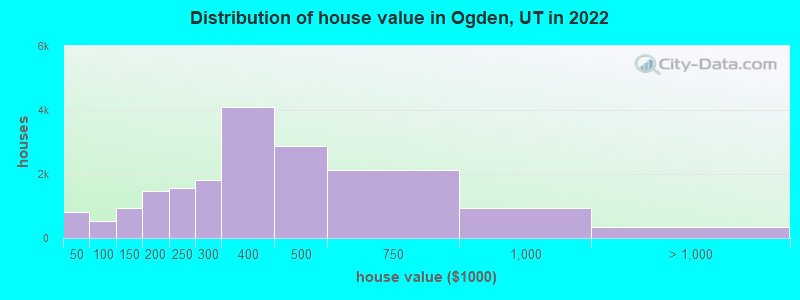
Estimated median house or condo value in 2022: $365,100 (it was $99,200 in 2000)
| Ogden: | $365,100 |
| UT: | $499,500 |
Mean prices in 2022: all housing units: $410,098; detached houses: $433,598; townhouses or other attached units: $352,784; in 2-unit structures: $366,644; in 3-to-4-unit structures: $214,410; in 5-or-more-unit structures: $192,805; mobile homes: $55,891
Median gross rent in 2022: $1,042.
(10.3% for White Non-Hispanic residents, 21.9% for Black residents, 12.8% for Hispanic or Latino residents, 22.8% for American Indian residents, 8.6% for Native Hawaiian and other Pacific Islander residents, 8.0% for other race residents, 11.3% for two or more races residents)
Detailed information about poverty and poor residents in Ogden, UT

Compare current foreclosures in Ogden, UT:
| Photo | Address | Area | Beds / Baths | Price | Details |
|---|---|---|---|---|---|

|
#1
S 2900 W
Ogden, UT 84401
|
1,186 sq. feet
|
2 baths 3 beds |
show details | |

|
#2
W 3975 S Apt 28d
Ogden, UT 84401
|
1,133 sq. feet
|
2 baths 3 beds |
show details | |

|
#3
N 3450 W
Ogden, UT 84404
|
1,791 sq. feet
|
2 baths 3 beds |
show details | |

|
#4
E Canyon Dr
Ogden, UT 84405
|
1,595 sq. feet
|
2 baths 2 beds |
show details | |

|
#5
Lakeview Dr
Ogden, UT 84414
|
1,595 sq. feet
|
3 baths 6 beds |
show details | |

|
#6
Foothill Dr
Ogden, UT 84403
|
3,219 sq. feet
|
3 baths 4 beds |
show details | |

|
#7
W 4275 S
Ogden, UT 84401
|
2,154 sq. feet
|
3 baths 3 beds |
show details | |

|
#8
Grant Ave
Ogden, UT 84404
|
1,025 sq. feet
|
1 baths 4 beds |
show details | |

|
#9
16th St
Ogden, UT 84404
|
- sq. feet
|
1 baths 2 beds |
show details | |

|
#10
Wasatch Dr Apt D201
Ogden, UT 84403
|
- sq. feet
|
- baths - beds |
show details |
| Photo | Address | Area | Beds / Baths | Price | Details |
|---|---|---|---|---|---|

|
#11
Midland Dr Apt E203
Ogden, UT 84401
|
- sq. feet
|
- baths - beds |
show details | |

|
#12
S 1100 W Apt H106
Ogden, UT 84401
|
- sq. feet
|
- baths - beds |
show details | |

|
#13
Harrison Blvd Apt 2b
Ogden, UT 84403
|
- sq. feet
|
- baths - beds |
show details | |

|
#14
Grant Ave
Ogden, UT 84401
|
- sq. feet
|
- baths - beds |
show details | |

|
#15
Midland Dr, Apt I303
Ogden, UT 84401
|
- sq. feet
|
- baths - beds |
show details | |

|
#16
S 1150 W Trlr A
Ogden, UT 84405
|
- sq. feet
|
- baths - beds |
show details | |

|
#17
Lake St
Ogden, UT 84401
|
- sq. feet
|
- baths - beds |
show details | |

|
#18
Fox Chase Dr
Ogden, UT 84403
|
- sq. feet
|
- baths - beds |
show details | |

|
#19
31st St
Ogden, UT 84401
|
- sq. feet
|
- baths - beds |
show details | |

|
#20
N 200 E
Ogden, UT 84404
|
- sq. feet
|
- baths - beds |
show details |
| Photo | Address | Area | Beds / Baths | Price | Details |
|---|---|---|---|---|---|

|
#21
Park Blvd Apt 2018
Ogden, UT 84401
|
- sq. feet
|
- baths - beds |
show details | |

|
#22
S 300 E, Apt 7
Ogden, UT 84405
|
- sq. feet
|
- baths - beds |
show details | |

|
#23
S 1200 W Apt 42
Ogden, UT 84404
|
- sq. feet
|
- baths - beds |
show details | |

|
#24
W 2550 S
Ogden, UT 84401
|
- sq. feet
|
- baths - beds |
show details | |

|
#25
W Riverdale Rd Apt J6
Ogden, UT 84405
|
- sq. feet
|
- baths - beds |
show details | |

|
#26
E 760 N
Ogden, UT 84404
|
- sq. feet
|
- baths - beds |
show details | |

|
#27
Liberty Ave Apt 1
Ogden, UT 84403
|
- sq. feet
|
- baths - beds |
show details | |

|
#28
Jefferson Ave Apt 20
Ogden, UT 84401
|
- sq. feet
|
- baths - beds |
show details | |

|
#29
N 400 W
Ogden, UT 84404
|
- sq. feet
|
- baths - beds |
show details | |

|
#30
2nd St
Ogden, UT 84404
|
- sq. feet
|
- baths - beds |
show details |
| Photo | Address | Area | Beds / Baths | Price | Details |
|---|---|---|---|---|---|

|
#31
9th St # B
Ogden, UT 84404
|
- sq. feet
|
- baths - beds |
show details | |

|
#32
Van Buren Ave
Ogden, UT 84401
|
- sq. feet
|
- baths - beds |
show details | |

|
#33
S 1050 W Trlr B163
Ogden, UT 84405
|
- sq. feet
|
- baths - beds |
show details | |

|
#34
W 3550 S
Ogden, UT 84401
|
- sq. feet
|
- baths - beds |
show details | |

|
#35
Oram Cir
Ogden, UT 84403
|
- sq. feet
|
- baths - beds |
show details | |

|
#36
N Highway 89, Trlr 218
Ogden, UT 84404
|
- sq. feet
|
- baths - beds |
show details | |

|
#37
E 6550 S
Ogden, UT 84405
|
- sq. feet
|
- baths - beds |
show details | |

|
#38
East 935 North
Ogden, UT 84404
|
- sq. feet
|
- baths - beds |
show details | |

|
#39
W 1500 N
Ogden, UT 84404
|
- sq. feet
|
- baths - beds |
show details | |

|
#40
25th St # P301
Ogden, UT 84401
|
- sq. feet
|
- baths - beds |
show details |
| Photo | Address | Area | Beds / Baths | Price | Details |
|---|---|---|---|---|---|

|
#41
Midland Dr Apt O308
Ogden, UT 84401
|
- sq. feet
|
- baths - beds |
show details | |

|
#42
W 1500 N
Ogden, UT 84404
|
- sq. feet
|
- baths - beds |
show details | |

|
#43
S 520 W
Ogden, UT 84404
|
- sq. feet
|
- baths - beds |
show details | |

|
#44
Harrison Blvd # A
Ogden, UT 84401
|
- sq. feet
|
- baths - beds |
show details | |

|
#45
27th St Apt 2
Ogden, UT 84403
|
- sq. feet
|
- baths - beds |
show details | |

|
#46
Madison Ave Apt K12
Ogden, UT 84401
|
- sq. feet
|
- baths - beds |
show details | |

|
#47
N Washington Blvd Trlr 190
Ogden, UT 84404
|
- sq. feet
|
- baths - beds |
show details | |

|
#48
S 1100 W
Ogden, UT 84401
|
- sq. feet
|
- baths - beds |
show details | |

|
#49
E 6600 S Unit 42
Ogden, UT 84405
|
- sq. feet
|
- baths - beds |
show details | |

|
Check over 1 million property listings on Foreclosure.com!
|
browse all offers | |||


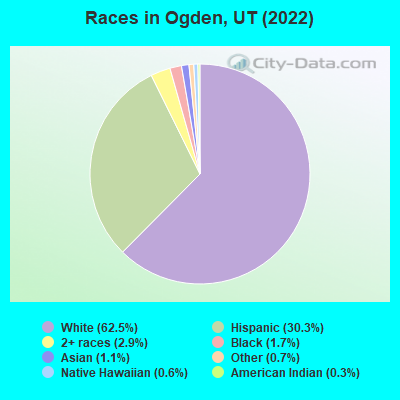
- 54,27162.5%White alone
- 26,29430.3%Hispanic
- 2,4802.9%Two or more races
- 1,4441.7%Black alone
- 9781.1%Asian alone
- 6210.7%Other race alone
- 4840.6%Native Hawaiian and Other
Pacific Islander alone - 2410.3%American Indian alone
Races in Ogden detailed stats: ancestries, foreign born residents, place of birth
According to our research of Utah and other state lists, there were 676 registered sex offenders living in Ogden, Utah as of April 27, 2024.
The ratio of all residents to sex offenders in Ogden is 129 to 1.
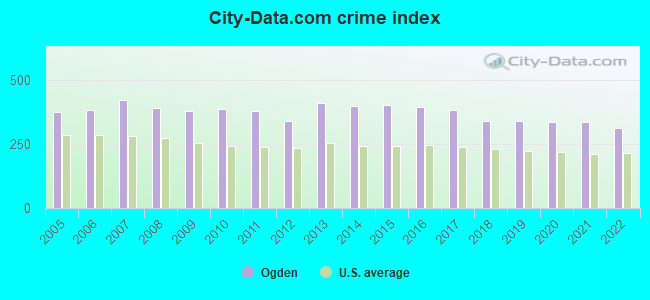
The City-Data.com crime index weighs serious crimes and violent crimes more heavily. Higher means more crime, U.S. average is 246.1. It adjusts for the number of visitors and daily workers commuting into cities.
- means the value is smaller than the state average.- means the value is about the same as the state average.
- means the value is bigger than the state average.
- means the value is much bigger than the state average.
Crime rate in Ogden detailed stats: murders, rapes, robberies, assaults, burglaries, thefts, arson
Full-time law enforcement employees in 2021, including police officers: 165 (125 officers - 116 male; 9 female).
| Officers per 1,000 residents here: | 1.42 |
| Utah average: | 1.67 |
 Recent articles from our blog. Our writers, many of them Ph.D. graduates or candidates, create easy-to-read articles on a wide variety of topics.

 | Ogden vs American Fork (4 replies) |
| Had Anyone Ever Has or Had Jobs At A Telemarketing Service In Salt. Lake City Or Ogden. (7 replies) |
| Trip Report: Ogden (5 replies) |
| Relocating to Ogden from Nashville Tn (24 replies) |
| Coming to explore for possible relocation. (18 replies) |
| Mt > ut (8 replies) |
Latest news from Ogden, UT collected exclusively by city-data.com from local newspapers, TV, and radio stations
Ancestries: English (13.4%), European (8.7%), American (6.7%), German (4.2%), Irish (2.7%), Dutch (1.4%).
Current Local Time: MST time zone
Incorporated on 02/06/1851
Elevation: 4299 feet
Land area: 26.6 square miles.
Population density: 3,260 people per square mile (average).
9,777 residents are foreign born (8.5% Latin America).
| This city: | 11.0% |
| Utah: | 8.4% |
Median real estate property taxes paid for housing units with mortgages in 2022: $2,298 (0.6%)
Median real estate property taxes paid for housing units with no mortgage in 2022: $2,315 (0.7%)
Nearest city with pop. 200,000+: Northeast Jefferson, CO (374.7 miles  , pop. 450,166).
Nearest city with pop. 1,000,000+: Phoenix, AZ (532.6 miles , pop. 1,321,045).
Nearest cities:
), ), ), ), ), Latitude: 41.23 N, Longitude: 111.96 W
Daytime population change due to commuting: +19,949 (+23.0%)
Workers who live and work in this city: 25,785 (56.8%)
Area code: 801
Ogden tourist attractions:
- 25th Street Historic District - Ogden, Utah - District Featuring Shops, Restaurants and Entertainment
- Dinosaur Park and Museum - Ogden, Utah - Dinosaur Themed Park and Museum
- Hill Aerospace Museum - Ogden, Utah - Aviation and Military Museum
- Wolf Creek Utah Ski Resort - Eden, Utah - Ski, Snowboard, Terrain Park, was Nordic Valley
- Powder Mountain - Eden, Utah - Skiing, Snowboarding, Snowkiting, MotoX, 4x4 tours
- Newgate Mall - Ogden, Utah - Indoor Shopping Mall, Movie Theater, Children's play area
- Pineview Reservoir - Ogden, Utah - Scenic Reservoir With Boating and Fishing
- Treehouse Children's Museum - Ogden, Utah - Museum
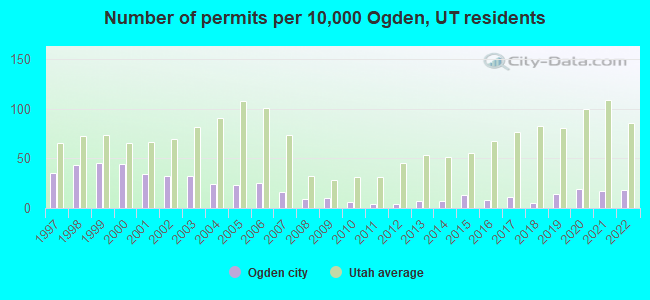
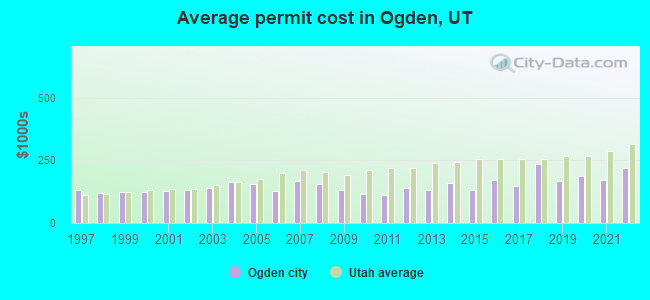
Single-family new house construction building permits:
- 2022: 141 buildings, average cost: $218,000
- 2021: 132 buildings, average cost: $170,800
- 2020: 149 buildings, average cost: $188,300
- 2019: 107 buildings, average cost: $168,100
- 2018: 36 buildings, average cost: $233,900
- 2017: 84 buildings, average cost: $149,300
- 2016: 61 buildings, average cost: $169,500
- 2015: 98 buildings, average cost: $130,100
- 2014: 57 buildings, average cost: $157,800
- 2013: 52 buildings, average cost: $132,700
- 2012: 34 buildings, average cost: $139,200
- 2011: 30 buildings, average cost: $112,100
- 2010: 50 buildings, average cost: $117,100
- 2009: 81 buildings, average cost: $131,500
- 2008: 73 buildings, average cost: $153,900
- 2007: 121 buildings, average cost: $168,900
- 2006: 193 buildings, average cost: $127,600
- 2005: 181 buildings, average cost: $156,800
- 2004: 183 buildings, average cost: $163,400
- 2003: 250 buildings, average cost: $138,700
- 2002: 247 buildings, average cost: $130,000
- 2001: 262 buildings, average cost: $126,500
- 2000: 336 buildings, average cost: $122,000
- 1999: 351 buildings, average cost: $122,400
- 1998: 335 buildings, average cost: $120,800
- 1997: 273 buildings, average cost: $132,000
| Here: | 3.1% |
| Utah: | 2.5% |
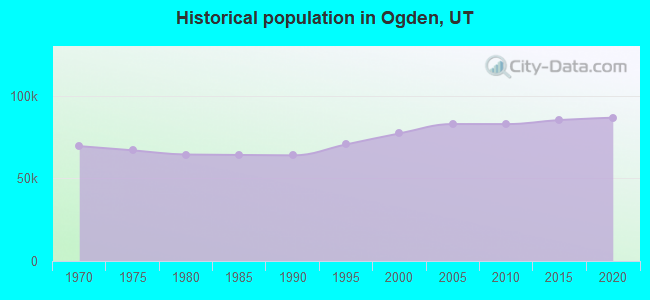
Population change in the 1990s: +12,819 (+19.9%).
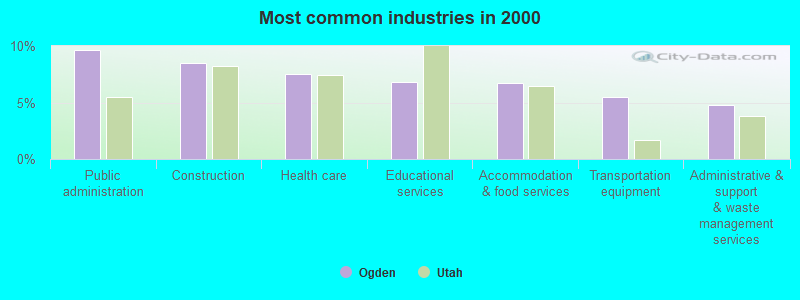
- Public administration (9.7%)
- Construction (8.5%)
- Health care (7.6%)
- Educational services (6.8%)
- Accommodation & food services (6.7%)
- Transportation equipment (5.5%)
- Administrative & support & waste management services (4.8%)
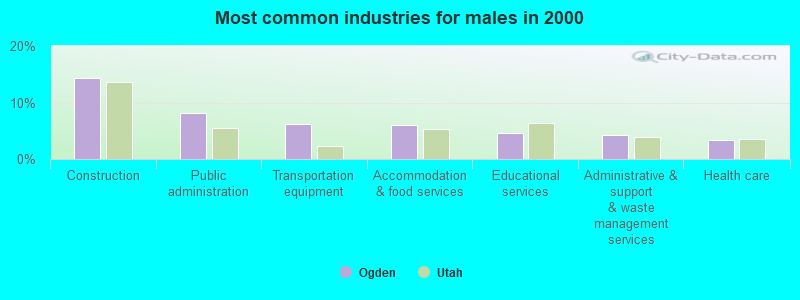
- Construction (14.4%)
- Public administration (8.1%)
- Transportation equipment (6.2%)
- Accommodation & food services (6.0%)
- Educational services (4.5%)
- Administrative & support & waste management services (4.3%)
- Health care (3.3%)
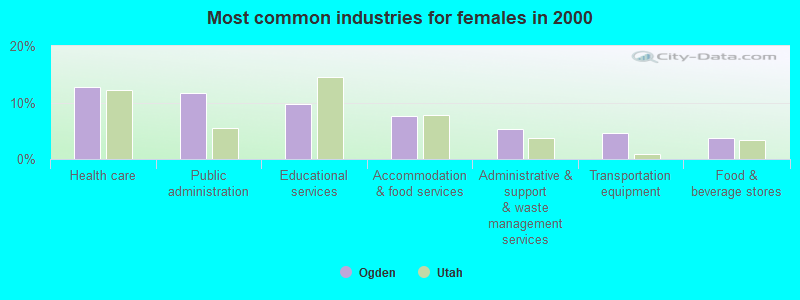
- Health care (12.8%)
- Public administration (11.6%)
- Educational services (9.7%)
- Accommodation & food services (7.6%)
- Administrative & support & waste management services (5.4%)
- Transportation equipment (4.6%)
- Food & beverage stores (3.8%)
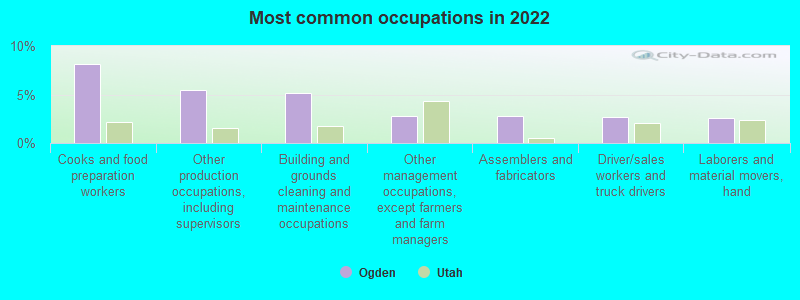
- Cooks and food preparation workers (8.1%)
- Other production occupations, including supervisors (5.5%)
- Building and grounds cleaning and maintenance occupations (5.2%)
- Other management occupations, except farmers and farm managers (2.8%)
- Assemblers and fabricators (2.8%)
- Driver/sales workers and truck drivers (2.7%)
- Laborers and material movers, hand (2.6%)
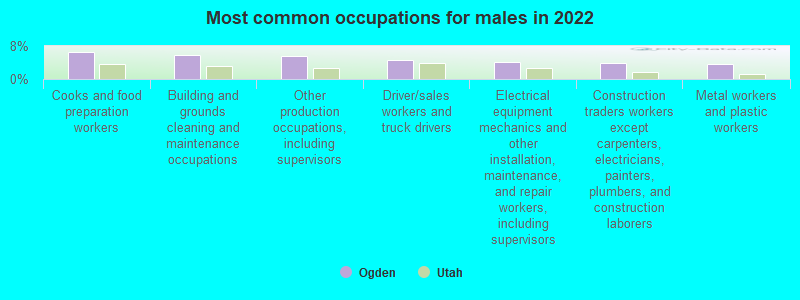
- Cooks and food preparation workers (6.5%)
- Building and grounds cleaning and maintenance occupations (5.8%)
- Other production occupations, including supervisors (5.5%)
- Driver/sales workers and truck drivers (4.7%)
- Electrical equipment mechanics and other installation, maintenance, and repair workers, including supervisors (4.0%)
- Construction traders workers except carpenters, electricians, painters, plumbers, and construction laborers (3.8%)
- Metal workers and plastic workers (3.5%)
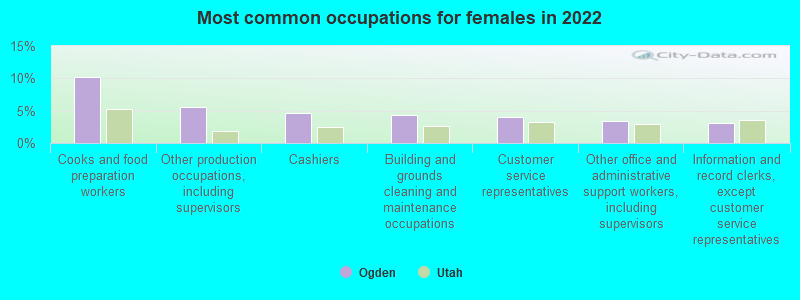
- Cooks and food preparation workers (10.2%)
- Other production occupations, including supervisors (5.5%)
- Cashiers (4.6%)
- Building and grounds cleaning and maintenance occupations (4.4%)
- Customer service representatives (4.0%)
- Other office and administrative support workers, including supervisors (3.5%)
- Information and record clerks, except customer service representatives (3.1%)
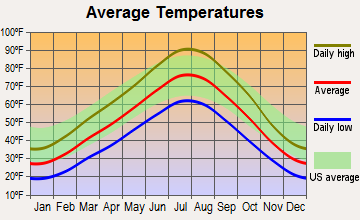
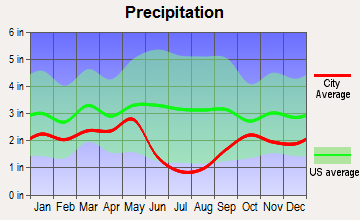
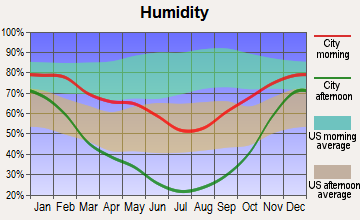
Average climate in Ogden, Utah
Based on data reported by over 4,000 weather stations
|
|

(lower is better)
Air Quality Index (AQI) level in 2023 was 89.8. This is worse than average.
| City: | 89.8 |
| U.S.: | 72.6 |
Carbon Monoxide (CO) [ppm] level in 2023 was 0.219. This is about average. Closest monitor was 0.7 miles away from the city center.
| City: | 0.219 |
| U.S.: | 0.251 |
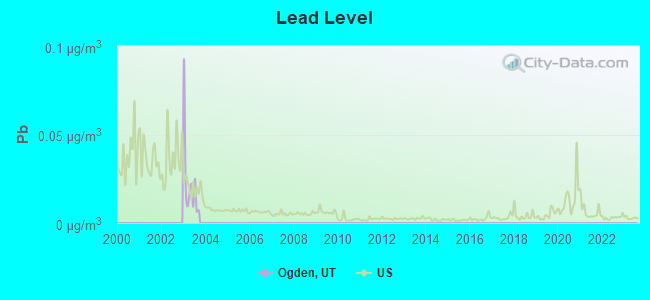
Nitrogen Dioxide (NO2) [ppb] level in 2023 was 7.50. This is significantly worse than average. Closest monitor was 0.7 miles away from the city center.
| City: | 7.50 |
| U.S.: | 5.11 |
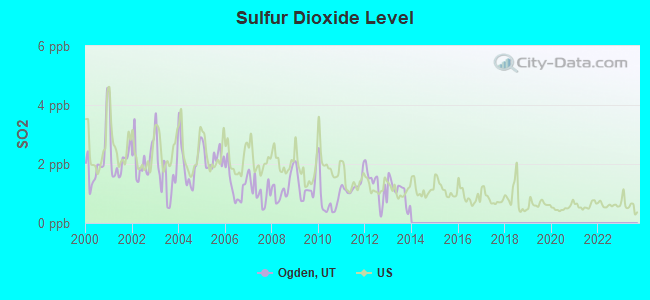
Sulfur Dioxide (SO2) [ppb] level in 2013 was 1.07. This is significantly better than average. Closest monitor was 0.7 miles away from the city center.
| City: | 1.07 |
| U.S.: | 1.51 |
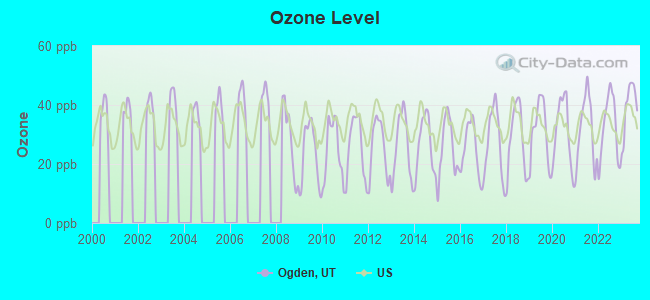
Ozone [ppb] level in 2023 was 39.4. This is about average. Closest monitor was 0.8 miles away from the city center.
| City: | 39.4 |
| U.S.: | 33.3 |
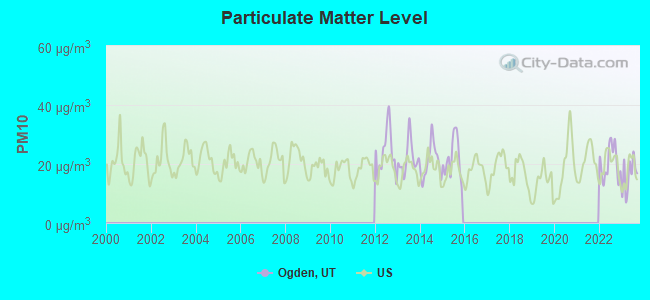
Particulate Matter (PM10) [µg/m3] level in 2023 was 16.2. This is about average. Closest monitor was 0.8 miles away from the city center.
| City: | 16.2 |
| U.S.: | 19.2 |
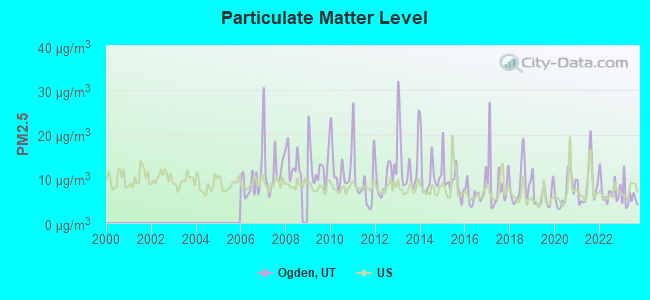
Particulate Matter (PM2.5) [µg/m3] level in 2023 was 5.85. This is better than average. Closest monitor was 0.8 miles away from the city center.
| City: | 5.85 |
| U.S.: | 8.11 |
Earthquake activity:
Ogden-area historical earthquake activity is significantly above Utah state average. It is 2099% greater than the overall U.S. average.On 8/18/1959 at 06:37:13, a magnitude 7.7 (7.7 UK, Class: Major, Intensity: VIII - XII) earthquake occurred 240.2 miles away from the city center, causing $26,000,000 total damage
On 10/28/1983 at 14:06:06, a magnitude 7.3 (6.2 MB, 7.3 MS, 7.0 MW) earthquake occurred 218.2 miles away from Ogden center, causing 2 deaths (2 shaking deaths) and 3 injuries, causing $15,000,000 total damage
On 10/3/1915 at 06:52:48, a magnitude 7.6 (7.6 UK) earthquake occurred 294.0 miles away from the city center
On 3/28/1975 at 02:31:05, a magnitude 6.2 (6.1 MB, 6.0 MS, 6.2 ML, Class: Strong, Intensity: VII - IX) earthquake occurred 60.4 miles away from the city center
On 3/18/2020 at 13:09:31, a magnitude 5.7 (5.7 MW, Depth: 7.4 mi, Class: Moderate, Intensity: VI - VII) earthquake occurred 33.5 miles away from the city center
On 12/21/1932 at 06:10:09, a magnitude 7.2 (7.2 UK) earthquake occurred 375.3 miles away from Ogden center
Magnitude types: body-wave magnitude (MB), local magnitude (ML), surface-wave magnitude (MS), moment magnitude (MW)
Natural disasters:
The number of natural disasters in Weber County (8) is smaller than the US average (15).Major Disasters (Presidential) Declared: 4
Emergencies Declared: 2
Causes of natural disasters: Floods: 4, Landslides: 2, Storms: 2, Drought: 1, Fire: 1, Heavy Rain: 1, Hurricane: 1, Mudslide: 1, Snow: 1, Other: 1 (Note: some incidents may be assigned to more than one category).
Main business address for: AUTOLIV INC (MOTOR VEHICLE PARTS & ACCESSORIES).
Hospitals in Ogden:
- APPLEGATE HOME CARE AND HOSPICE (1140 36TH STREET)
- HEARTS FOR HOSPICE - OGDEN (942 CHAMBERS STREET, SUITE 16)
- MCKAY DEE HOSPITAL CENTER (Voluntary non-profit - Private, provides emergency services, 4401 HARRISON BOULEVARD)
- OGDEN REGIONAL MEDICAL CENTER (Proprietary, 5475 SOUTH 500 EAST)
- TRINITY MISSION WIDE HORIZONS RES CARE FACILITY (910 MONROE BOULEVARD)
- VISTA HOSPICE CARE, INC DBA VISTACARE (425 EAST 5350 SOUTH, SUITE 155)
Nursing Homes in Ogden:
- ASPEN CARE CENTER (2325 MADISON AVENUE)
- CRESTWOOD CARE CENTER (3665 BRINKER AVENUE)
- GEORGE E WAHLEN OGDEN VETERANS HOME (1102 NORTH 1200 WEST)
- KINDRED NURSING AND REHABILITATION - WASATCH CARE (3430 HARRISON BOULEVARD)
- LOMOND PEAK CARE AND REHAB (524 EAST 800 NORTH)
- MANOR CARE HEALTH SERVICES - SOUTH OGDEN (5540 SOUTH 1050 EAST)
- MCKAY-DEE HOSPITAL TRANSITIONAL CARE CENTER (4401 HARRISON BOULEVARD)
- MOUNTAIN VIEW HEALTH SERVICES (5865 SOUTH WASATCH DRIVE)
- OGDEN REG MEDICAL CENTER TCU (5475 SOUTH 500 EAST)
- PINE VIEW TRANSITIONAL REHAB (1497 EAST SKYLINE DRIVE)
- WASHINGTON TERRACE CARE AND REHABILITATION CENTER (400 EAST 5350 SOUTH)
Dialysis Facilities in Ogden:
- BONNEVILLE DIALYSIS CENTER (5575 S 500 E)
- LIBERTY DIALYSIS - OGDEN (4780 OLD POST RD)
- MARK LINDSAY DIALYSIS CENTER (1154 E COUNTRY HILLS DR)
- PLEASANT VIEW DIALYSIS CENTER (2715 N HIGHWAY 89)
- WEBER VALLEY DIALYSIS (DVA) (1920 W 250 N)
Home Health Centers in Ogden:
Airports and heliports located in Ogden:
- Ogden-Hinckley Airport (OGD) (Runways: 3, Commercial Ops: 239, Air Taxi Ops: 3,686, Itinerant Ops: 33,217, Local Ops: 52,754, Military Ops: 249)
- Hill Afb Airport (HIF) (Runways: 1)
- Mc Kay-Dee Hospital Center Heliport (UT16)
Colleges/Universities in Ogden:
- Weber State University (Full-time enrollment: 17,655; Location: 3848 Harrison Blvd; Public; Website: www.weber.edu; Offers Master's degree)
- Ogden-Weber Applied Technology College (Full-time enrollment: 1,168; Location: 200 N Washington Blvd; Public; Website: www.owatc.edu)
- Paul Mitchell the School-Ogden (Full-time enrollment: 112; Location: 2285 Grant Avenue; Private, for-profit; Website: ogden.paulmitchell.edu/)
- Nightingale College (Full-time enrollment: 41; Location: 4155 Harrison Blvd. #100; Private, for-profit; Website: www.nightingale.edu)
Other colleges/universities with over 2000 students near Ogden:
- Latter-day Saints Business College (about 32 miles; Salt Lake City, UT; Full-time enrollment: 2,059)
- University of Utah (about 33 miles; Salt Lake City, UT; FT enrollment: 28,454)
- Westminster College (about 35 miles; Salt Lake City, UT; FT enrollment: 2,870)
- Utah State University (about 37 miles; Logan, UT; FT enrollment: 21,131)
- Western Governors University (about 38 miles; Salt Lake City, UT; FT enrollment: 31,481)
- Salt Lake Community College (about 39 miles; Salt Lake City, UT; FT enrollment: 20,797)
- Stevens-Henager College-Murray (about 40 miles; Murray, UT; FT enrollment: 6,395)
Biggest public high schools in Ogden:
- WEBER HIGH (Students: 1,794, Location: 430 W WEBER HIGH DR, Grades: 10-12)
- BONNEVILLE HIGH (Students: 1,357, Location: 251 E 4800 S, Grades: 10-12)
- OGDEN HIGH (Students: 1,143, Location: 2828 HARRISON BLVD, Grades: 10-12)
- BEN LOMOND HIGH (Students: 1,058, Location: 1080 9TH STREET, Grades: 10-12)
- MOUNT OGDEN JUNIOR HIGH (Students: 934, Location: 3260 HARRISON BLVD, Grades: 7-9)
- HIGHLAND JUNIOR HIGH (Students: 888, Location: 325 GRAMERCY AVE, Grades: 7-9)
- SOUTH OGDEN JR HIGH (Students: 854, Location: 650 E PLEASANT VALLEY DR, Grades: 7-9)
- MOUND FORT JUNIOR HIGH (Students: 782, Location: 1400 MOUND FORT DR, Grades: 7-9)
- NORTH OGDEN JR HIGH (Students: 685, Location: 575 E 2900 N, Grades: 7-9)
- T H BELL JR HIGH (Students: 607, Location: 165 W 5100 S, Grades: 7-9)
Private high schools in Ogden:
- ST JOSEPH CATHOLIC HIGH SCHOOL (Students: 173, Location: 1790 LAKE ST, Grades: 9-12)
- OAKGROVE SCHOOL (Students: 40, Location: 1325 WASHINGTON BLVD, Grades: 7-12)
- BEREAN BAPTIST ACADEMY (Students: 13, Location: 3846 JACKSON AVE, Grades: PK-9)
- MCKAY DEE SCHOOL (Students: 11, Location: 5030 HARRISON BLVD, Grades: 7-12)
Biggest public elementary/middle schools in Ogden:
- FARR WEST SCHOOL (Students: 808, Location: 2190 W 2700 N, Grades: KG-6)
- WASATCH SCHOOL (Students: 775, Location: 3370 POLK AVE, Grades: KG-6)
- HERITAGE SCHOOL (Students: 726, Location: 373 S 150 W, Grades: KG-6)
- JAMES MADISON SCHOOL (Students: 682, Location: 2563 MONROE BLVD, Grades: PK-6)
- UINTAH SCHOOL (Students: 669, Location: 6115 S 2250 E, Grades: KG-6)
- PIONEER SCHOOL (Students: 654, Location: 250 N 1600 W, Grades: KG-6)
- BATES SCHOOL (Students: 647, Location: 850 E 3100 N, Grades: KG-6)
- NORTH OGDEN SCHOOL (Students: 645, Location: 530 E 2650 N, Grades: KG-6)
- LOMOND VIEW SCHOOL (Students: 627, Location: 3644 N 900 W, Grades: KG-6)
- SHADOW VALLEY SCHOOL (Students: 607, Location: 4911 S 1500 E, Grades: KG-6)
Private elementary/middle schools in Ogden:
Points of interest:
Notable locations in Ogden: The Family Center (A), Country Hills Plaza (B), Pioneer Power Plant (C), East Bench Substation (D), Edgewood Industrial Park (E), Ogden Commercial and Industrial Park Plat D (F), Ogden Commercial and Industrial Park Plat C (G), Ogden Commerical and Industrial Park Plat B (H), Ogden Commercial and Industrial Park Plat A (I), Coleman Industrial Subdivision (J), Intermountain Region Headquarters (K), Browning Center (L), Ogden City Fire Department Station 6 (M), Weber Basin Water Treatment Plant (N), Dee Events Center (O), Intermountain Experimental Station (P), Federal Building (Q), Kimball Visual Arts Center (R), Lampros Hall (S), LaSal Hall (T). Display/hide their locations on the map
Shopping Centers: Ogden City Mall (1), North Ogden Shopping Center (2), Newgate Mall (3). Display/hide their locations on the map
Main business address in Ogden: AUTOLIV INC (A). Display/hide its location on the map
Churches in Ogden include: Apostolic Assembly Church (A), Ascension Lutheran Church (B), Berean Baptist Church (C), Calvary Baptist Church and Spanish Mission (D), Canyon Road Assembly of God Church (E), Christian Reformed Church (F), Church of Christ (G), Church of God of Prophecy (H), Elim Lutheran Church (I). Display/hide their locations on the map
Cemeteries: Aultorest Memorial Park (1), Ogden City Cemetery (2). Display/hide their locations on the map
Lakes and reservoirs: Twenty First Street Pond (A), Beus Reservoir (B). Display/hide their locations on the map
Creek: Burch Creek (A). Display/hide its location on the map
Parks in Ogden include: Ninth Street Park (1), Canyon Park (2), Monroe Park (3), Mount Ogden Park (4), Liberty Park (5), Tabernacle Park (6), Lester Park (7), Smoot Park (8), Lorin Farr Park (9). Display/hide their locations on the map
Tourist attractions: Union Station - Gift Shop (Museums; 25 Wall) (1), Daughters of Utah Pioneers Museum (2148 Grant Avenue) (2), Treehouse Children's Museum (455 23rd Street) (3), Classic Skating Center (Water Parks & Slides; 4181 Riverdale Road) (4), Ogden Raptors (Amusement & Theme Parks; 2330 Lincoln Ave) (5), Nickelcade (Amusement & Theme Parks; 4046 Riverdale Road) (6), Chambers Music CO (Amusement & Theme Parks; 2953 Grant Avenue) (7), Dugout at Golf City (Amusement & Theme Parks; 1400 East 5600 South) (8), Cold Springs Trout Farm (Amusement & Theme Parks; 2284 Fruitland Drive) (9). Display/hide their approximate locations on the map
Hotels: Ogden River Inn (1825 Washington Boulevard) (1), Red Roof Inns (1500 West Riverdale Road) (2), Hampton Inn (2401 Washington Boulevard) (3), Ben Lomond Historic Suite Hotel (2510 Washington Boulevard) (4), Super 8 Ogden UT (1508 West 2100 South) (5), Western Inn Ogden (1155 South 1700 West) (6), Millstream Motel (1450 Washington Boulevard) (7), Hampton Inn and Suites Ogden- UT (2401 Washington Boulevard) (8), Marriott Ogden (247 24th Street) (9). Display/hide their approximate locations on the map
Courts: Pleasant View City - Justice Court (520 West Elberta Drive) (1), Ogden City - Justice Court (320 26th) (2), Weber County - Courts- Justice Court (2380 Washington Boulevard) (3). Display/hide their approximate locations on the map
Birthplace of: Fawn M. Brodie - Biographer, Brent Scowcroft - Air Force general, Parker Jacobs - Musician and TV art director, Mike Poulson - Bicycle motocross rider, Mason Unck - 2005 NFL player (Cleveland Browns, born: Sep 7, 1980), Bernard DeVoto - Book editor, James Cruze - Silent film actor, Janath R. Cannon - A counselor in the general presidency of the Relief Society of the LDS Church., Solon Borglum - Artist, Brant Boyer - 2005 NFL player (Cleveland Browns, born: Jun 27, 1971).
Drinking water stations with addresses in Ogden and their reported violations in the past:
FARMINGTON CITY WATER SYSTEM (Population served: 18,000, Purch surface water):Past monitoring violations:TAYLOR-WEST WEBER WID (Population served: 6,510, Purch surface water):
- Monitoring and Reporting (DBP) - Between JAN-2013 and MAR-2013, Contaminant: Total Haloacetic Acids (HAA5). Follow-up actions: St Public Notif requested (MAY-19-2013), St Compliance achieved (MAY-19-2013), St Formal NOV issued (MAY-19-2013)
- Monitoring and Reporting (DBP) - Between JAN-2013 and MAR-2013, Contaminant: TTHM. Follow-up actions: St Public Notif requested (MAY-19-2013), St Compliance achieved (MAY-19-2013), St Formal NOV issued (MAY-19-2013)
- 36 regular monitoring violations
Past monitoring violations:UINTAH HIGHLANDS IMPROVEMENT DISTRICT (Population served: 2,230, Purch surface water):
- Follow-up Or Routine LCR Tap M/R - In OCT-01-2010, Contaminant: Lead and Copper Rule. Follow-up actions: St Compliance achieved (SEP-12-2011)
- 2 minor monitoring violations
- 2 regular monitoring violations
Past monitoring violations:WEST WARREN -WARREN IMPROVEMENT DISTRICT (Population served: 800, Purch surface water):
- Follow-up Or Routine LCR Tap M/R - In JAN-01-2003, Contaminant: Lead and Copper Rule. Follow-up actions: St Compliance achieved (SEP-15-2009)
- 3 regular monitoring violations
Past monitoring violations:COLD WATER CANYON - CUTTLER FLATS (Population served: 500, Purch groundwater):
- Monitoring and Reporting (DBP) - Between OCT-2012 and DEC-2012, Contaminant: TTHM. Follow-up actions: St Public Notif requested (FEB-17-2013), St Compliance achieved (FEB-17-2013), St Formal NOV issued (FEB-17-2013)
- Monitoring and Reporting (DBP) - Between OCT-2012 and DEC-2012, Contaminant: Total Haloacetic Acids (HAA5). Follow-up actions: St Public Notif requested (FEB-17-2013), St Compliance achieved (FEB-17-2013), St Formal NOV issued (FEB-17-2013)
- Follow-up Or Routine LCR Tap M/R - In OCT-01-2007, Contaminant: Lead and Copper Rule. Follow-up actions: St Compliance achieved (FEB-10-2011)
Past health violations:CAMP NEW FORK-BOY SCOUTS OF AMERICA (Serves WY, Population served: 450, Groundwater):Past monitoring violations:
- MCL, Monthly (TCR) - In MAY-2013, Contaminant: Coliform. Follow-up actions: St Formal NOV issued (JUL-06-2013), St Public Notif requested (JUL-06-2013)
- Monitoring, Source Water (GWR) - In JUL-01-2014, Contaminant: E. COLI
- Monitoring, Source Water (GWR) - In JUN-01-2013, Contaminant: E. COLI. Follow-up actions: St Formal NOV issued (JUL-25-2013), St Public Notif requested (JUL-25-2013)
- One routine major monitoring violation
- 2 minor monitoring violations
Past health violations:NORTH FORK PARK (Population served: 302, Purch groundwater):Past monitoring violations:
- MCL, Monthly (TCR) - Between JUL-2012 and SEP-2012, Contaminant: Coliform. Follow-up actions: St Public Notif received (2 times from SEP-27-2012 to OCT-31-2012), Fed FAO issued (MAY-06-2013), St Compliance achieved (JUN-05-2013)
- 3 routine major monitoring violations
- 2 minor monitoring violations
Past monitoring violations:CAMP LOLL- BOY SCOUT CAMP (Serves WY, Population served: 300, Groundwater):
- Monitoring, Repeat Major (TCR) - In MAY-2013, Contaminant: Coliform (TCR). Follow-up actions: St Formal NOV issued (JUL-06-2013), St Public Notif requested (JUL-06-2013)
- Failure To Address Deficiency - In APR-02-2010, Contaminant: GROUNDWATER RULE. Follow-up actions: St Formal NOV issued (3 times from APR-19-2012 to APR-19-2012), St Public Notif requested (3 times from APR-19-2012 to APR-19-2013)
- One routine major monitoring violation
Past monitoring violations:
- One routine major monitoring violation
Drinking water stations with addresses in Ogden that have no violations reported:
- BONA VISTA WATER DISTRICT (Population served: 19,500, Primary Water Source Type: Purch surface water)
- NORTH OGDEN BI-CENTENNIAL PARK (Population served: 25, Primary Water Source Type: Groundwater)
| This city: | 2.7 people |
| Utah: | 3.1 people |
| This city: | 64.5% |
| Whole state: | 75.2% |
| This city: | 7.6% |
| Whole state: | 4.6% |
Likely homosexual households (counted as self-reported same-sex unmarried-partner households)
- Lesbian couples: 0.5% of all households
- Gay men: 0.3% of all households
People in group quarters in Ogden in 2010:
- 926 people in local jails and other municipal confinement facilities
- 260 people in nursing facilities/skilled-nursing facilities
- 211 people in college/university student housing
- 175 people in emergency and transitional shelters (with sleeping facilities) for people experiencing homelessness
- 154 people in correctional residential facilities
- 112 people in other noninstitutional facilities
- 94 people in group homes intended for adults
- 47 people in residential treatment centers for adults
- 32 people in correctional facilities intended for juveniles
- 30 people in residential treatment centers for juveniles (non-correctional)
- 19 people in group homes for juveniles (non-correctional)
People in group quarters in Ogden in 2000:
- 590 people in other noninstitutional group quarters
- 429 people in college dormitories (includes college quarters off campus)
- 367 people in nursing homes
- 226 people in local jails and other confinement facilities (including police lockups)
- 186 people in other types of correctional institutions
- 142 people in other nonhousehold living situations
- 102 people in homes or halfway houses for drug/alcohol abuse
- 77 people in schools, hospitals, or wards for the intellectually disabled
- 50 people in residential treatment centers for emotionally disturbed children
- 46 people in homes for the mentally ill
- 37 people in halfway houses
- 31 people in other group homes
- 27 people in short-term care, detention or diagnostic centers for delinquent children
- 16 people in training schools for juvenile delinquents
- 13 people in mental (psychiatric) hospitals or wards
- 8 people in homes for abused, dependent, and neglected children
- 5 people in homes for the mentally retarded
- 4 people in unknown juvenile institutions
Banks with branches in Ogden (2011 data):
- Wells Fargo Bank, National Association: 7 branches. Info updated 2011/04/05: Bank assets: $1,161,490.0 mil, Deposits: $905,653.0 mil, headquarters in Sioux Falls, SD, positive income, 6395 total offices, Holding Company: Wells Fargo & Company
- Zions First National Bank: Ogden Branch, North Ogden Banking Center Branch, Weber State University Intermittent, Newgate Office, Harrison Boulevard Branch. Info updated 2006/11/03: Bank assets: $17,531.3 mil, Deposits: $14,905.3 mil, headquarters in Salt Lake City, UT, positive income, Commercial Lending Specialization, 151 total offices, Holding Company: Zions Bancorporation
- U.S. Bank National Association: Harrison Boulevard Smiths Branch, Ogden Smiths Branch, Ogden Branch, Ogden Walmart Branch. Info updated 2012/01/30: Bank assets: $330,470.8 mil, Deposits: $236,091.5 mil, headquarters in Cincinnati, OH, positive income, 3121 total offices, Holding Company: U.S. Bancorp
- KeyBank National Association: Harrison Branch, Five-Points Branch, Newgate Branch, Ogden Main Bldg Branch. Info updated 2008/03/03: Bank assets: $86,198.8 mil, Deposits: $64,214.8 mil, headquarters in Cleveland, OH, positive income, Commercial Lending Specialization, 1067 total offices, Holding Company: Keycorp
- Bank of Utah: Bank Of Utah, South Ogden Branch, Ben Lomond Branch. Info updated 2006/11/03: Bank assets: $745.8 mil, Deposits: $601.1 mil, local headquarters, positive income, Commercial Lending Specialization, 13 total offices, Holding Company: Bou Bancorp, Inc.
- JPMorgan Chase Bank, National Association: Ogden Branch, Wall & 12th Banking Center Branch, Weber. Info updated 2011/11/10: Bank assets: $1,811,678.0 mil, Deposits: $1,190,738.0 mil, headquarters in Columbus, OH, positive income, International Specialization, 5577 total offices, Holding Company: Jpmorgan Chase & Co.
- Wells Fargo Bank Northwest, National Association: at 3889 Washington Boulevard, branch established on 1881/01/01
- Transportation Alliance Bank, Inc.: at 4185 Harrison Boulevard, Suite 200, branch established on 1998/10/01. Info updated 2011/01/31: Bank assets: $852.1 mil, Deposits: $714.5 mil, local headquarters, positive income, Commercial Lending Specialization, 1 total offices
For population 15 years and over in Ogden:
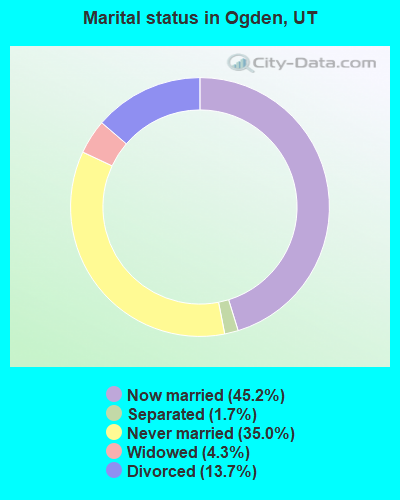
- Never married: 35.0%
- Now married: 45.2%
- Separated: 1.7%
- Widowed: 4.3%
- Divorced: 13.7%
For population 25 years and over in Ogden:
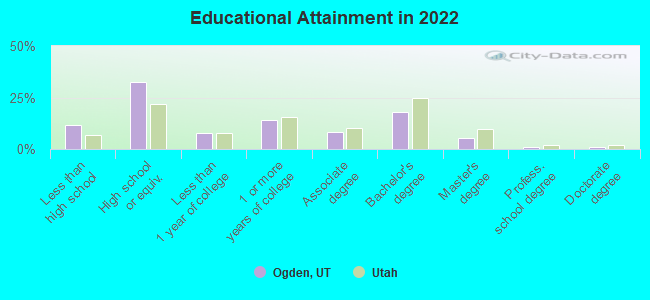
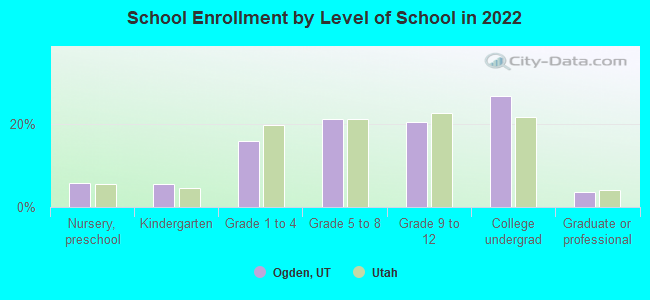
- High school or higher: 88.5%
- Bachelor's degree or higher: 25.7%
- Graduate or professional degree: 7.6%
- Unemployed: 8.7%
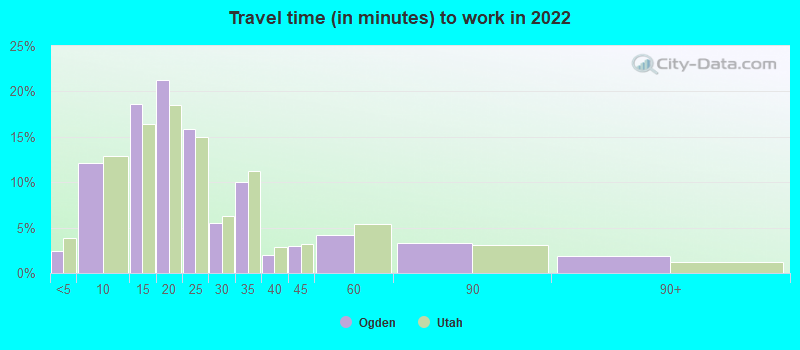
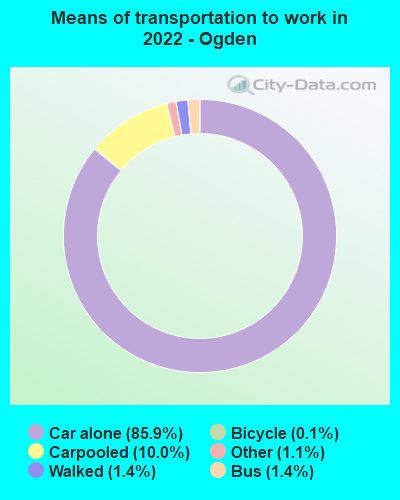
- Mean travel time to work (commute): 16.9 minutes
| Here: | 12.6 |
| Utah average: | 10.9 |
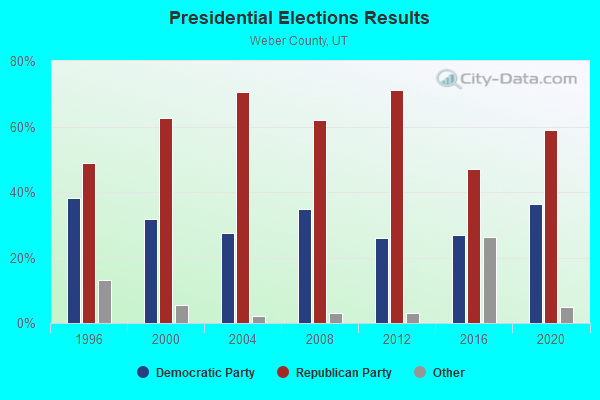
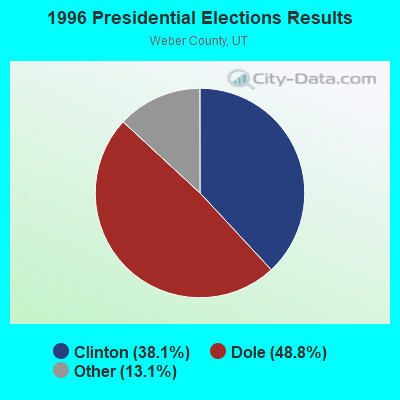
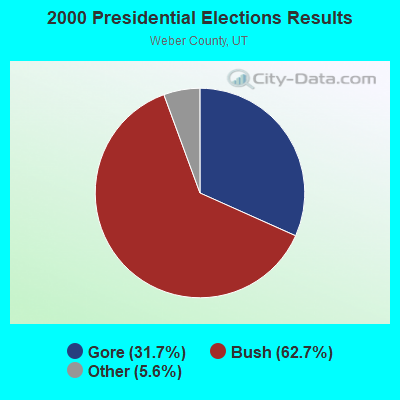
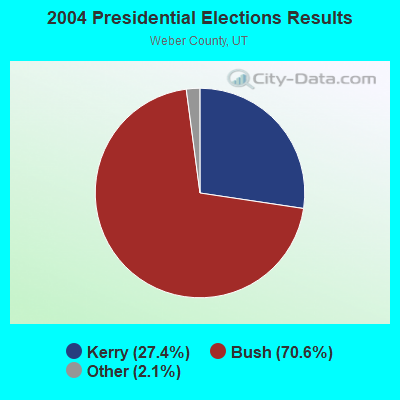
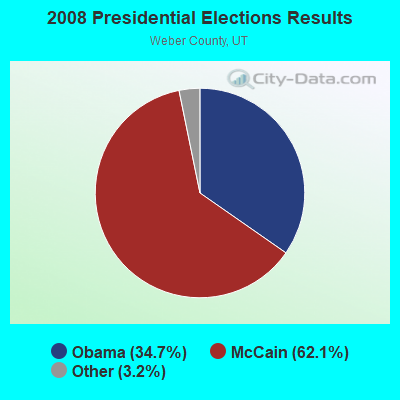
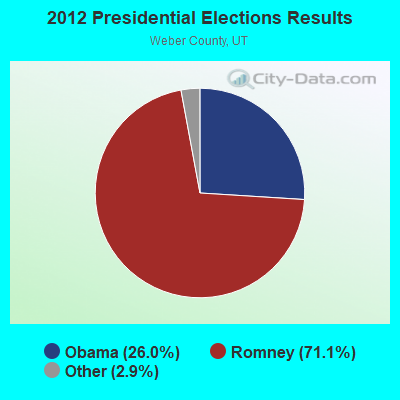
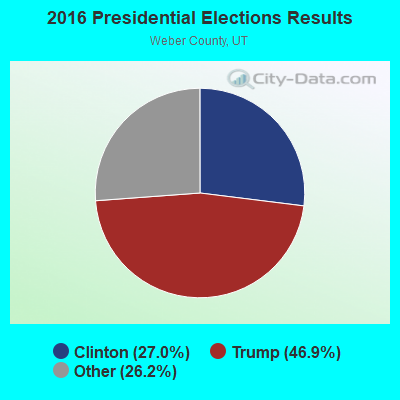

Graphs represent county-level data. Detailed 2008 Election Results
Religion statistics for Ogden, UT (based on Weber County data)
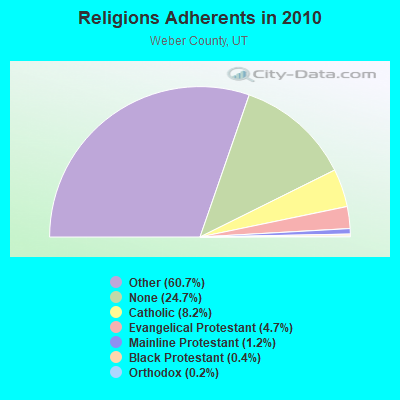
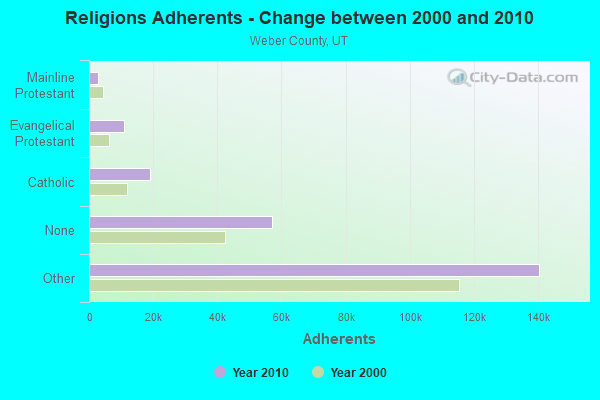
| Religion | Adherents | Congregations |
|---|---|---|
| Other | 140,427 | 324 |
| Catholic | 18,933 | 6 |
| Evangelical Protestant | 10,761 | 52 |
| Mainline Protestant | 2,761 | 11 |
| Black Protestant | 887 | 4 |
| Orthodox | 350 | 1 |
| None | 57,117 | - |
Food Environment Statistics:
| This county: | 1.35 / 10,000 pop. |
| State: | 1.37 / 10,000 pop. |
| Weber County: | 0.23 / 10,000 pop. |
| Utah: | 0.18 / 10,000 pop. |
| Weber County: | 0.72 / 10,000 pop. |
| State: | 0.41 / 10,000 pop. |
| Weber County: | 2.62 / 10,000 pop. |
| Utah: | 2.82 / 10,000 pop. |
| Weber County: | 4.79 / 10,000 pop. |
| Utah: | 5.09 / 10,000 pop. |
| Weber County: | 7.1% |
| Utah: | 6.3% |
| Here: | 25.7% |
| Utah: | 23.6% |
Health and Nutrition:
| Here: | 47.3% |
| Utah: | 48.9% |
| This city: | 44.8% |
| Utah: | 47.0% |
| Ogden: | 28.4 |
| Utah: | 28.4 |
| This city: | 21.5% |
| State: | 21.0% |
| This city: | 11.1% |
| Utah: | 10.3% |
| This city: | 6.8 |
| State: | 6.8 |
| This city: | 31.1% |
| State: | 31.9% |
| This city: | 55.3% |
| State: | 57.4% |
| This city: | 79.5% |
| Utah: | 80.1% |
More about Health and Nutrition of Ogden, UT Residents
| Local government employment and payroll (March 2022) | |||||
| Function | Full-time employees | Monthly full-time payroll | Average yearly full-time wage | Part-time employees | Monthly part-time payroll |
|---|---|---|---|---|---|
| Police Protection - Officers | 145 | $814,137 | $67,377 | 0 | $0 |
| Firefighters | 76 | $480,633 | $75,889 | 8 | $1,503 |
| Water Supply | 47 | $204,727 | $52,271 | 0 | $0 |
| Parks and Recreation | 47 | $213,209 | $54,436 | 56 | $40,299 |
| Financial Administration | 42 | $230,310 | $65,803 | 7 | $10,089 |
| Streets and Highways | 34 | $168,722 | $59,549 | 2 | $637 |
| Other and Unallocable | 33 | $154,892 | $56,324 | 1 | $1,044 |
| Other Government Administration | 32 | $213,621 | $80,108 | 10 | $8,679 |
| Police - Other | 31 | $133,779 | $51,785 | 51 | $49,865 |
| Housing and Community Development (Local) | 29 | $176,242 | $72,928 | 6 | $7,041 |
| Health | 27 | $161,092 | $71,596 | 9 | $2,194 |
| Judicial and Legal | 25 | $156,085 | $74,921 | 4 | $16,791 |
| Sewerage | 16 | $63,387 | $47,540 | 0 | $0 |
| Solid Waste Management | 15 | $50,589 | $40,471 | 0 | $0 |
| Fire - Other | 9 | $71,886 | $95,848 | 2 | $2,502 |
| Airports | 7 | $43,171 | $74,007 | 3 | $3,174 |
| Totals for Government | 615 | $3,336,482 | $65,102 | 159 | $143,819 |
Ogden government finances - Expenditure in 2021 (per resident):
- Construction - Regular Highways: $6,883,000 ($79.27)
General - Other: $5,592,000 ($64.41)
Parks and Recreation: $1,873,000 ($21.57)
Central Staff Services: $1,026,000 ($11.82)
Housing and Community Development: $722,000 ($8.32)
Water Utilities: $568,000 ($6.54)
Sewerage: $100,000 ($1.15)
Local Fire Protection: $75,000 ($0.86)
Air Transportation: $26,000 ($0.30)
- Current Operations - General - Other: $29,497,000 ($339.73)
Police Protection: $17,321,000 ($199.49)
Central Staff Services: $12,896,000 ($148.53)
Sewerage: $8,798,000 ($101.33)
Parks and Recreation: $7,520,000 ($86.61)
Local Fire Protection: $7,493,000 ($86.30)
Water Utilities: $6,217,000 ($71.60)
Regular Highways: $4,502,000 ($51.85)
Health - Other: $3,493,000 ($40.23)
Solid Waste Management: $3,391,000 ($39.06)
Financial Administration: $2,926,000 ($33.70)
Housing and Community Development: $2,111,000 ($24.31)
Protective Inspection and Regulation - Other: $1,756,000 ($20.22)
Air Transportation: $1,629,000 ($18.76)
Judicial and Legal Services: $1,346,000 ($15.50)
Miscellaneous Commercial Activities - Other: $454,000 ($5.23)
General Public Buildings: $331,000 ($3.81)
Public Welfare - Other: $59,000 ($0.68)
- General - Interest on Debt: $4,209,000 ($48.48)
- Other Capital Outlay - General - Other: $3,813,000 ($43.92)
Solid Waste Management: $3,494,000 ($40.24)
Health - Other: $253,000 ($2.91)
Central Staff Services: $236,000 ($2.72)
Housing and Community Development: $218,000 ($2.51)
Local Fire Protection: $92,000 ($1.06)
Air Transportation: $31,000 ($0.36)
Judicial and Legal Services: $7,000 ($0.08)
Financial Administration: $2,000 ($0.02)
Water Utilities: $2,000 ($0.02)
Parks and Recreation: $1,000 ($0.01)
- Total Salaries and Wages: $75,006,000 ($863.88)
- Water Utilities - Interest on Debt: $1,656,000 ($19.07)
Ogden government finances - Revenue in 2021 (per resident):
- Charges - Other: $40,869,000 ($470.71)
Parks and Recreation: $234,000 ($2.70)
Miscellaneous Commercial Activities: $130,000 ($1.50)
Housing and Community Development: $10,000 ($0.12)
- Federal Intergovernmental - Other: $3,266,000 ($37.62)
- Local Intergovernmental - Other: $4,743,000 ($54.63)
Public Welfare: $30,000 ($0.35)
General Local Government Support: $7,000 ($0.08)
- Miscellaneous - Rents: $10,156,000 ($116.97)
Fines and Forfeits: $1,909,000 ($21.99)
General Revenue - Other: $690,000 ($7.95)
Interest Earnings: $676,000 ($7.79)
Sale of Property: $349,000 ($4.02)
- State Intergovernmental - Other: $13,544,000 ($155.99)
General Local Government Support: $168,000 ($1.93)
- Tax - Property: $24,831,000 ($285.99)
General Sales and Gross Receipts: $22,571,000 ($259.96)
Public Utilities Sales: $8,040,000 ($92.60)
Other License: $2,518,000 ($29.00)
Occupation and Business License - Other: $1,141,000 ($13.14)
Ogden government finances - Debt in 2021 (per resident):
- Long Term Debt - Outstanding Unspecified Public Purpose: $137,057,000 ($1578.54)
Beginning Outstanding - Unspecified Public Purpose: $107,777,000 ($1241.31)
Issue, Unspecified Public Purpose: $60,745,000 ($699.63)
Retired Unspecified Public Purpose: $31,465,000 ($362.40)
Ogden government finances - Cash and Securities in 2021 (per resident):
- Bond Funds - Cash and Securities: $15,310,000 ($176.33)
- Other Funds - Cash and Securities: $147,866,000 ($1703.03)
- Sinking Funds - Cash and Securities: $2,000 ($0.02)
8.58% of this county's 2021 resident taxpayers lived in other counties in 2020 ($63,347 average adjusted gross income)
| Here: | 8.58% |
| Utah average: | 7.95% |
0.06% of residents moved from foreign countries ($419 average AGI)
Weber County: 0.06% Utah average: 0.02%
Top counties from which taxpayers relocated into this county between 2020 and 2021:
| from Davis County, UT | |
| from Salt Lake County, UT | |
| from Box Elder County, UT |
7.73% of this county's 2020 resident taxpayers moved to other counties in 2021 ($55,300 average adjusted gross income)
| Here: | 7.73% |
| Utah average: | 7.39% |
0.04% of residents moved to foreign countries ($368 average AGI)
Weber County: 0.04% Utah average: 0.02%
Top counties to which taxpayers relocated from this county between 2020 and 2021:
| to Davis County, UT | |
| to Salt Lake County, UT | |
| to Box Elder County, UT |
| Businesses in Ogden, UT | ||||
| Name | Count | Name | Count | |
|---|---|---|---|---|
| 7-Eleven | 2 | Honda | 1 | |
| AT&T | 5 | Hot Topic | 1 | |
| Ace Hardware | 2 | IHOP | 1 | |
| Aeropostale | 1 | Jamba Juice | 1 | |
| American Eagle Outfitters | 1 | Jimmy John's | 2 | |
| Applebee's | 1 | Jones New York | 3 | |
| Arby's | 3 | Journeys | 1 | |
| Ascend Collection | 1 | Kroger | 3 | |
| AutoZone | 2 | LensCrafters | 1 | |
| Baskin-Robbins | 2 | Little Caesars Pizza | 3 | |
| Bath & Body Works | 1 | Lowe's | 1 | |
| Bed Bath & Beyond | 1 | Marriott | 1 | |
| Best Western | 1 | MasterBrand Cabinets | 5 | |
| Big O Tires | 2 | Mazda | 1 | |
| Blockbuster | 2 | McDonald's | 1 | |
| Budget Car Rental | 1 | Motel 6 | 3 | |
| Burger King | 4 | Motherhood Maternity | 1 | |
| Carl\s Jr. | 2 | New Balance | 1 | |
| Casual Male XL | 1 | Nike | 6 | |
| Chevrolet | 1 | OfficeMax | 1 | |
| Chick-Fil-A | 1 | Pac Sun | 1 | |
| Cinnabon | 1 | Panda Express | 1 | |
| Comfort Inn | 1 | Papa John's Pizza | 1 | |
| Comfort Suites | 1 | Payless | 1 | |
| Costco | 1 | Pizza Hut | 3 | |
| Cricket Wireless | 4 | Quiznos | 1 | |
| Dairy Queen | 1 | RadioShack | 2 | |
| Days Inn | 2 | Rite Aid | 2 | |
| Deb | 1 | Sears | 3 | |
| Dennys | 1 | Sleep Inn | 1 | |
| Discount Tire | 1 | Spencer Gifts | 1 | |
| Domino's Pizza | 2 | Sprint Nextel | 2 | |
| Eddie Bauer | 1 | Staples | 1 | |
| Express | 1 | Subaru | 1 | |
| Famous Footwear | 1 | Subway | 11 | |
| FedEx | 16 | Super 8 | 1 | |
| Firestone Complete Auto Care | 2 | T-Mobile | 6 | |
| Foot Locker | 1 | Taco Bell | 2 | |
| Ford | 1 | Toys"R"Us | 1 | |
| GNC | 2 | U-Haul | 6 | |
| GameStop | 1 | UPS | 18 | |
| Gymboree | 1 | Vans | 2 | |
| H&R Block | 5 | Victoria's Secret | 1 | |
| Hilton | 1 | Village Inn | 1 | |
| Holiday Inn | 1 | Wendy's | 3 | |
| Home Depot | 1 | Wet Seal | 1 | |
Strongest AM radio stations in Ogden:
- KYFO (1490 AM; 1 kW; OGDEN, UT; Owner: BIBLE BROADCAST NETWORK)
- KALL (700 AM; 50 kW; NORTH SALT LAKE CITY, UT; Owner: CITICASTERS LICENSES, L.P.)
- KXOL (1660 AM; 10 kW; BRIGHAM CITY, UT; Owner: SIMMONS-SLC, LS, LLC)
- KANN (1120 AM; 10 kW; ROY, UT; Owner: FAITH COMMUNICATIONS CORPORATION)
- KIQN (1010 AM; 50 kW; TOOELE, UT)
- KSL (1160 AM; 50 kW; SALT LAKE CITY, UT; Owner: BONNEVILLE HOLDING COMPANY)
- KLO (1430 AM; 10 kW; OGDEN, UT; Owner: KLO BROADCASTING CO.)
- KSOS (800 AM; 10 kW; BRIGHAM CITY, UT; Owner: SIMMONS-SLC, LS, LLC)
- KSVN (730 AM; 1 kW; OGDEN, UT; Owner: AZTECA BROADCASTING CORPORATION)
- KZNS (1280 AM; 10 kW; SALT LAKE CITY, UT; Owner: SIMMONS-SLC, LS, LLC)
- KTKK (630 AM; 10 kW; SANDY, UT; Owner: UNITED BROADCASTING COMPANY)
- KNRS (570 AM; 5 kW; SALT LAKE CITY, UT; Owner: CITICASTERS LICENSES, L.P.)
- KBEE (860 AM; 10 kW; SALT LAKE CITY, UT; Owner: CITADEL BROADCASTING COMPANY)
Strongest FM radio stations in Ogden:
- KYFO-FM (95.5 FM; OGDEN, UT; Owner: BIBLE BROADCASTING NETWORK, INC.)
- K223AK (92.5 FM; OGDEN, UT; Owner: UTAH ST.U/ OF AGRI. & APPL. SCIENCE)
- KCPX (105.7 FM; CENTERVILLE, UT; Owner: MERCURY BROADCASTING COMPANY, INC.)
- KUDD (107.9 FM; ROY, UT; Owner: MILLCREEK BROADCASTING, L.L.C.)
- KSOP-FM (104.3 FM; SALT LAKE CITY, UT; Owner: KSOP, INC.)
- K272DP (102.3 FM; TOOELE, UT; Owner: FAMILY STATIONS, INC.)
- KBZN (97.9 FM; OGDEN, UT; Owner: CAPITOL BROADCASTING, INC.)
- KRCL (90.9 FM; SALT LAKE CITY, UT; Owner: LISTENERS COMMUNITY RADIO OF UTAH)
- KBER (101.1 FM; OGDEN, UT; Owner: CITADEL BROADCASTING COMPANY)
- KISN-FM (97.1 FM; SALT LAKE CITY, UT; Owner: CLEAR CHANNEL BROADCASTING LICENSES, INC.)
- KKAT (101.9 FM; OGDEN, UT; Owner: CITICASTERS LICENSES, L.P.)
- KSFI (100.3 FM; SALT LAKE CITY, UT; Owner: SIMMONS-SLC, LS, LLC)
- KUBL-FM (93.3 FM; SALT LAKE CITY, UT; Owner: CITADEL BROADCASTING COMPANY)
- KOSY-FM (106.5 FM; SPANISH FORK, UT; Owner: MERCURY BROADCASTING COMPANY, INC.)
- KRSP-FM (103.5 FM; SALT LAKE CITY, UT; Owner: SIMMONS-SLC, LS, LLC)
- KBZN-FM1 (97.9 FM; PARK CITY, UT; Owner: CAPITOL BROADCASTING INC.)
- K201AE (88.1 FM; COALVILLE, ETC., UT; Owner: COMMUNITY WIRELESS OF PARK CITY, INC)
- KZHT-FM1 (94.9 FM; PARK CITY, UT; Owner: CITICASTERS LICENSES, L.P.)
- KCUA (92.5 FM; COALVILLE, UT; Owner: COMMUNITY WIRELESS OF PARK CITY, INC)
- KUUU (92.1 FM; TOOELE, UT; Owner: MILLCREEK BROADCASTING, L.L.C.)
TV broadcast stations around Ogden:
- KULX-CA (Channel 51; OGDEN, UT; Owner: AIRWAVES, INC.)
- KSVN-CA (Channel 49; OGDEN, UT; Owner: AZTECA BROADCASTING CORPORATION)
- K56GR (Channel 56; OGDEN, UT; Owner: TRINITY BROADCASTING NETWORK)
- K59BV (Channel 59; LAVA HOT SPRINGS, ID; Owner: STATE BOARD OF EDUCATION (IEPBS))
- K58FT (Channel 58; HUNTSVILLE, UT; Owner: ALPHA & OMEGA COMMUNICATIONS, L.L.C.)
- KUTV (Channel 2; SALT LAKE CITY, UT; Owner: KUTV HOLDINGS, INC.)
- KPNZ (Channel 24; OGDEN, UT; Owner: UTAH COMMUNICATIONS, LLC)
- K48EI (Channel 48; HUNTSVILLE, LIBERTY,, UT; Owner: WEBER CTY.-OGDEN VALLEY RECREATION)
- K46EB (Channel 46; HUNTSVILLE, ETC., UT; Owner: WEBER CTY.-OGDEN VALLEY RECREATION)
- K35GG (Channel 35; HUNTSVILLE, ETC., UT; Owner: UNIVERSITY OF UTAH)
- K50EB (Channel 50; HUNTSVILLE, ETC., UT; Owner: WEBER CTY.-OGDEN VALLEY RECREATION)
- K52CS (Channel 52; HUNTSVILLE, ETC., UT; Owner: WEBER CTY.-OGDEN VALLEY RECREATION)
Medal of Honor Recipients
Medal of Honor Recipient born in Ogden: George Edward Wahlen.
- National Bridge Inventory (NBI) Statistics
- 41Number of bridges
- 820ft / 250mTotal length
- 1,225,837Total average daily traffic
- 219,361Total average daily truck traffic
- New bridges - historical statistics
- 11910-1919
- 11920-1929
- 21930-1939
- 21950-1959
- 91960-1969
- 51970-1979
- 21980-1989
- 21990-1999
- 162000-2009
- 12020-2022
FCC Registered Antenna Towers: 297 (See the full list of FCC Registered Antenna Towers)
FCC Registered Commercial Land Mobile Towers: 2 (See the full list of FCC Registered Commercial Land Mobile Towers in Ogden, UT)
FCC Registered Private Land Mobile Towers: 8 (See the full list of FCC Registered Private Land Mobile Towers)
FCC Registered Broadcast Land Mobile Towers: 138 (See the full list of FCC Registered Broadcast Land Mobile Towers)
FCC Registered Microwave Towers: 199 (See the full list of FCC Registered Microwave Towers in this town)
FCC Registered Paging Towers: 12 (See the full list of FCC Registered Paging Towers)
FCC Registered Maritime Coast & Aviation Ground Towers: 4 (See the full list of FCC Registered Maritime Coast & Aviation Ground Towers)
FCC Registered Amateur Radio Licenses: 703 (See the full list of FCC Registered Amateur Radio Licenses in Ogden)
FAA Registered Aircraft Manufacturers and Dealers: 15 (See the full list of FAA Registered Manufacturers and Dealers in Ogden)
FAA Registered Aircraft: 125 (See the full list of FAA Registered Aircraft)
| Home Mortgage Disclosure Act Aggregated Statistics For Year 2009 (Based on 17 full and 3 partial tracts) | ||||||||||||||
| A) FHA, FSA/RHS & VA Home Purchase Loans | B) Conventional Home Purchase Loans | C) Refinancings | D) Home Improvement Loans | E) Loans on Dwellings For 5+ Families | F) Non-occupant Loans on < 5 Family Dwellings (A B C & D) | G) Loans On Manufactured Home Dwelling (A B C & D) | ||||||||
|---|---|---|---|---|---|---|---|---|---|---|---|---|---|---|
| Number | Average Value | Number | Average Value | Number | Average Value | Number | Average Value | Number | Average Value | Number | Average Value | Number | Average Value | |
| LOANS ORIGINATED | 691 | $131,614 | 220 | $132,659 | 1,893 | $138,350 | 86 | $47,521 | 5 | $1,629,604 | 110 | $92,791 | 20 | $81,672 |
| APPLICATIONS APPROVED, NOT ACCEPTED | 35 | $140,735 | 30 | $226,218 | 225 | $147,228 | 21 | $52,880 | 0 | $0 | 22 | $117,265 | 6 | $61,912 |
| APPLICATIONS DENIED | 88 | $138,946 | 52 | $126,619 | 615 | $136,471 | 56 | $41,581 | 1 | $500,000 | 75 | $110,489 | 8 | $49,788 |
| APPLICATIONS WITHDRAWN | 84 | $120,346 | 39 | $140,630 | 412 | $131,695 | 15 | $73,053 | 0 | $0 | 39 | $102,986 | 2 | $84,985 |
| FILES CLOSED FOR INCOMPLETENESS | 5 | $113,862 | 9 | $235,490 | 83 | $132,292 | 8 | $29,289 | 0 | $0 | 16 | $101,156 | 0 | $0 |
Detailed mortgage data for all 20 tracts in Ogden, UT
| Private Mortgage Insurance Companies Aggregated Statistics For Year 2009 (Based on 17 full and 3 partial tracts) | ||||||||
| A) Conventional Home Purchase Loans | B) Refinancings | C) Non-occupant Loans on < 5 Family Dwellings (A & B) | D) Loans On Manufactured Home Dwelling (A & B) | |||||
|---|---|---|---|---|---|---|---|---|
| Number | Average Value | Number | Average Value | Number | Average Value | Number | Average Value | |
| LOANS ORIGINATED | 65 | $148,181 | 95 | $150,779 | 4 | $118,838 | 0 | $0 |
| APPLICATIONS APPROVED, NOT ACCEPTED | 14 | $140,566 | 52 | $148,767 | 2 | $102,500 | 0 | $0 |
| APPLICATIONS DENIED | 17 | $132,424 | 27 | $129,130 | 0 | $0 | 0 | $0 |
| APPLICATIONS WITHDRAWN | 5 | $91,250 | 26 | $144,920 | 0 | $0 | 1 | $112,000 |
| FILES CLOSED FOR INCOMPLETENESS | 5 | $92,000 | 2 | $181,500 | 3 | $122,667 | 0 | $0 |
2002 - 2018 National Fire Incident Reporting System (NFIRS) incidents
- Fire incident types reported to NFIRS in Ogden, UT
- 1,73742.0%Outside Fires
- 1,73141.9%Structure Fires
- 51512.5%Mobile Property/Vehicle Fires
- 1513.7%Other
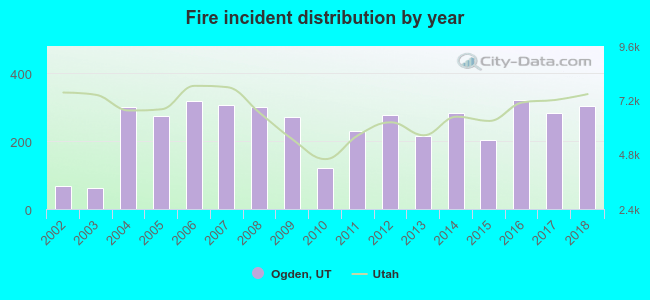 Based on the data from the years 2002 - 2018 the average number of fires per year is 243. The highest number of reported fires - 320 took place in 2016, and the least - 61 in 2003. The data has an increasing trend.
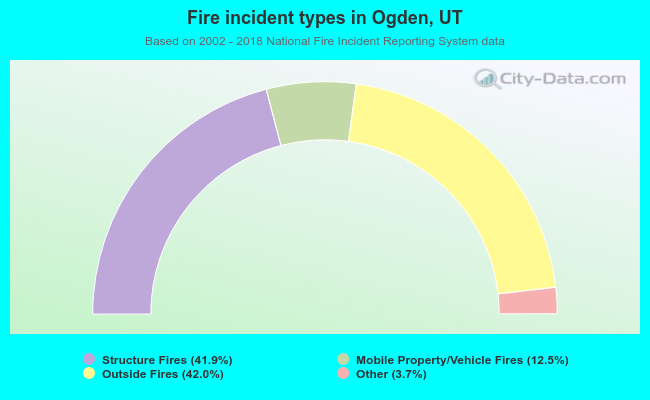 When looking into fire subcategories, the most reports belonged to: Outside Fires (42.0%), and Structure Fires (41.9%).
Fire-safe hotels and motels in Ogden, Utah:
- Motel 6, 1206 W 2100 S, Ogden, Utah 84401 , Phone: (801) 393-8644, Fax: (801) 399-0954
- Ben Lomond Suites An Ascend Collection Hotel, 2510 Washington Blvd, Ogden, Utah 84401 , Phone: (801) 627-1900, Fax: (801) 394-5342
- Courtyard by Marriott, 247 24TH St, Ogden, Utah 84401 , Phone: (801) 627-1190, Fax: (801) 395-2060
- Sleep Inn Ogden, 1155 S 1700 W, Ogden, Utah 84404 , Phone: (801) 731-6500, Fax: (801) 731-6500
- Holiday Inn Express Hotel & Suites, 2245 S 1200 W, Ogden, Utah 84401 , Phone: (801) 392-5000, Fax: (801) 392-5252
- Hampton Inn & Suites, 2401 Washington Blvd, Ogden, Utah 84401 , Phone: (801) 394-9400, Fax: (801) 394-9500
- Super 8 Ogden, 1508 W 2100 S, Ogden, Utah 84401 , Phone: (801) 731-7100, Fax: (801) 731-2627
- Value Place Ogden, 2160 S 1200 W, Ogden, Utah 84401 , Phone: (801) 334-8628
- 4 other hotels and motels
| Most common first names in Ogden, UT among deceased individuals | ||
| Name | Count | Lived (average) |
|---|---|---|
| John | 521 | 75.6 years |
| William | 500 | 76.4 years |
| Mary | 467 | 80.0 years |
| James | 368 | 72.5 years |
| Robert | 345 | 70.7 years |
| George | 344 | 77.5 years |
| Charles | 281 | 76.2 years |
| Joseph | 262 | 76.3 years |
| Ruth | 230 | 80.7 years |
| Helen | 214 | 79.8 years |
| Most common last names in Ogden, UT among deceased individuals | ||
| Last name | Count | Lived (average) |
|---|---|---|
| Smith | 259 | 74.7 years |
| Johnson | 213 | 76.5 years |
| Anderson | 211 | 76.6 years |
| Jones | 211 | 75.7 years |
| Taylor | 208 | 77.6 years |
| Jensen | 181 | 78.4 years |
| Brown | 178 | 76.2 years |
| Peterson | 154 | 78.3 years |
| Nelson | 134 | 74.8 years |
| Miller | 134 | 74.6 years |
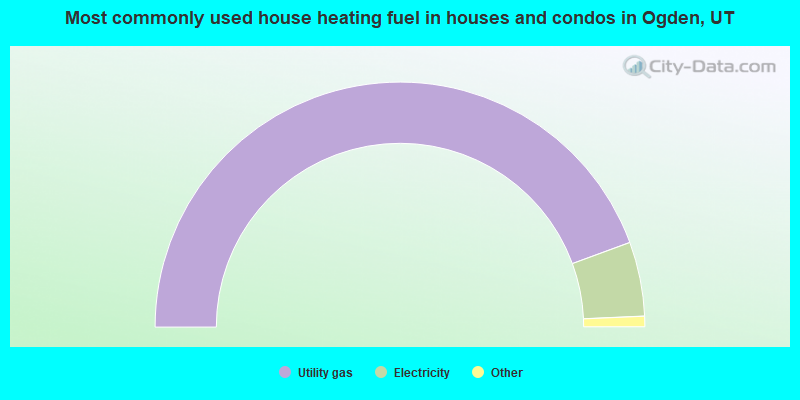
- 88.8%Utility gas
- 9.8%Electricity
- 1.0%Bottled, tank, or LP gas
- 0.2%Wood
- 0.2%Solar energy
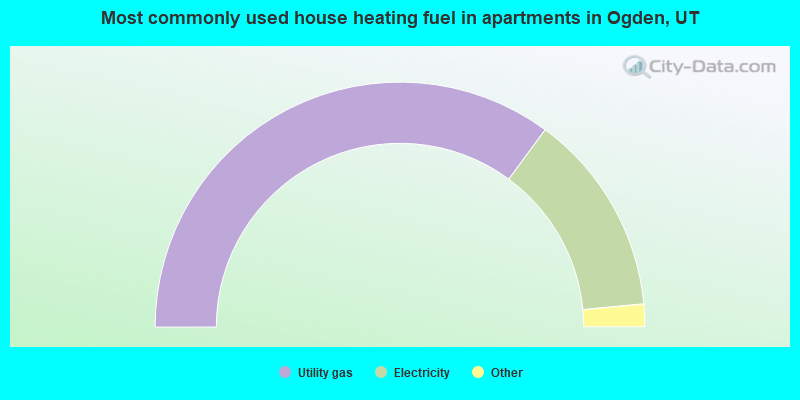
- 70.2%Utility gas
- 26.8%Electricity
- 1.4%Bottled, tank, or LP gas
- 0.8%No fuel used
- 0.6%Other fuel
- 0.1%Wood
Ogden compared to Utah state average:
- Black race population percentage above state average.
- Hispanic race population percentage above state average.
- Foreign-born population percentage above state average.
- House age above state average.
- Institutionalized population percentage above state average.
Ogden on our top lists:
- #14 on the list of "Top 101 cities with largest percentage of females in occupations: food preparation and serving related occupations (population 50,000+)"
- #14 on the list of "Top 101 cities with largest percentage of females in occupations: production occupations (population 50,000+)"
- #20 on the list of "Top 101 cities with largest percentage of females in occupations: architecture and engineering occupations (population 50,000+)"
- #23 on the list of "Top 101 cities with largest percentage of females in occupations: construction and extraction occupations (population 50,000+)"
- #25 on the list of "Top 100 high-educated but low-earning cities (pop. 50,000+)"
- #29 on the list of "Top 101 cities with largest percentage of females in industries: administrative and support and waste management services (population 50,000+)"
- #32 on the list of "Top 101 cities with largest percentage of males in industries: other services, except public administration (population 50,000+)"
- #36 on the list of "Top 101 cities with largest percentage of females in industries: manufacturing (population 50,000+)"
- #44 on the list of "Top 100 highest located cities (pop. 50,000+)"
- #45 on the list of "Top 101 cities with largest percentage of males in occupations: installation, maintenance, and repair occupations (population 50,000+)"
- #49 on the list of "Top 100 cities with the largest percentage of males (pop. 50,000+)"
- #57 on the list of "Top 101 cities with largest percentage of males in occupations: material moving occupations (population 50,000+)"
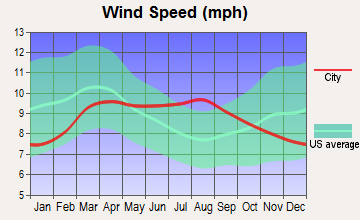
- #60 on the list of "Top 101 cities with the lowest average wind speeds (population 50,000+)"
- #60 on the list of "Top 101 cities with the lowest minimum monthly morning or afternoon humidity (population 50,000+)"
- #61 on the list of "Top 101 cities with largest percentage of females in industries: agriculture, forestry, fishing and hunting (population 50,000+)"
- #65 on the list of "Top 101 cities with largest percentage of females in industries: accommodation and food services (population 50,000+)"
- #78 on the list of "Top 101 cities with the lowest average humidity (population 50,000+)"
- #78 on the list of "Top 101 cities with the smallest percentage of elementary and middle school students in private schools (5,000+ students)"
- #82 on the list of "Top 101 cities with the most users submitting photos to our site per 10,000 residents (population 50,000+)"
- #95 on the list of "Top 101 cities with the highest number of thefts per 100,000 residents, excludes tourist destinations and others with a lot of outsiders visiting based on city industries data (population 50,000+)"
- #66 (84403) on the list of "Top 101 zip codes with the largest percentage of Danish first ancestries (pop 5,000+)"
- #8 on the list of "Top 101 counties with the lowest percentage of residents that smoked 100+ cigarettes in their lives"
- #11 on the list of "Top 101 counties with the most Other congregations"
- #13 on the list of "Top 101 counties with the highest Nitrogen Dioxide air pollution readings in 2012 (ppm)"
- #14 on the list of "Top 101 counties with the lowest percentage of residents that drank alcohol in the past 30 days"
- #15 on the list of "Top 101 counties with the highest number of births per 1000 residents 2007-2013"

|
|
Total of 324 patent applications in 2008-2024.