Estimated zip code population in 2022: 14,525 Zip code population in 2010: 13,105 Zip code population in 2000: 10,356
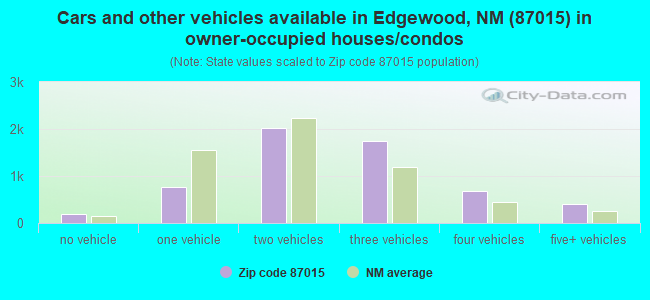
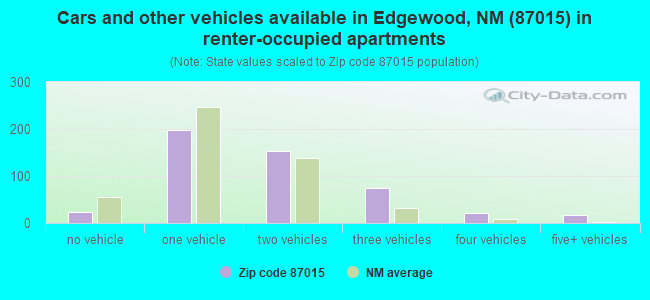
Houses and condos: 6,476 Renter-occupied apartments: 496
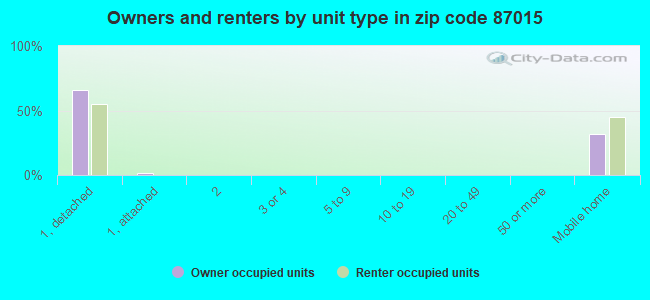
% of renters here:
8%
State:
29%
March 2022 cost of living index in zip code 87015: 88.3 (less than average, U.S. average is 100)
Land area: 150.3 sq. mi. Water area: 0.1 sq. mi.
Population density: 97 people per square mile
(very low).
OSM Map
General Map
Google Map
MSN Map
OSM Map
General Map
Google Map
MSN Map
OSM Map
General Map
Google Map
MSN Map
OSM Map
General Map
Google Map
MSN Map
Please wait while loading the map...
Real estate property taxes paid for housing units in 2022:
This zip code:
0.5% ($1,336)
New Mexico:
0.7% ($1,638)
Median real estate property taxes paid for housing units with mortgages in 2022: $1,367 (0.5%) Median real estate property taxes paid for housing units with no mortgage in 2022: $1,261 (0.5%)
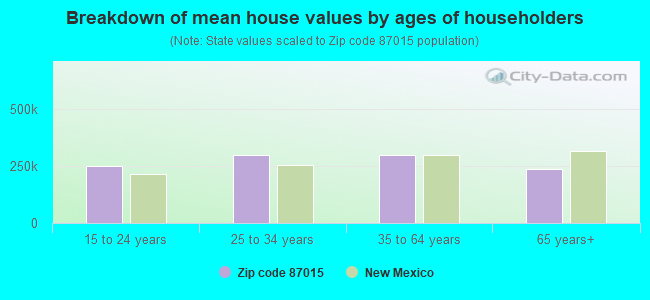
Estimated median house/condo value in 2022: $268,986
87015:
$268,986
New Mexico:
$243,100
According to our research of New Mexico and other state lists, there were 20 registered sex offenders living in 87015 zip code as of April 27, 2024. The ratio of all residents to sex offenders in zip code 87015 is 630 to 1. The ratio of registered sex offenders to all residents in this zip code is near the state average.
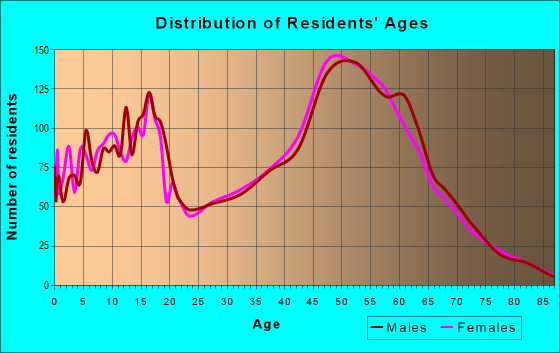
Median resident age:
This zip code:
51.0 years
New Mexico median age:
39.4 years
Average household size:
This zip code:
2.3 people
New Mexico:
2.4 people
Averages for the 2020 tax year for zip code 87015, filed in 2021:
Average Adjusted Gross Income (AGI) in 2020: $63,176 (Individual Income Tax Returns)
Here:
$63,176
State:
$59,146
Salary/wage: $57,029 (reported on 78.1% of returns)
Here:
$57,029
State:
$48,327
(% of AGI for various income ranges: 1038.5% for AGIs below $25k, 3274.0% for AGIs $25k-50k, 6550.4% for AGIs $50k-75k, 9407.9% for AGIs $75k-100k, 17192.3% for AGIs $100k-200k, 54983.3% for AGIs over 200k)
Taxable interest for individuals: $817 (reported on 34.3% of returns)
This zip code:
$817
New Mexico:
$1,616
(% of AGI for various income ranges: 17.1% for AGIs below $25k, 17.4% for AGIs $25k-50k, 41.3% for AGIs $50k-75k, 45.0% for AGIs $75k-100k, 115.1% for AGIs $100k-200k, 235.0% for AGIs over 200k)
Ordinary dividends: $3,324 (reported on 15.4% of returns)
Here:
$3,324
State:
$7,816
(% of AGI for various income ranges: 19.5% for AGIs below $25k, 25.8% for AGIs $25k-50k, 64.3% for AGIs $50k-75k, 55.8% for AGIs $75k-100k, 189.3% for AGIs $100k-200k, 1358.3% for AGIs over 200k)
Net capital gain/loss in AGI: +$9,699 (reported on 14.4% of returns)
Here:
+$9,699
State:
+$19,595
(% of AGI for various income ranges: 3.6% for AGIs below $25k, 47.1% for AGIs $25k-50k, 61.2% for AGIs $50k-75k, 125.2% for AGIs $75k-100k, 494.0% for AGIs $100k-200k, 6958.3% for AGIs over 200k)
Profit/loss from business: +$9,185 (reported on 14.3% of returns)
Here:
+$9,185
State:
+$11,430
(% of AGI for various income ranges: 106.7% for AGIs below $25k, 86.3% for AGIs $25k-50k, 182.6% for AGIs $50k-75k, 167.5% for AGIs $75k-100k, 493.5% for AGIs $100k-200k, 1391.7% for AGIs over 200k)
Taxable individual retirement arrangement distribution: $19,480 (reported on 9.1% of returns)
87015:
$19,480
New Mexico:
$20,970
(% of AGI for various income ranges: 61.2% for AGIs below $25k, 104.5% for AGIs $25k-50k, 196.8% for AGIs $50k-75k, 296.3% for AGIs $75k-100k, 700.5% for AGIs $100k-200k, 3483.3% for AGIs over 200k)
Total itemized deductions: $28,984 (reported on 6.0% of returns)
Here:
$28,984
State:
$33,187
(% of AGI for various income ranges: 125.0% for AGIs $25k-50k, 202.9% for AGIs $50k-75k, 269.4% for AGIs $75k-100k, 670.5% for AGIs $100k-200k, 4535.0% for AGIs over 200k)
Charity contributions: $9,728 (reported on 4.7% of returns)
Here:
$9,728
State:
$11,850
(% of AGI for various income ranges: 13.8% for AGIs $25k-50k, 30.4% for AGIs $50k-75k, 49.6% for AGIs $75k-100k, 188.6% for AGIs $100k-200k, 1878.3% for AGIs over 200k)
Taxes paid: $6,346 (reported on 6.0% of returns)
87015:
$6,346
State:
$7,150
(% of AGI for various income ranges: 15.9% for AGIs $25k-50k, 37.5% for AGIs $50k-75k, 53.8% for AGIs $75k-100k, 179.5% for AGIs $100k-200k, 1020.0% for AGIs over 200k)
Earned income credit: $2,059 (reported on 13.5% of returns)
Here:
$2,059
State:
$2,323
(% of AGI for various income ranges: 77.5% for AGIs below $25k, 64.7% for AGIs $25k-50k)
Percentage of individuals using paid preparers for their 2020 taxes: 91.6%
Here:
92%
State:
92%
(% for various income ranges: 91.2% for AGIs below $25k, 92.1% for AGIs $25k-50k, 91.8% for AGIs $50k-75k, 92.1% for AGIs $75k-100k, 91.1% for AGIs $100k-200k, 89.5% for AGIs over 200k)
Averages for the 2012 tax year for zip code 87015, filed in 2013:
Average Adjusted Gross Income (AGI) in 2012: $52,097 (Individual Income Tax Returns)
Here:
$52,097
State:
$50,343
Salary/wage: $46,643 (reported on 83.2% of returns)
Here:
$46,643
State:
$41,171
(% of AGI for various income ranges: 72.4% for AGIs below $25k, 73.8% for AGIs $25k-50k, 76.6% for AGIs $50k-75k, 77.6% for AGIs $75k-100k, 76.9% for AGIs $100k-200k, 54.3% for AGIs over 200k)
Taxable interest for individuals: $1,018 (reported on 33.4% of returns)
This zip code:
$1,018
New Mexico:
$1,677
(% of AGI for various income ranges: 1.3% for AGIs below $25k, 0.6% for AGIs $25k-50k, 0.7% for AGIs $50k-75k, 0.4% for AGIs $75k-100k, 0.7% for AGIs $100k-200k, 0.4% for AGIs over 200k)
Ordinary dividends: $2,349 (reported on 16.6% of returns)
Here:
$2,349
State:
$6,939
(% of AGI for various income ranges: 0.9% for AGIs below $25k, 0.7% for AGIs $25k-50k, 1.0% for AGIs $50k-75k, 0.6% for AGIs $75k-100k, 0.6% for AGIs $100k-200k, 0.9% for AGIs over 200k)
Net capital gain/loss in AGI: +$2,478 (reported on 13.3% of returns)
Here:
+$2,478
State:
+$14,311
(% of AGI for various income ranges: 0.6% for AGIs below $25k, 0.2% for AGIs $25k-50k, 0.1% for AGIs $50k-75k, 0.6% for AGIs $75k-100k, 0.9% for AGIs $100k-200k, 2.0% for AGIs over 200k)
Profit/loss from business: +$9,456 (reported on 16.6% of returns)
Here:
+$9,456
State:
+$11,059
(% of AGI for various income ranges: 6.5% for AGIs below $25k, 4.4% for AGIs $25k-50k, 2.2% for AGIs $50k-75k, 2.7% for AGIs $75k-100k, 2.8% for AGIs $100k-200k)
Taxable individual retirement arrangement distribution: $14,750 (reported on 9.4% of returns)
87015:
$14,750
New Mexico:
$15,706
(% of AGI for various income ranges: 2.7% for AGIs below $25k, 2.4% for AGIs $25k-50k, 1.9% for AGIs $50k-75k, 2.6% for AGIs $75k-100k, 3.8% for AGIs $100k-200k)
Total itemized deductions: $18,962 (22% of AGI, reported on 33.6% of returns)
Here:
$18,962
State:
$21,709
Here:
21.6% of AGI
State:
19.8% of AGI
(% of AGI for various income ranges: 9.7% for AGIs below $25k, 10.7% for AGIs $25k-50k, 12.8% for AGIs $50k-75k, 12.9% for AGIs $75k-100k, 13.3% for AGIs $100k-200k, 10.4% for AGIs over 200k)
Charity contributions: $3,514 (reported on 25.9% of returns)
Here:
$3,514
State:
$4,195
(% of AGI for various income ranges: 0.6% for AGIs below $25k, 1.3% for AGIs $25k-50k, 1.6% for AGIs $50k-75k, 2.0% for AGIs $75k-100k, 2.3% for AGIs $100k-200k, 1.6% for AGIs over 200k)
Taxes paid: $4,566 (reported on 33.4% of returns)
87015:
$4,566
State:
$6,176
(% of AGI for various income ranges: 1.2% for AGIs below $25k, 1.6% for AGIs $25k-50k, 2.4% for AGIs $50k-75k, 2.9% for AGIs $75k-100k, 4.0% for AGIs $100k-200k, 4.4% for AGIs over 200k)
Earned income credit: $1,950 (reported on 18.4% of returns)
Here:
$1,950
State:
$2,311
(% of AGI for various income ranges: 6.0% for AGIs below $25k, 1.2% for AGIs $25k-50k)
Percentage of individuals using paid preparers for their 2012 taxes: 41.1%
Here:
41%
State:
50%
(% for various income ranges: 38.5% for AGIs below $25k, 40.6% for AGIs $25k-50k, 41.4% for AGIs $50k-75k, 45.2% for AGIs $75k-100k, 43.2% for AGIs $100k-200k, 62.5% for AGIs over 200k)
Averages for the 2004 tax year for zip code 87015, filed in 2005:
Average Adjusted Gross Income (AGI) in 2004: $44,302 (Individual Income Tax Returns)
Here:
$44,302
State:
$39,572
Salary/wage: $42,734 (reported on 86.5% of returns)
Here:
$42,734
State:
$34,237
(% of AGI for various income ranges: 138.3% for AGIs below $10k, 75.5% for AGIs $10k-25k, 84.2% for AGIs $25k-50k, 83.7% for AGIs $50k-75k, 85.0% for AGIs $75k-100k, 81.4% for AGIs over 100k)
Taxable interest for individuals: $1,156 (reported on 39.3% of returns)
This zip code:
$1,156
New Mexico:
$1,873
(% of AGI for various income ranges: 5.0% for AGIs below $10k, 2.2% for AGIs $10k-25k, 0.9% for AGIs $25k-50k, 1.2% for AGIs $50k-75k, 0.6% for AGIs $75k-100k, 0.7% for AGIs over 100k)
Taxable dividends: $1,332 (reported on 18.4% of returns)
Here:
$1,332
State:
$3,554
(% of AGI for various income ranges: 3.6% for AGIs below $10k, 0.8% for AGIs $10k-25k, 0.5% for AGIs $25k-50k, 0.6% for AGIs $50k-75k, 0.4% for AGIs $75k-100k, 0.5% for AGIs over 100k)
Net capital gain/loss: +$4,193 (reported on 15.5% of returns)
Here:
+$4,193
State:
+$10,425
(% of AGI for various income ranges: -1.4% for AGIs below $10k, 0.3% for AGIs $10k-25k, 0.6% for AGIs $25k-50k, 0.7% for AGIs $50k-75k, 0.9% for AGIs $75k-100k, 3.6% for AGIs over 100k)
Profit/loss from business: +$7,004 (reported on 18.5% of returns)
Here:
+$7,004
State:
+$8,875
(% of AGI for various income ranges: 8.3% for AGIs below $10k, 6.2% for AGIs $10k-25k, 2.5% for AGIs $25k-50k, 2.8% for AGIs $50k-75k, 2.6% for AGIs $75k-100k, 2.4% for AGIs over 100k)
IRA payment deduction: $2,578 (reported on 2.8% of returns)
87015:
$2,578
New Mexico:
$2,940
(% of AGI for various income ranges: 0.3% for AGIs $10k-25k, 0.2% for AGIs $25k-50k, 0.2% for AGIs $50k-75k, 0.1% for AGIs $75k-100k, 0.1% for AGIs over 100k)
Self-employed pension: $9,042 (reported on 0.5% of returns)
Here:
$9,042
New Mexico:
$13,110
Total itemized deductions: $16,234 (22% of AGI, reported on 40.0% of returns)
Here:
$16,234
State:
$18,103
Here:
22.4% of AGI
State:
21.5% of AGI
(% of AGI for various income ranges: 17.9% for AGIs below $10k, 10.6% for AGIs $10k-25k, 13.2% for AGIs $25k-50k, 16.0% for AGIs $50k-75k, 15.8% for AGIs $75k-100k, 14.8% for AGIs over 100k)
Charity contributions deductions: $2,698 (4% of AGI, reported on 32.9% of returns)
Here:
$2,698
State:
$3,246
Here:
3.5% of AGI
State:
3.6% of AGI
(% of AGI for various income ranges: 0.9% for AGIs below $10k, 1.1% for AGIs $10k-25k, 1.5% for AGIs $25k-50k, 2.1% for AGIs $50k-75k, 2.3% for AGIs $75k-100k, 2.4% for AGIs over 100k)
Total tax: $5,716 (reported on 76.0% of returns)
87015:
$5,716
State:
$6,237
(% of AGI for various income ranges: 4.9% for AGIs below $10k, 4.0% for AGIs $10k-25k, 6.3% for AGIs $25k-50k, 8.4% for AGIs $50k-75k, 10.2% for AGIs $75k-100k, 15.4% for AGIs over 100k)
Earned income credit: $1,607 (reported on 15.5% of returns)
Here:
$1,607
State:
$1,796
Percentage of individuals using paid preparers for their 2004 taxes: 45.4%
Here:
45%
State:
57%
(% for various income ranges: 41.0% for AGIs below $10k, 48.0% for AGIs $10k-25k, 45.8% for AGIs $25k-50k, 46.7% for AGIs $50k-75k, 44.9% for AGIs $75k-100k, 45.3% for AGIs over 100k)
Likely homosexual households (counted as self-reported same-sex unmarried-partner households)
Lesbian couples: 0.1% of all households
Gay men: 0.3% of all households
Household received Food Stamps/SNAP in the past 12 months: 572 Household did not receive Food Stamps/SNAP in the past 12 months: 5,552
Women who had a birth in the past 12 months: 82 (58 now married, 25 unmarried) Women who did not have a birth in the past 12 months: 2,778 (1,436 now married, 1,321 unmarried)
Housing units in zip code 87015 with a mortgage: 3,427 (206 second mortgage, 124 both second mortgage and home equity loan) Median monthly owner costs for units with a mortgage: $1,413 Median monthly owner costs for units without a mortgage: $465
Residents with income below the poverty level in 2022:
This zip code:
8.9%
Whole state:
17.6%
Residents with income below 50% of the poverty level in 2022:
This zip code:
6.1%
Whole state:
9.7%
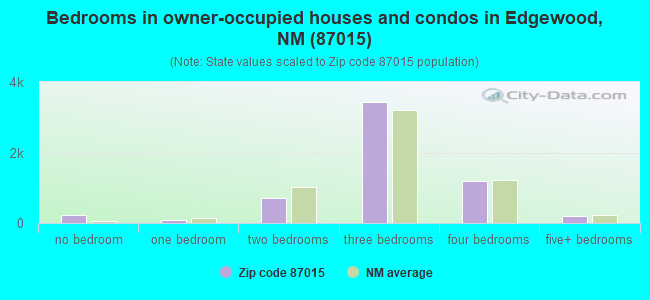
Median number of rooms in houses and condos:
Here:
5.9
State:
5.9
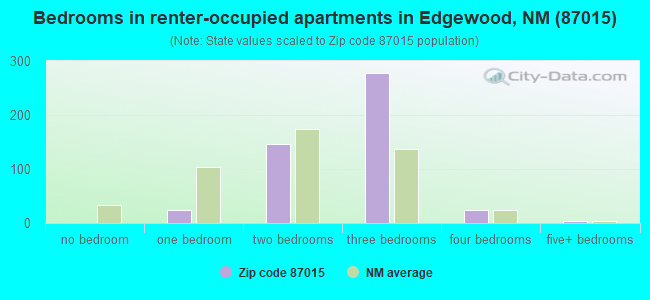
Median number of rooms in apartments:
Here:
4.8
State:
4.2
Notable locations in this zip code not listed on our city pages
Notable locations in zip code 87015: Lyod Ranch (A), Old Nieto Well (B), Silvia Ranch (C), Wl Williams Ranch (D), Lacy Place (E), Mosley Place (F), Ballinger Ranch (G), Bassett Ranch (H), Bella Vista Ranch (I), Butler Ranch (J), Davis Ranch (K), H S Williams Ranch (L), Hale Ranch (M), Hill Ranch (N), YMCA Camp (O), Irby Ranch (P), Santa Fe County Volunteer Fire Edgewood District Station 4 (Q), Santa Fe County Volunteer Fire Edgewood District Station 1 (R), Santa Fe County Volunteer Fire Mountain Hills Station (S), Santa Fe County Volunteer Fire Edgewood District Station 2 (T). Display/hide their locations on the map
Churches in zip code 87015 include: Valley View Christian Church (A), East Mountain Assembly of God Church (B), Christ Unity at the Edge of the Woods (C), Edgewood Believers Fellowship Church (D), Grace Baptist Church (E). Display/hide their locations on the map
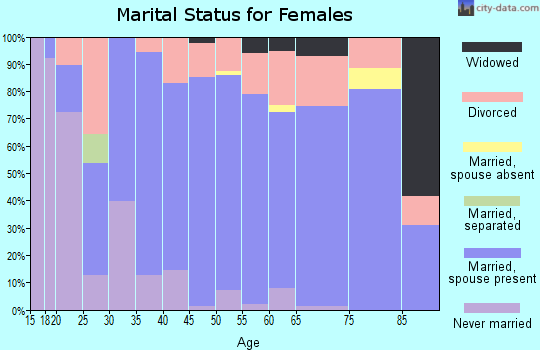
2,160 married couples with children.
290 single-parent households (89 men, 201 women).
85.0% of residents of 87015 zip code speak English at home.
16.9% of residents speak Spanish at home (64% very well, 21% well, 12% not well, 2% not at all).
0.1% of residents speak other Indo-European language at home (100% very well).
0.2% of residents speak Asian or Pacific Island language at home (100% very well).
0.2% of residents speak other language at home (21% very well, 79% not well).
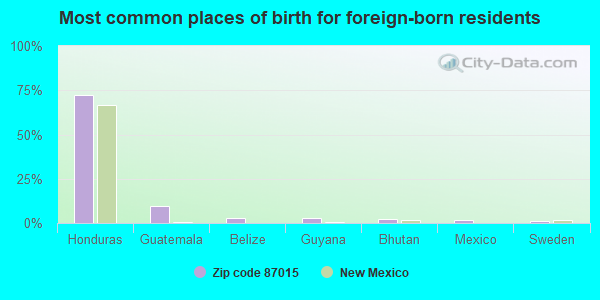
Foreign born population: 709 (4.9%) (36.9% of them are naturalized citizens)
This zip code:
4.9%
Whole state:
9.3%
72%Honduras
9%Guatemala
3%Belize
3%Guyana
2%Bhutan
2%Mexico
1%Sweden
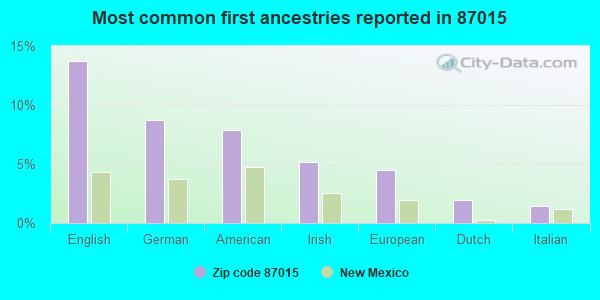
14%English
9%German
8%American
5%Irish
4%European
2%Dutch
1%Italian
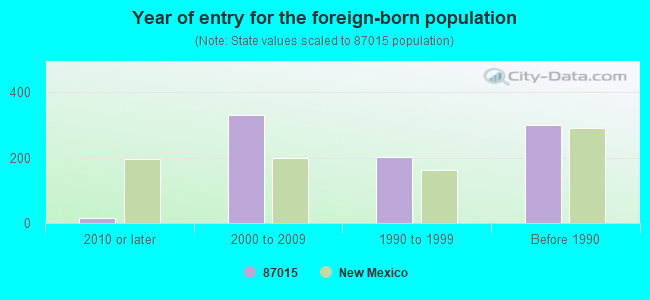
Year of entry for the foreign-born population
152010 or later
3312000 to 2009
2031990 to 1999
299Before 1990
Facilities with environmental interests located in this zip code:
EDGEWOOD ELEMENTARY (HIGHWAY 66 in EDGEWOOD, NM)
(National Center for Education Statistics) - STATE ID-81571110 Organizations: MORIARTY MUNICIPAL SCHOOLS (SCHOOL DISTRICT)
EDGEWOOD MIDDLE (282 DINKLE RD. in EDGEWOOD, NM)
(National Center for Education Statistics) - STATE ID-81571003 Organizations: MORIARTY MUNICIPAL SCHOOLS (SCHOOL DISTRICT)
ROUTE 66 ELEMENTARY SCHOOL (805 BARTON ROAD in EDGEWOOD, NM)
(National Center for Education Statistics) - STATE ID-81571001 Organizations: MORIARTY MUNICIPAL SCHOOLS (SCHOOL DISTRICT)
CEDAR GROVE M.D.W.C.A. (PO BOX 1200 in EDGEWOOD, NM)
(Integrated Compliance Information System) - ICIS-06-2001-5150, FORMAL ENFORCEMENT ACTION Business SIC classification: WATER SUPPLY
EDGEWOOD PLAZA SUBDIVISION (HIGHWAY 333 & GEORGE CRT., in EDGEWOOD, NM)
National Pollutant Discharge Elimination System NON-MAJOR (Tracking pollutant discharge elimination systems) - permit National Pollutant Discharge Elimination System NON-MAJOR (Tracking pollutant discharge elimination systems) - permit Business SIC classification: GENERAL CONTRACTORS-NONRESIDENTIAL BUILDINGS, OTHER THAN INDUSTRIAL BUILDINGS AND WAREHOUSES Alternative names: EXPRESS DEVELOPMENTS LTD CO., UNIVERSAL CONSTRUCTORS, INC.
EDGEWOOD PUMP STATION (3 MI N EDGEWOOD in EDGEWOOD, NM)
AIR SYNTHETIC MINOR (AIRS/AFS) CRITERIA AND HAZARDOUS AIR POLLUTANT INVENTORY (Inventory of air pollution sources) Small Quantity Generators, between 100 kg and 1000 kg of hazardous waste/month (Resource Conservation and Recovery Act (tracking hazardous waste)) - notification Business SIC classification: NATURAL GAS TRANSMISSION Business NAICS classification: ALL OTHER PIPELINE TRANSPORTATION. Organizations: MAPCO (CONTACT/OWNER)
Alternative names: EDGEWOOD STATION, MID-AMERICA PIPELINE EDGEWOOD CS
CEDAR GROVE SCHOOL (P.O. BOX 655 in EDGEWOOD, NM)
COMPLIANCE ACTIVITY (Tracking inspections of insecticide, fungicide, and rodenticide, and toxic substances)
EDGEWOOD PLAZA SUBDIVSION (STATE HIGHWAY 333 @ GEORGE,MARIETTA & EUNICE CRT. in EDGEWOOD, NM)
ENFORCEMENT/COMPLIANCE ACTIVITY (Integrated Compliance Information System)
JW JONES CONSTRUCTION - 300TPH DM732 ASPHALT PLANT NO0196 (PORTABLE SOURCE in PORTABLE SOURCE, NM)
AIR SYNTHETIC MINOR (AIRS/AFS) Business SIC classification: ASPHALT PAVING MIXTURES AND BLOCKS Alternative names: J.W.JONES CONST 300TPH ASPHALT PLNT, J.W. JONES CONSTRUCTION CO., J W JONES CONSTRUCTION J W JONES CONSTRU, JW JONES CONSTRUCTION JW JONES CONSTRUCT
Housing units lacking complete plumbing facilities: 0.9% Housing units lacking complete kitchen facilities: 1.2%
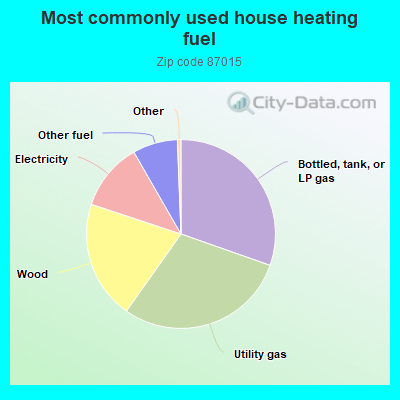
30.4%Bottled, tank, or LP gas
29.4%Utility gas
20.3%Wood
11.6%Electricity
7.7%Other fuel
Population in 1990: 3,032. Population change in the 1990s: +7,324 (+241.6%).
Place of birth for U.S.-born residents:
This state: 5,879
Northeast: 1,181
Midwest: 1,592
South: 2,008
West: 3,057
56% of the 87015 zip code residents lived in the same house 5 years ago. Out of people who lived in different houses, 16% lived in this county. Out of people who lived in different counties, 50% lived in New Mexico.
92% of the 87015 zip code residents lived in the same house 1 year ago. Out of people who lived in different houses, 6% moved from this county. Out of people who lived in different houses, 60% moved from different county within same state. Out of people who lived in different houses, 36% moved from different state. Out of people who lived in different houses, 1% moved from abroad.
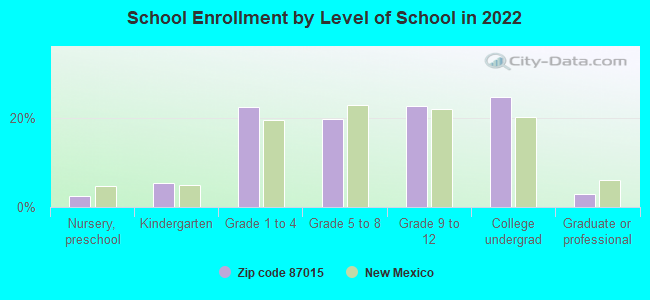
Private vs. public school enrollment:
Students in private schools in grades 1 to 8 (elementary and middle school): 233
Here:
20.2%
New Mexico:
10.2%
Students in private schools in grades 9 to 12 (high school): 155
Here:
24.8%
New Mexico:
10.0%
Students in private undergraduate colleges: 126
Here:
19.0%
New Mexico:
12.3%
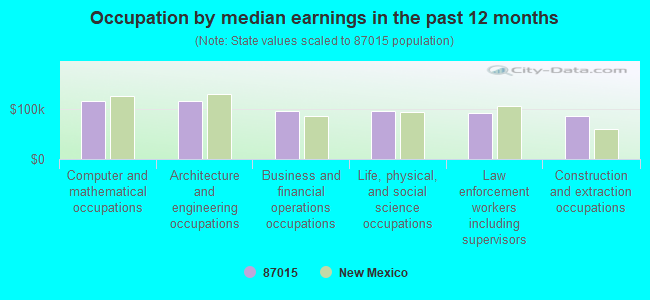
Occupation by median earnings in the past 12 months ($)
117,421Computer and mathematical occupations
117,155Architecture and engineering occupations
97,816Business and financial operations occupations
97,152Life, physical, and social science occupations
92,640Law enforcement workers including supervisors
86,347Construction and extraction occupations
Companies with federal contracts located in this zip code:
ALBUQUERQUE LOGISTICS INC (2 NEWKIRK CT in EDGEWOOD, NM; small business) : $321,778 in 6 contractsfrom 2000 to 2002
Contracts for Weapons -- Engineering Development (R&D) by Air Force Signed by year:2000: $47,135; 2001: $182,763; 2002: $91,880; 2003: $0; 2004: $0; 2005: $0; 2006: $0.
Biggest contracts:
$133,000 with Air Force for Weapons -- Engineering Development (R&D). Signed on 2001-09-24. Completion date: 2002-02-24.
$84,795, same as above.Signed on 2002-05-28. Completion date: 2003-02-24.
$50,000, same as above.Signed on 2002-02-28. Completion date: 2003-02-24.
$49,763, same as above.Signed on 2001-02-23. Completion date: 2002-02-24.
ENGINEERED COLLECTIVES INC (18 BESTVIEW TRL in EDGEWOOD, NM; small business)
$99,999 with Navy for Other Defense -- Basic Research (R&D). Signed on 2002-06-07. Completion date: 2002-12-31.
FALCON INDUSTRIES INC (1819 OLD RT 66 in EDGEWOOD, NM; small business) 50 employees, $0 revenue: $14,503 in 2 contractsin 2005
$7,302 with Navy for Guns, through 30 mm. Signed on 2005-09-07. Completion date: 2005-10-01.
$7,201, same as above.Signed on 2005-06-20. Completion date: 2005-06-30.
Top industries in this zip code by the number of employees in 2005:
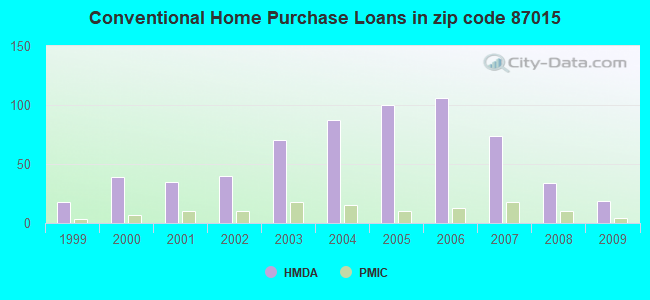
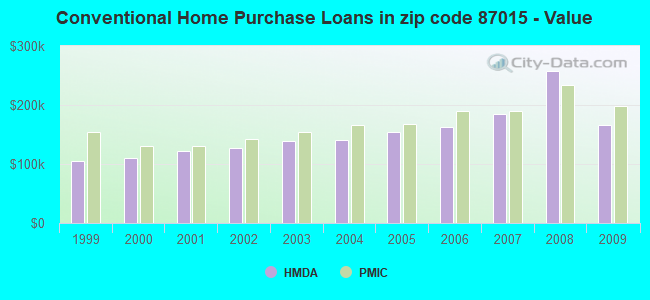
Detailed PMIC statistics for the following Tracts:0038.04
, 0103.06
2005 - 2018 National Fire Incident Reporting System (NFIRS) incidents
Based on the data from the years 2005 - 2018 the average number of fires per year is 50. The highest number of fires - 73 took place in 2009, and the least - 27 in 2015. The data has a growing trend.
When looking into fire subcategories, the most incidents belonged to: Structure Fires (40.7%), and Outside Fires (38.8%).
Fire incident types reported to NFIRS in Zip Code 87015


 Nearest zip codes: 87059, 87047, 87008, 87035, 87032, 87123.
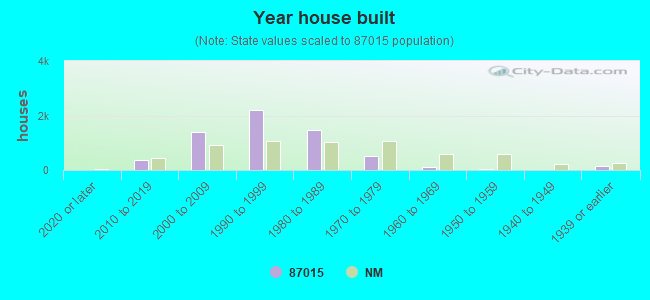


 Based on the data from the years 2005 - 2018 the average number of fires per year is 50. The highest number of fires - 73 took place in 2009, and the least - 27 in 2015. The data has a growing trend.
 When looking into fire subcategories, the most incidents belonged to: Structure Fires (40.7%), and Outside Fires (38.8%).