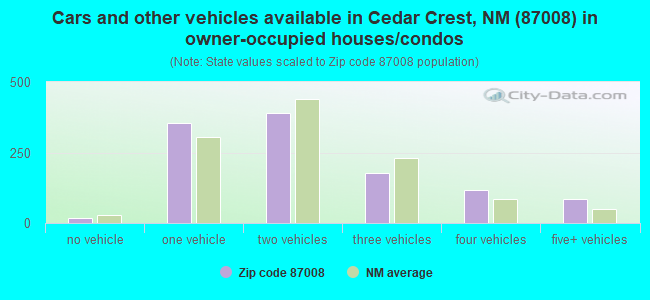
Estimated zip code population in 2022: 2,419 Zip code population in 2010: 2,552 Zip code population in 2000: 3,132
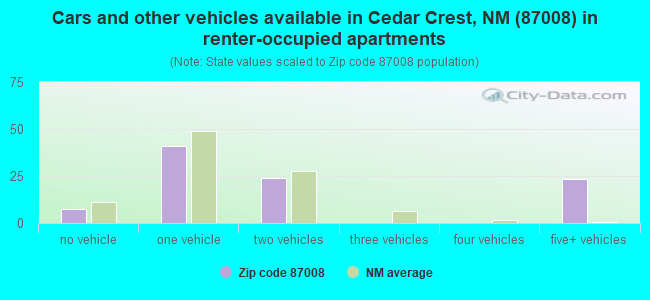
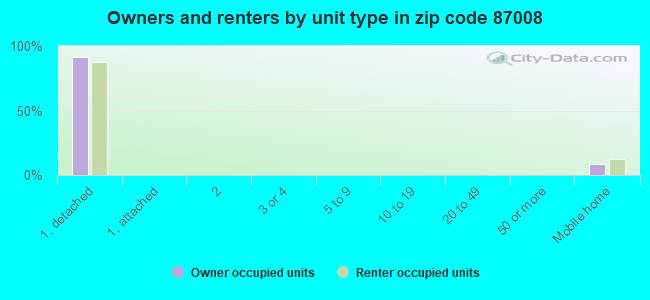
Houses and condos: 1,351 Renter-occupied apartments: 95
% of renters here:
8%
State:
29%
March 2022 cost of living index in zip code 87008: 86.3 (less than average, U.S. average is 100)
Land area: 28.3 sq. mi. Water area: 0.0 sq. mi.
Population density: 85 people per square mile
(very low).
OSM Map
General Map
Google Map
MSN Map
OSM Map
General Map
Google Map
MSN Map
OSM Map
General Map
Google Map
MSN Map
OSM Map
General Map
Google Map
MSN Map
Please wait while loading the map...
Real estate property taxes paid for housing units in 2022:
This zip code:
0.7% ($2,541)
New Mexico:
0.7% ($1,638)
Median real estate property taxes paid for housing units with mortgages in 2022: $2,602 (0.7%) Median real estate property taxes paid for housing units with no mortgage in 2022: $2,335 (0.6%)
Business Search- 14 Million verified businesses
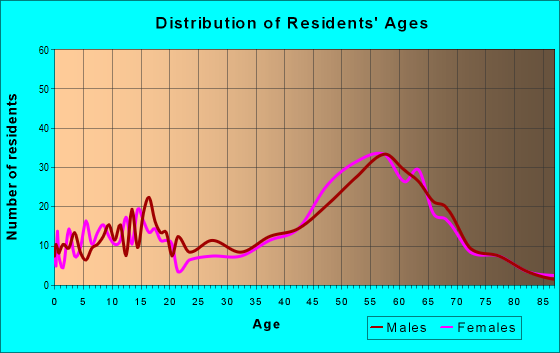
Males: 1,052
(43.5%)
Females: 1,367
(56.5%)
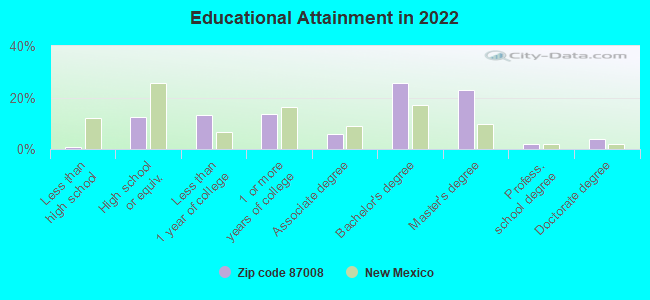
For population 25 years and over in 87008:
High school or higher: 101.4%
Bachelor's degree or higher: 55.3%
Graduate or professional degree: 29.1%
Unemployed: 4.0%
Mean travel time to work (commute): 29.7 minutes
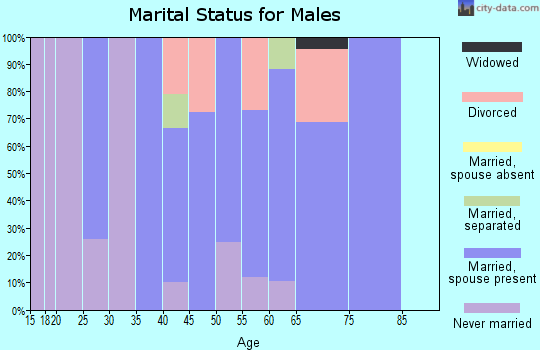
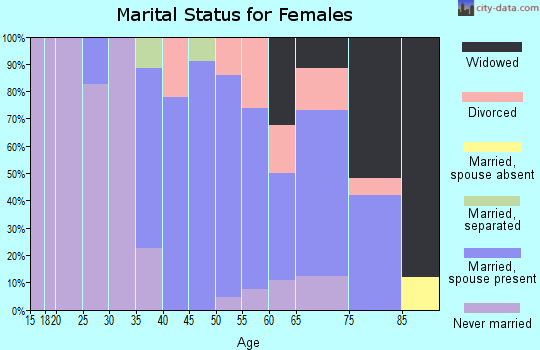
For population 15 years and over in 87008:
Never married: 20.5%
Now married: 60.4%
Separated: 3.3%
Widowed: 6.6%
Divorced: 9.3%
Zip code 87008 compared to state average:
Median household income above state average.
Median house value above state average.
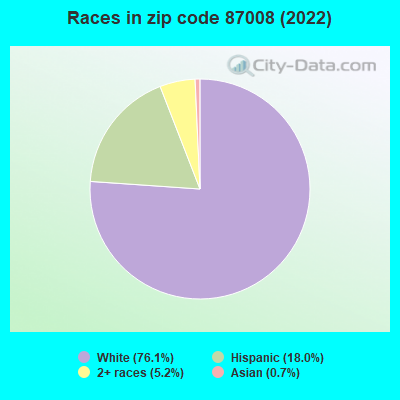
Black race population percentage significantly below state average.
Hispanic race population percentage below state average.
Median age significantly above state average.
Foreign-born population percentage significantly below state average.
Renting percentage significantly below state average.
Percentage of population with a bachelor's degree or higher above state average.
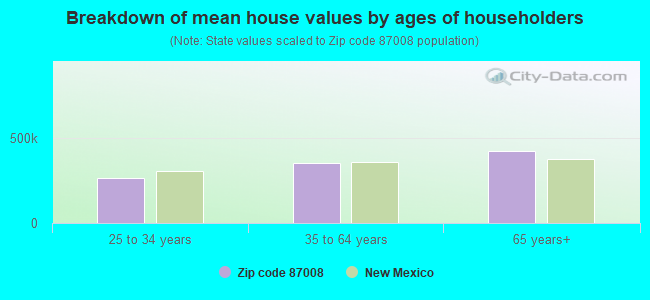
Estimated median house/condo value in 2022: $374,216
87008:
$374,216
New Mexico:
$243,100
According to our research of New Mexico and other state lists, there were 2 registered sex offenders living in 87008 zip code as of April 27, 2024. The ratio of all residents to sex offenders in zip code 87008 is 1,466 to 1. The ratio of registered sex offenders to all residents in this zip code is lower than the state average.
Median resident age:
This zip code:
54.4 years
New Mexico median age:
39.4 years
Average household size:
This zip code:
2.0 people
New Mexico:
2.4 people
Averages for the 2020 tax year for zip code 87008, filed in 2021:
Average Adjusted Gross Income (AGI) in 2020: $94,388 (Individual Income Tax Returns)
Here:
$94,388
State:
$59,146
Salary/wage: $74,163 (reported on 71.7% of returns)
Here:
$74,163
State:
$48,327
(% of AGI for various income ranges: 1030.0% for AGIs below $25k, 2993.1% for AGIs $25k-50k, 6273.3% for AGIs $50k-75k, 8455.0% for AGIs $75k-100k, 16007.2% for AGIs $100k-200k, 48540.0% for AGIs over 200k)
Taxable interest for individuals: $1,456 (reported on 50.4% of returns)
This zip code:
$1,456
New Mexico:
$1,616
(% of AGI for various income ranges: 48.5% for AGIs below $25k, 68.8% for AGIs $25k-50k, 70.0% for AGIs $50k-75k, 47.5% for AGIs $75k-100k, 175.0% for AGIs $100k-200k, 772.5% for AGIs over 200k)
Ordinary dividends: $8,773 (reported on 32.3% of returns)
Here:
$8,773
State:
$7,816
(% of AGI for various income ranges: 46.0% for AGIs below $25k, 110.0% for AGIs $25k-50k, 151.1% for AGIs $50k-75k, 445.0% for AGIs $75k-100k, 369.4% for AGIs $100k-200k, 5430.0% for AGIs over 200k)
Net capital gain/loss in AGI: +$26,926 (reported on 29.9% of returns)
Here:
+$26,926
State:
+$19,595
(% of AGI for various income ranges: 14.5% for AGIs below $25k, 108.7% for AGIs $25k-50k, 347.8% for AGIs $50k-75k, 370.0% for AGIs $75k-100k, 917.8% for AGIs $100k-200k, 19420.0% for AGIs over 200k)
Profit/loss from business: +$18,638 (reported on 20.5% of returns)
Here:
+$18,638
State:
+$11,430
(% of AGI for various income ranges: 204.0% for AGIs below $25k, 116.3% for AGIs $25k-50k, 475.6% for AGIs $50k-75k, 343.8% for AGIs $75k-100k, 885.6% for AGIs $100k-200k, 4887.5% for AGIs over 200k)
Taxable individual retirement arrangement distribution: $25,100 (reported on 15.7% of returns)
87008:
$25,100
New Mexico:
$20,970
(% of AGI for various income ranges: 103.0% for AGIs below $25k, 268.1% for AGIs $25k-50k, 477.8% for AGIs $50k-75k, 496.3% for AGIs $75k-100k, 1060.0% for AGIs $100k-200k, 4125.0% for AGIs over 200k)
Total itemized deductions: $33,433 (reported on 11.8% of returns)
Here:
$33,433
State:
$33,187
(% of AGI for various income ranges: 1027.8% for AGIs $50k-75k, 1095.6% for AGIs $100k-200k, 5295.0% for AGIs over 200k)
Charity contributions: $11,125 (reported on 9.4% of returns)
Here:
$11,125
State:
$11,850
(% of AGI for various income ranges: 142.2% for AGIs $50k-75k, 247.8% for AGIs $100k-200k, 1902.5% for AGIs over 200k)
Taxes paid: $7,620 (reported on 11.8% of returns)
87008:
$7,620
State:
$7,150
(% of AGI for various income ranges: 207.8% for AGIs $50k-75k, 277.2% for AGIs $100k-200k, 1142.5% for AGIs over 200k)
Earned income credit: $1,740 (reported on 7.9% of returns)
Here:
$1,740
State:
$2,323
(% of AGI for various income ranges: 57.5% for AGIs below $25k, 36.9% for AGIs $25k-50k)
Percentage of individuals using paid preparers for their 2020 taxes: 91.3%
Here:
91%
State:
92%
(% for various income ranges: 90.6% for AGIs below $25k, 90.5% for AGIs $25k-50k, 87.5% for AGIs $50k-75k, 92.3% for AGIs $75k-100k, 93.8% for AGIs $100k-200k, 92.3% for AGIs over 200k)
Averages for the 2012 tax year for zip code 87008, filed in 2013:
Average Adjusted Gross Income (AGI) in 2012: $77,889 (Individual Income Tax Returns)
Here:
$77,889
State:
$50,343
Salary/wage: $63,125 (reported on 77.7% of returns)
Here:
$63,125
State:
$41,171
(% of AGI for various income ranges: 60.9% for AGIs below $25k, 67.7% for AGIs $25k-50k, 67.4% for AGIs $50k-75k, 67.7% for AGIs $75k-100k, 71.6% for AGIs $100k-200k, 45.8% for AGIs over 200k)
Taxable interest for individuals: $1,342 (reported on 49.2% of returns)
This zip code:
$1,342
New Mexico:
$1,677
(% of AGI for various income ranges: 1.7% for AGIs below $25k, 0.7% for AGIs $25k-50k, 0.8% for AGIs $50k-75k, 0.7% for AGIs $75k-100k, 0.7% for AGIs $100k-200k, 1.0% for AGIs over 200k)
Ordinary dividends: $5,833 (reported on 32.3% of returns)
Here:
$5,833
State:
$6,939
(% of AGI for various income ranges: 3.2% for AGIs below $25k, 1.7% for AGIs $25k-50k, 1.4% for AGIs $50k-75k, 2.0% for AGIs $75k-100k, 1.0% for AGIs $100k-200k, 5.0% for AGIs over 200k)
Net capital gain/loss in AGI: +$9,317 (reported on 27.7% of returns)
Here:
+$9,317
State:
+$14,311
(% of AGI for various income ranges: 0.7% for AGIs $25k-50k, 0.2% for AGIs $50k-75k, 1.6% for AGIs $75k-100k, 1.3% for AGIs $100k-200k, 9.8% for AGIs over 200k)
Profit/loss from business: +$16,297 (reported on 23.1% of returns)
Here:
+$16,297
State:
+$11,059
(% of AGI for various income ranges: 11.1% for AGIs below $25k, 3.6% for AGIs $25k-50k, 2.7% for AGIs $50k-75k, 3.8% for AGIs $75k-100k, 4.3% for AGIs $100k-200k, 6.4% for AGIs over 200k)
Taxable individual retirement arrangement distribution: $23,042 (reported on 14.6% of returns)
87008:
$23,042
New Mexico:
$15,706
(% of AGI for various income ranges: 3.8% for AGIs below $25k, 3.7% for AGIs $25k-50k, 3.6% for AGIs $50k-75k, 5.5% for AGIs $75k-100k, 7.5% for AGIs $100k-200k)
Self-employment retirement plans: $26,350 (reported on 1.5% of returns)
87008:
$26,350
New Mexico:
$18,209
Total itemized deductions: $23,261 (19% of AGI, reported on 46.9% of returns)
Here:
$23,261
State:
$21,709
Here:
19.2% of AGI
State:
19.8% of AGI
(% of AGI for various income ranges: 24.7% for AGIs below $25k, 14.7% for AGIs $25k-50k, 14.3% for AGIs $50k-75k, 13.8% for AGIs $75k-100k, 13.1% for AGIs $100k-200k, 13.3% for AGIs over 200k)
Charity contributions: $4,331 (reported on 39.2% of returns)
Here:
$4,331
State:
$4,195
(% of AGI for various income ranges: 1.4% for AGIs below $25k, 1.8% for AGIs $25k-50k, 1.7% for AGIs $50k-75k, 1.8% for AGIs $75k-100k, 2.0% for AGIs $100k-200k, 3.1% for AGIs over 200k)
Taxes paid: $7,188 (reported on 46.2% of returns)
87008:
$7,188
State:
$6,176
(% of AGI for various income ranges: 3.0% for AGIs below $25k, 2.6% for AGIs $25k-50k, 3.3% for AGIs $50k-75k, 4.1% for AGIs $75k-100k, 4.7% for AGIs $100k-200k, 4.9% for AGIs over 200k)
Earned income credit: $1,382 (reported on 8.5% of returns)
Here:
$1,382
State:
$2,311
(% of AGI for various income ranges: 2.6% for AGIs below $25k, 0.5% for AGIs $25k-50k)
Percentage of individuals using paid preparers for their 2012 taxes: 46.2%
Here:
46%
State:
50%
(% for various income ranges: 37.8% for AGIs below $25k, 45.5% for AGIs $25k-50k, 50.0% for AGIs $50k-75k, 56.2% for AGIs $75k-100k, 44.4% for AGIs $100k-200k, 62.5% for AGIs over 200k)
Averages for the 2004 tax year for zip code 87008, filed in 2005:
Average Adjusted Gross Income (AGI) in 2004: $64,681 (Individual Income Tax Returns)
Here:
$64,681
State:
$39,572
Salary/wage: $57,166 (reported on 79.6% of returns)
Here:
$57,166
State:
$34,237
(% of AGI for various income ranges: 130.5% for AGIs below $10k, 65.0% for AGIs $10k-25k, 68.0% for AGIs $25k-50k, 70.7% for AGIs $50k-75k, 76.7% for AGIs $75k-100k, 68.5% for AGIs over 100k)
Taxable interest for individuals: $1,833 (reported on 59.7% of returns)
This zip code:
$1,833
New Mexico:
$1,873
(% of AGI for various income ranges: 14.2% for AGIs below $10k, 3.4% for AGIs $10k-25k, 1.5% for AGIs $25k-50k, 1.5% for AGIs $50k-75k, 1.1% for AGIs $75k-100k, 1.6% for AGIs over 100k)
Taxable dividends: $3,905 (reported on 40.3% of returns)
Here:
$3,905
State:
$3,554
(% of AGI for various income ranges: 11.4% for AGIs below $10k, 2.9% for AGIs $10k-25k, 2.8% for AGIs $25k-50k, 2.0% for AGIs $50k-75k, 1.7% for AGIs $75k-100k, 2.5% for AGIs over 100k)
Net capital gain/loss: +$9,957 (reported on 32.2% of returns)
Here:
+$9,957
State:
+$10,425
(% of AGI for various income ranges: -6.9% for AGIs below $10k, 0.9% for AGIs $10k-25k, 1.3% for AGIs $25k-50k, 1.5% for AGIs $50k-75k, 1.6% for AGIs $75k-100k, 7.9% for AGIs over 100k)
Profit/loss from business: +$13,492 (reported on 21.7% of returns)
Here:
+$13,492
State:
+$8,875
(% of AGI for various income ranges: 10.8% for AGIs below $10k, 3.4% for AGIs $10k-25k, 7.0% for AGIs $25k-50k, 3.9% for AGIs $50k-75k, 4.5% for AGIs $75k-100k, 4.3% for AGIs over 100k)
IRA payment deduction: $3,250 (reported on 3.2% of returns)
87008:
$3,250
New Mexico:
$2,940
Self-employed pension: $10,632 (reported on 1.4% of returns)
Here:
$10,632
New Mexico:
$13,110
Total itemized deductions: $20,698 (20% of AGI, reported on 50.1% of returns)
Here:
$20,698
State:
$18,103
Here:
20.5% of AGI
State:
21.5% of AGI
(% of AGI for various income ranges: 25.6% for AGIs below $10k, 13.6% for AGIs $10k-25k, 25.0% for AGIs $25k-50k, 15.9% for AGIs $50k-75k, 15.5% for AGIs $75k-100k, 14.6% for AGIs over 100k)
Charity contributions deductions: $3,622 (3% of AGI, reported on 44.4% of returns)
Here:
$3,622
State:
$3,246
Here:
3.4% of AGI
State:
3.6% of AGI
(% of AGI for various income ranges: 1.7% for AGIs $10k-25k, 2.2% for AGIs $25k-50k, 1.8% for AGIs $50k-75k, 2.1% for AGIs $75k-100k, 2.9% for AGIs over 100k)
Total tax: $10,701 (reported on 82.9% of returns)
87008:
$10,701
State:
$6,237
(% of AGI for various income ranges: 8.1% for AGIs below $10k, 4.7% for AGIs $10k-25k, 7.7% for AGIs $25k-50k, 9.9% for AGIs $50k-75k, 11.8% for AGIs $75k-100k, 17.1% for AGIs over 100k)
Earned income credit: $1,101 (reported on 6.4% of returns)
Here:
$1,101
State:
$1,796
Percentage of individuals using paid preparers for their 2004 taxes: 46.3%
Here:
46%
State:
57%
(% for various income ranges: 41.6% for AGIs below $10k, 45.0% for AGIs $10k-25k, 43.7% for AGIs $25k-50k, 50.0% for AGIs $50k-75k, 53.1% for AGIs $75k-100k, 47.4% for AGIs over 100k)
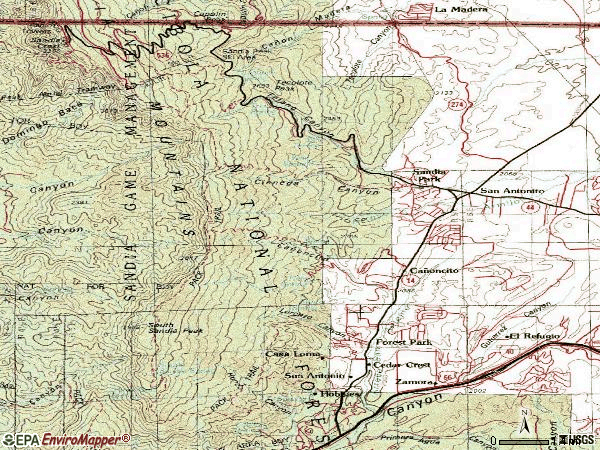
Notable locations in zip code 87008: Sulphur Canyon Picnic Area (A), Cole Spring Picnic Area (B), Summit House Restaurant (C), Ninemile Picnic Area (D), Crest Trailhead (E), Doc Long Trailhead (F), Cienega Trailhead (G), Ellis Trailhead (H), Ten K Trailhead (I), Canyon Estates Trailhead (J), Environmental Education Center (K), Sandia Peak Ski Area (L), Ellis Trailhead (M), Tree Spring Recreation Site (N), Paako Ruin (O), Hobbies (P), San Antonio de Padua de Carnua (Q), Kiwanis Cabin (R), La Madera Ski Area (S), Cedar Ridge P O (T). Display/hide their locations on the map
Churches in zip code 87008 include: Mountain Christian Church (A), San Lorenzo De Canyoncito (B), Mountain Christian Church (C), Prince of Peace Church (D), Prince of Peace Catholic Community (E), Cedar Crest Baptist Church (F). Display/hide their locations on the map
In group quarters: 18 (-1 institutionalized population)
Size of family households: 480 2-persons, 67 3-persons, 44 4-persons, 21 5-persons, 100 6-persons
Size of nonfamily households: 436 1-person, 61 2-persons
390 married couples with children.
18 single-parent households (18 women).
93.4% of residents of 87008 zip code speak English at home.
7.3% of residents speak Spanish at home (100% very well).
0.9% of residents speak other Indo-European language at home (100% very well).
0.7% of residents speak Asian or Pacific Island language at home (100% very well).
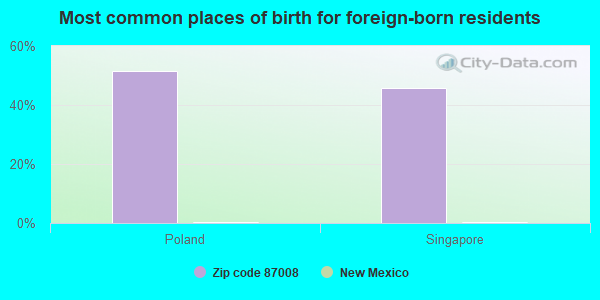
Foreign born population: 34 (1.4%) (100.0% of them are naturalized citizens)
This zip code:
1.4%
Whole state:
9.3%
51%Poland
46%Singapore
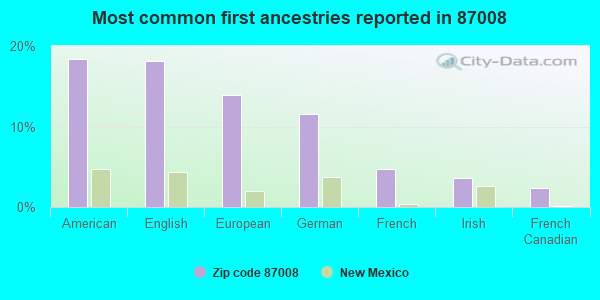
18%American
18%English
14%European
12%German
5%French
4%Irish
2%French Canadian
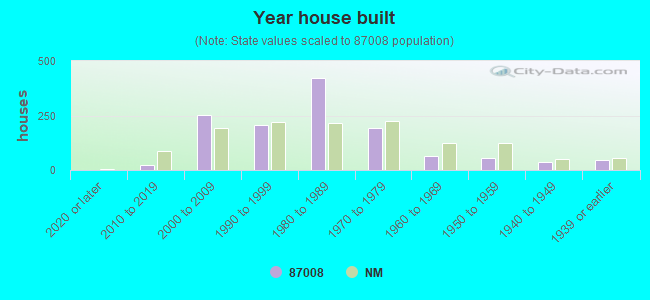
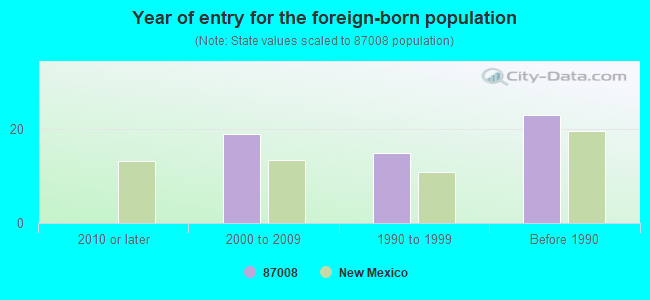
Year of entry for the foreign-born population
02010 or later
192000 to 2009
151990 to 1999
23Before 1990
Facilities with environmental interests located in this zip code:
CEDAR CREST RESIDENCE AREA (HIDDEN VALLEY LN SE OF in CEDAR CREST, NM)
(Resource Conservation and Recovery Act (tracking hazardous waste))
CEDAR CREST COUNTRY DAY SCH (12125 NORTH HWY 14 in CEDAR CREST, NM)
COMPLIANCE ACTIVITY (Tracking inspections of insecticide, fungicide, and rodenticide, and toxic substances) Alternative names: CEDER CREST COUNTRY DAY SCH
COUNTRY DAY SCHOOL (P.O. BOX 726 in CEDAR CREST, NM)
COMPLIANCE ACTIVITY (Tracking inspections of insecticide, fungicide, and rodenticide, and toxic substances)
Housing units lacking complete plumbing facilities: 1.4% Housing units lacking complete kitchen facilities: 1.6%
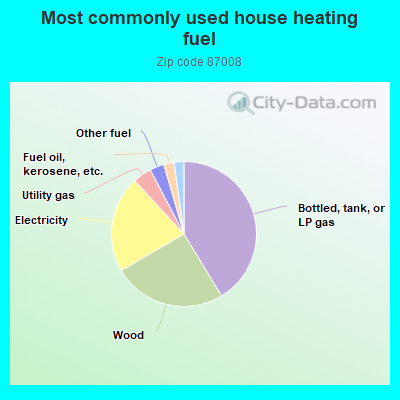
41.5%Bottled, tank, or LP gas
25.4%Wood
21.6%Electricity
4.2%Utility gas
3.2%Other fuel
2.3%Fuel oil, kerosene, etc.
2.2%Solar energy
Population in 1990: 1,860. Population change in the 1990s: +1,272 (+68.4%).
Place of birth for U.S.-born residents:
This state: 991
Northeast: 200
Midwest: 283
South: 503
West: 386
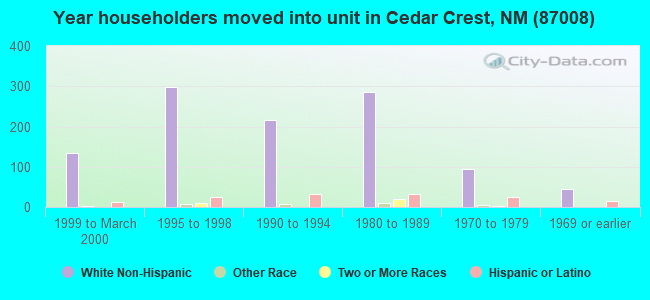
67% of the 87008 zip code residents lived in the same house 5 years ago. Out of people who lived in different houses, 60% lived in this county. Out of people who lived in different counties, 50% lived in New Mexico.
82% of the 87008 zip code residents lived in the same house 1 year ago. Out of people who lived in different houses, 20% moved from this county. Out of people who lived in different houses, 91% moved from different state.
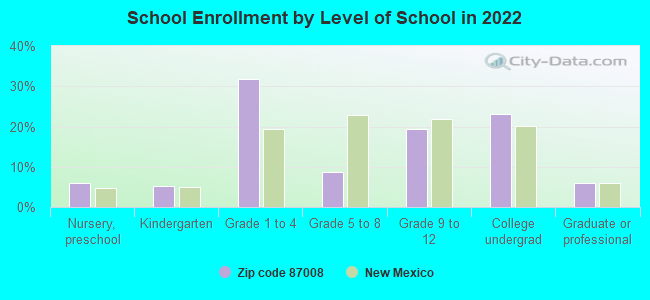
Private vs. public school enrollment:
Students in private schools in grades 1 to 8 (elementary and middle school): 98
Here:
51.0%
New Mexico:
10.2%
Students in private schools in grades 9 to 12 (high school): 45
Here:
47.1%
New Mexico:
10.0%
Students in private undergraduate colleges:
Here:
0.0%
New Mexico:
12.3%
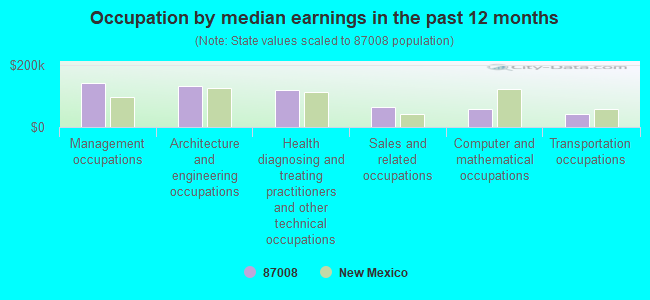
Occupation by median earnings in the past 12 months ($)
141,502Management occupations
131,205Architecture and engineering occupations
120,309Health diagnosing and treating practitioners and other technical occupations
62,883Sales and related occupations
56,625Computer and mathematical occupations
42,747Transportation occupations
Companies with federal contracts located in this zip code:
PAUL A DAVIS (ENVIROLOGIC INC in CEDAR CREST, NM; small business) : $474,500 in 8 contractsfrom 2003 to 2005
Contracts for Legal Services, Expert Witness by Offices, Boards and Divisions (includes Attorney General, Deputy Attorney General, etc.) Signed by year:2000: $0; 2001: $0; 2002: $0; 2003: $149,500; 2004: $265,000; 2005: $60,000; 2006: $0.
Biggest contracts:
$100,000 with Offices, Boards and Divisions (includes Attorney General, Deputy Attorney General, etc.) for Legal Services. Signed on 2004-09-16. Completion date: 2005-09-30.
$85,000, same as above.Signed on 2004-03-01. Completion date: 2004-09-30.
$80,000, same as above.Signed on 2004-05-05. Completion date: 2004-09-30.
$60,000 with Offices, Boards and Divisions (includes Attorney General, Deputy Attorney General, etc.) for Legal Services. Taking place in DC. Signed on 2005-07-26. Completion date: 2006-09-30.
CORNERSTONE CONSULTING ASSOCIA (36 SIERRA BLANCA in CEDAR CREST, NM; small business) : $269,380 in 6 contractsfrom 2005 to 2006
Contracts for Environmental Studies and Assessments, Hazardous Substance Removal, Cleanup, and Disposal Services and Operational Support by Army, U.S. Army Corps of Engineers - civil program financing only Signed by year:2000: $0; 2001: $0; 2002: $0; 2003: $0; 2004: $0; 2005: $197,480; 2006: $71,900.
Biggest contracts:
$64,966 with Army for Environmental Studies and Assessments. Signed on 2005-09-16. Completion date: 2006-03-31.
$64,966, same as above.Signed on 2005-09-16. Completion date: 2006-03-10.
$64,966 with U.S. Army Corps of Engineers - civil program financing only for Environmental Studies and Assessments. Signed on 2005-09-16. Completion date: 2006-03-10.
$63,400 with Army for Hazardous Substance Removal, Cleanup, and Disposal Services and Operational Support. Signed on 2006-02-14. Completion date: 2006-11-10.
Top industries in this zip code by the number of employees in 2005:


 Nearest zip codes: 87123, 87111, 87112, 87122, 87116, 87059.