Estimated zip code population in 2022: 10,024 Zip code population in 2010: 9,604 Zip code population in 2000: 10,256
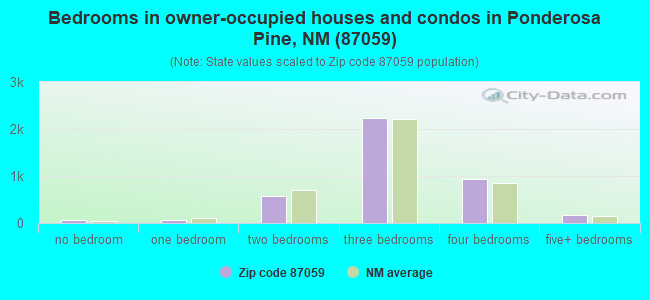
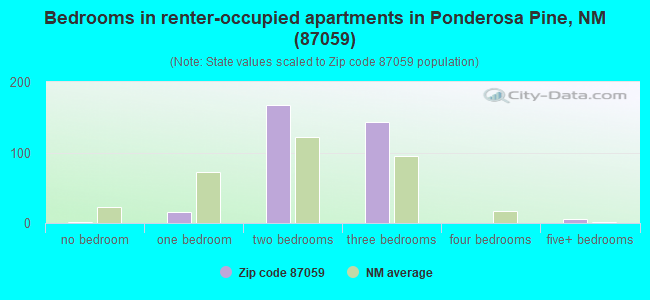
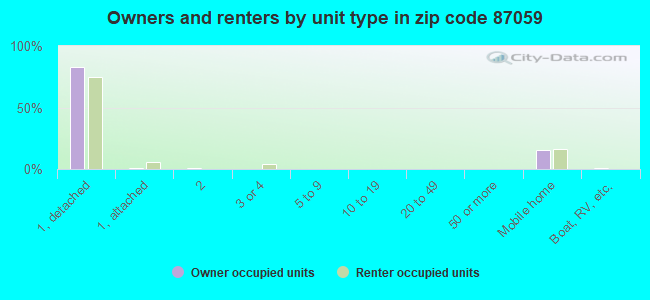
Houses and condos: 4,395 Renter-occupied apartments: 337
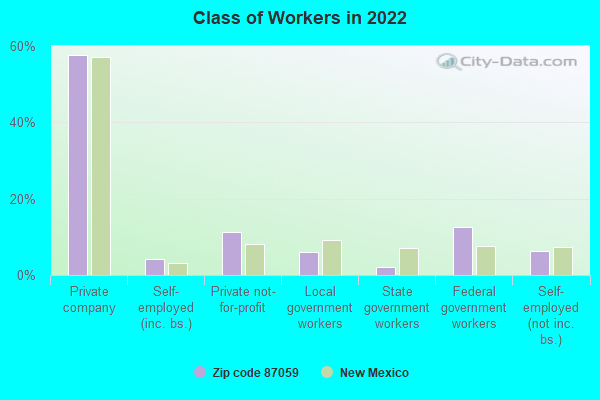
% of renters here:
8%
State:
29%
March 2022 cost of living index in zip code 87059: 89.6 (less than average, U.S. average is 100)
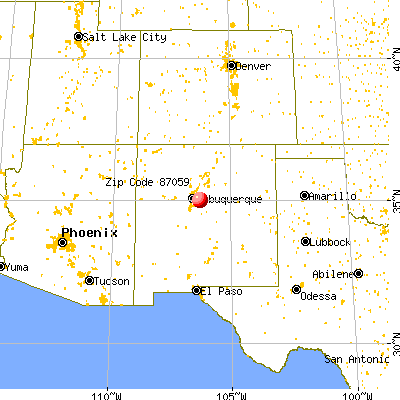
Land area: 142.3 sq. mi. Water area: 0.0 sq. mi.
Population density: 70 people per square mile
(very low).
OSM Map
General Map
Google Map
MSN Map
OSM Map
General Map
Google Map
MSN Map
OSM Map
General Map
Google Map
MSN Map
OSM Map
General Map
Google Map
MSN Map
Please wait while loading the map...
Real estate property taxes paid for housing units in 2022:
This zip code:
0.7% ($2,241)
New Mexico:
0.7% ($1,638)
Median real estate property taxes paid for housing units with mortgages in 2022: $2,315 (0.6%) Median real estate property taxes paid for housing units with no mortgage in 2022: $2,032 (0.7%)
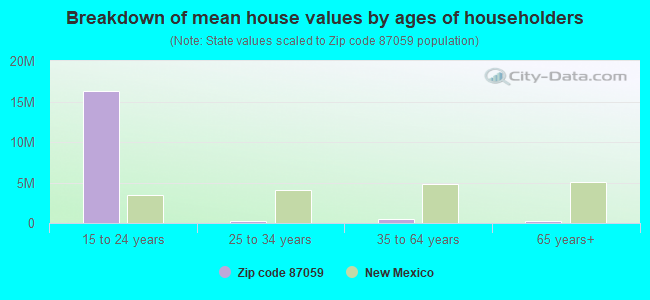
Estimated median house/condo value in 2022: $335,163
87059:
$335,163
New Mexico:
$243,100
According to our research of New Mexico and other state lists, there were 8 registered sex offenders living in 87059 zip code as of April 25, 2024. The ratio of all residents to sex offenders in zip code 87059 is 1,194 to 1. The ratio of registered sex offenders to all residents in this zip code is lower than the state average.
Median resident age:
This zip code:
51.5 years
New Mexico median age:
39.4 years
Average household size:
This zip code:
2.3 people
New Mexico:
2.4 people
Averages for the 2020 tax year for zip code 87059, filed in 2021:
Average Adjusted Gross Income (AGI) in 2020: $83,660 (Individual Income Tax Returns)
Here:
$83,660
State:
$59,146
Salary/wage: $70,810 (reported on 73.9% of returns)
Here:
$70,810
State:
$48,327
(% of AGI for various income ranges: 1046.7% for AGIs below $25k, 3251.9% for AGIs $25k-50k, 5829.3% for AGIs $50k-75k, 8236.1% for AGIs $75k-100k, 16751.4% for AGIs $100k-200k, 53770.0% for AGIs over 200k)
Taxable interest for individuals: $1,367 (reported on 45.0% of returns)
This zip code:
$1,367
New Mexico:
$1,616
(% of AGI for various income ranges: 20.1% for AGIs below $25k, 41.4% for AGIs $25k-50k, 87.5% for AGIs $50k-75k, 92.1% for AGIs $75k-100k, 169.1% for AGIs $100k-200k, 630.8% for AGIs over 200k)
Ordinary dividends: $5,610 (reported on 24.6% of returns)
Here:
$5,610
State:
$7,816
(% of AGI for various income ranges: 38.6% for AGIs below $25k, 59.5% for AGIs $25k-50k, 109.3% for AGIs $50k-75k, 198.8% for AGIs $75k-100k, 343.4% for AGIs $100k-200k, 2140.0% for AGIs over 200k)
Net capital gain/loss in AGI: +$13,531 (reported on 23.0% of returns)
Here:
+$13,531
State:
+$19,595
(% of AGI for various income ranges: 45.1% for AGIs below $25k, 39.8% for AGIs $25k-50k, 208.2% for AGIs $50k-75k, 265.5% for AGIs $75k-100k, 637.1% for AGIs $100k-200k, 6950.0% for AGIs over 200k)
Profit/loss from business: +$13,304 (reported on 16.3% of returns)
Here:
+$13,304
State:
+$11,430
(% of AGI for various income ranges: 108.2% for AGIs below $25k, 152.4% for AGIs $25k-50k, 193.2% for AGIs $50k-75k, 245.2% for AGIs $75k-100k, 659.1% for AGIs $100k-200k, 2272.5% for AGIs over 200k)
Taxable individual retirement arrangement distribution: $22,681 (reported on 12.4% of returns)
87059:
$22,681
New Mexico:
$20,970
(% of AGI for various income ranges: 70.5% for AGIs below $25k, 170.0% for AGIs $25k-50k, 281.6% for AGIs $50k-75k, 540.0% for AGIs $75k-100k, 830.4% for AGIs $100k-200k, 2977.5% for AGIs over 200k)
Self-employed (Keogh) retirement plans: $17,367 (reported on 0.7% of returns)
87059:
$17,367
New Mexico:
$20,997
(% of AGI for various income ranges: 93.0% for AGIs $100k-200k)
Total itemized deductions: $30,369 (reported on 10.7% of returns)
Here:
$30,369
State:
$33,187
(% of AGI for various income ranges: 163.3% for AGIs $25k-50k, 235.0% for AGIs $50k-75k, 513.9% for AGIs $75k-100k, 1090.9% for AGIs $100k-200k, 4177.5% for AGIs over 200k)
Charity contributions: $10,138 (reported on 8.5% of returns)
Here:
$10,138
State:
$11,850
(% of AGI for various income ranges: 14.0% for AGIs $25k-50k, 33.2% for AGIs $50k-75k, 104.8% for AGIs $75k-100k, 263.4% for AGIs $100k-200k, 1582.5% for AGIs over 200k)
Taxes paid: $7,892 (reported on 10.7% of returns)
87059:
$7,892
State:
$7,150
(% of AGI for various income ranges: 27.3% for AGIs $25k-50k, 57.3% for AGIs $50k-75k, 118.8% for AGIs $75k-100k, 318.9% for AGIs $100k-200k, 1054.2% for AGIs over 200k)
Earned income credit: $1,869 (reported on 11.3% of returns)
Here:
$1,869
State:
$2,323
(% of AGI for various income ranges: 70.0% for AGIs below $25k, 57.6% for AGIs $25k-50k)
Percentage of individuals using paid preparers for their 2020 taxes: 90.9%
Here:
91%
State:
92%
(% for various income ranges: 88.2% for AGIs below $25k, 94.0% for AGIs $25k-50k, 90.5% for AGIs $50k-75k, 90.4% for AGIs $75k-100k, 91.1% for AGIs $100k-200k, 93.9% for AGIs over 200k)
Averages for the 2012 tax year for zip code 87059, filed in 2013:
Average Adjusted Gross Income (AGI) in 2012: $67,680 (Individual Income Tax Returns)
Here:
$67,680
State:
$50,343
Salary/wage: $58,405 (reported on 80.7% of returns)
Here:
$58,405
State:
$41,171
(% of AGI for various income ranges: 69.3% for AGIs below $25k, 72.4% for AGIs $25k-50k, 70.1% for AGIs $50k-75k, 70.9% for AGIs $75k-100k, 74.2% for AGIs $100k-200k, 57.6% for AGIs over 200k)
Taxable interest for individuals: $1,213 (reported on 44.0% of returns)
This zip code:
$1,213
New Mexico:
$1,677
(% of AGI for various income ranges: 1.7% for AGIs below $25k, 0.9% for AGIs $25k-50k, 0.9% for AGIs $50k-75k, 1.0% for AGIs $75k-100k, 0.6% for AGIs $100k-200k, 0.6% for AGIs over 200k)
Ordinary dividends: $3,812 (reported on 25.4% of returns)
Here:
$3,812
State:
$6,939
(% of AGI for various income ranges: 2.3% for AGIs below $25k, 1.3% for AGIs $25k-50k, 0.9% for AGIs $50k-75k, 1.0% for AGIs $75k-100k, 1.2% for AGIs $100k-200k, 2.4% for AGIs over 200k)
Net capital gain/loss in AGI: +$6,576 (reported on 21.5% of returns)
Here:
+$6,576
State:
+$14,311
(% of AGI for various income ranges: 0.5% for AGIs below $25k, 0.3% for AGIs $50k-75k, 0.8% for AGIs $75k-100k, 1.9% for AGIs $100k-200k, 6.7% for AGIs over 200k)
Profit/loss from business: +$11,414 (reported on 20.0% of returns)
Here:
+$11,414
State:
+$11,059
(% of AGI for various income ranges: 10.2% for AGIs below $25k, 4.4% for AGIs $25k-50k, 3.3% for AGIs $50k-75k, 2.8% for AGIs $75k-100k, 2.3% for AGIs $100k-200k, 3.3% for AGIs over 200k)
Taxable individual retirement arrangement distribution: $16,696 (reported on 11.6% of returns)
87059:
$16,696
New Mexico:
$15,706
(% of AGI for various income ranges: 3.2% for AGIs below $25k, 2.5% for AGIs $25k-50k, 3.1% for AGIs $50k-75k, 3.4% for AGIs $75k-100k, 2.7% for AGIs $100k-200k, 2.5% for AGIs over 200k)
Self-employment retirement plans: $13,825 (reported on 0.9% of returns)
87059:
$13,825
New Mexico:
$18,209
Total itemized deductions: $21,420 (20% of AGI, reported on 41.7% of returns)
Here:
$21,420
State:
$21,709
Here:
19.6% of AGI
State:
19.8% of AGI
(% of AGI for various income ranges: 11.8% for AGIs below $25k, 12.9% for AGIs $25k-50k, 12.9% for AGIs $50k-75k, 14.1% for AGIs $75k-100k, 13.8% for AGIs $100k-200k, 11.9% for AGIs over 200k)
Charity contributions: $3,762 (reported on 33.1% of returns)
Here:
$3,762
State:
$4,195
(% of AGI for various income ranges: 0.6% for AGIs below $25k, 1.1% for AGIs $25k-50k, 1.3% for AGIs $50k-75k, 2.2% for AGIs $75k-100k, 2.0% for AGIs $100k-200k, 2.4% for AGIs over 200k)
Taxes paid: $6,506 (reported on 41.3% of returns)
87059:
$6,506
State:
$6,176
(% of AGI for various income ranges: 2.0% for AGIs below $25k, 2.8% for AGIs $25k-50k, 2.9% for AGIs $50k-75k, 3.9% for AGIs $75k-100k, 4.6% for AGIs $100k-200k, 4.7% for AGIs over 200k)
Earned income credit: $1,905 (reported on 13.4% of returns)
Here:
$1,905
State:
$2,311
(% of AGI for various income ranges: 5.1% for AGIs below $25k, 0.9% for AGIs $25k-50k)
Percentage of individuals using paid preparers for their 2012 taxes: 43.3%
Here:
43%
State:
50%
(% for various income ranges: 39.7% for AGIs below $25k, 41.6% for AGIs $25k-50k, 47.4% for AGIs $50k-75k, 42.6% for AGIs $75k-100k, 44.6% for AGIs $100k-200k, 64.7% for AGIs over 200k)
Averages for the 2004 tax year for zip code 87059, filed in 2005:
Average Adjusted Gross Income (AGI) in 2004: $55,429 (Individual Income Tax Returns)
Here:
$55,429
State:
$39,572
Salary/wage: $50,073 (reported on 84.9% of returns)
Here:
$50,073
State:
$34,237
(% of AGI for various income ranges: 106.6% for AGIs below $10k, 73.4% for AGIs $10k-25k, 78.8% for AGIs $25k-50k, 81.4% for AGIs $50k-75k, 83.3% for AGIs $75k-100k, 71.1% for AGIs over 100k)
Taxable interest for individuals: $1,283 (reported on 52.3% of returns)
This zip code:
$1,283
New Mexico:
$1,873
(% of AGI for various income ranges: 5.1% for AGIs below $10k, 2.6% for AGIs $10k-25k, 1.5% for AGIs $25k-50k, 1.1% for AGIs $50k-75k, 1.0% for AGIs $75k-100k, 1.0% for AGIs over 100k)
Taxable dividends: $2,159 (reported on 29.0% of returns)
Here:
$2,159
State:
$3,554
(% of AGI for various income ranges: 5.0% for AGIs below $10k, 1.6% for AGIs $10k-25k, 1.2% for AGIs $25k-50k, 0.6% for AGIs $50k-75k, 0.8% for AGIs $75k-100k, 1.3% for AGIs over 100k)
Net capital gain/loss: +$5,037 (reported on 24.4% of returns)
Here:
+$5,037
State:
+$10,425
(% of AGI for various income ranges: -1.3% for AGIs below $10k, 1.0% for AGIs $10k-25k, 0.2% for AGIs $25k-50k, 1.0% for AGIs $50k-75k, 0.9% for AGIs $75k-100k, 4.1% for AGIs over 100k)
Profit/loss from business: +$10,619 (reported on 19.8% of returns)
Here:
+$10,619
State:
+$8,875
(% of AGI for various income ranges: 2.0% for AGIs below $10k, 6.9% for AGIs $10k-25k, 5.8% for AGIs $25k-50k, 3.3% for AGIs $50k-75k, 3.0% for AGIs $75k-100k, 3.3% for AGIs over 100k)
IRA payment deduction: $3,206 (reported on 4.2% of returns)
87059:
$3,206
New Mexico:
$2,940
(% of AGI for various income ranges: 0.5% for AGIs $10k-25k, 0.4% for AGIs $25k-50k, 0.3% for AGIs $50k-75k, 0.2% for AGIs $75k-100k, 0.2% for AGIs over 100k)
Self-employed pension: $9,032 (reported on 1.5% of returns)
Here:
$9,032
New Mexico:
$13,110
(% of AGI for various income ranges: 0.3% for AGIs $25k-50k, 0.2% for AGIs $50k-75k, 0.2% for AGIs $75k-100k, 0.3% for AGIs over 100k)
Total itemized deductions: $18,434 (21% of AGI, reported on 45.9% of returns)
Here:
$18,434
State:
$18,103
Here:
20.5% of AGI
State:
21.5% of AGI
(% of AGI for various income ranges: 15.2% for AGIs below $10k, 11.3% for AGIs $10k-25k, 15.0% for AGIs $25k-50k, 16.6% for AGIs $50k-75k, 16.7% for AGIs $75k-100k, 14.7% for AGIs over 100k)
Charity contributions deductions: $2,670 (3% of AGI, reported on 39.4% of returns)
Here:
$2,670
State:
$3,246
Here:
2.8% of AGI
State:
3.6% of AGI
(% of AGI for various income ranges: 0.7% for AGIs below $10k, 0.9% for AGIs $10k-25k, 1.5% for AGIs $25k-50k, 1.8% for AGIs $50k-75k, 2.2% for AGIs $75k-100k, 2.1% for AGIs over 100k)
Total tax: $8,443 (reported on 80.5% of returns)
87059:
$8,443
State:
$6,237
(% of AGI for various income ranges: 3.2% for AGIs below $10k, 4.6% for AGIs $10k-25k, 7.4% for AGIs $25k-50k, 9.0% for AGIs $50k-75k, 11.0% for AGIs $75k-100k, 16.9% for AGIs over 100k)
Earned income credit: $1,511 (reported on 11.1% of returns)
Here:
$1,511
State:
$1,796
Percentage of individuals using paid preparers for their 2004 taxes: 46.1%
Here:
46%
State:
57%
(% for various income ranges: 43.6% for AGIs below $10k, 47.8% for AGIs $10k-25k, 47.7% for AGIs $25k-50k, 47.1% for AGIs $50k-75k, 44.8% for AGIs $75k-100k, 45.1% for AGIs over 100k)
Household received Food Stamps/SNAP in the past 12 months: 504 Household did not receive Food Stamps/SNAP in the past 12 months: 3,739
Women who had a birth in the past 12 months: 155 (108 now married, 49 unmarried) Women who did not have a birth in the past 12 months: 1,684 (918 now married, 751 unmarried)
Housing units in zip code 87059 with a mortgage: 2,406 (162 second mortgage, 84 both second mortgage and home equity loan) Houses without a mortgage: 66
Median monthly owner costs for units with a mortgage: $1,696 Median monthly owner costs for units without a mortgage: $524
Residents with income below the poverty level in 2022:
This zip code:
10.7%
Whole state:
17.6%
Residents with income below 50% of the poverty level in 2022:
This zip code:
6.1%
Whole state:
9.7%
Median number of rooms in houses and condos:
Here:
6.4
State:
5.9
Median number of rooms in apartments:
Here:
4.6
State:
4.2
Notable locations in this zip code not listed on our city pages
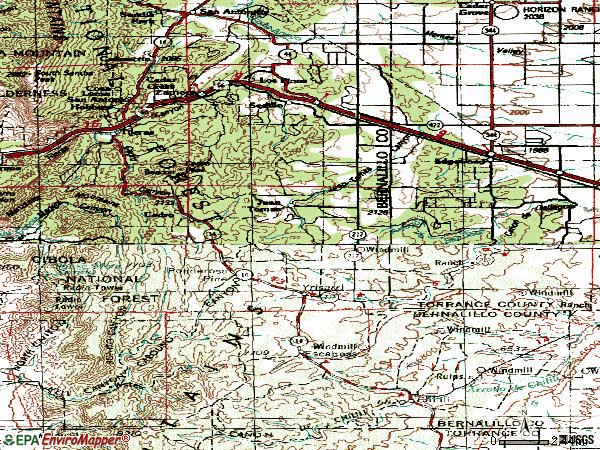
Notable locations in zip code 87059: Marsh Ranch (A), Riedmont Fur Farm (B), Sandia Ranger Station (C), Tranquillo Pine (D), Tijeras Ranch (E), Pine Flat Picnic Area (F), Presbyterian Church Camp (G), Otero Canyon Trailhead (H), East Mountain Library (I), Deadman Campground (J), YWCA Camp (K), Oak Flat District Ranger Office (L), Carolino Canyon Recreation Site (M), Tunnel Canyon Trailhead (N), Oak Flat Recreation Site (O), Cedro Peak Recreation Site (P), Deadman Recreation Site (Q), Sedillo Hill (R), La Jaral Ranch (S), Sabino (T). Display/hide their locations on the map
Churches in zip code 87059 include: Forest Meadow Baptist Church (A), First Baptist Church of Tijeras (B), Good Shepherd Lutheran Church (C), Holy Child Church (D), Mountain United Methodist (E), Tijeras Congregation of Jehovahs Witnesses (F), Prince of Peace Lutheran Church (G). Display/hide their locations on the map
Cemeteries: Cedro Cemetery (1), Sedillo Cemetery (2), Tijeras Cemetery (3), Escabosa Cemetery (4), Juan Tomas Cemetery (5), Chilili Cemetery (6), Saint John Nepomucene Cemetery (7). Display/hide their locations on the map
In group quarters: 16 (-1 institutionalized population)
Size of family households: 2,043 2-persons, 679 3-persons, 368 4-persons, 125 5-persons, 101 6-persons, 51 7-or-more-persons
Size of nonfamily households: 741 1-person, 151 2-persons, 4 3-persons
1,223 married couples with children.
244 single-parent households (119 men, 125 women).
90.9% of residents of 87059 zip code speak English at home.
9.5% of residents speak Spanish at home (91% very well, 9% well).
0.8% of residents speak other Indo-European language at home (100% very well).
0.5% of residents speak Asian or Pacific Island language at home (59% very well, 41% not well).
0.3% of residents speak other language at home (100% very well).
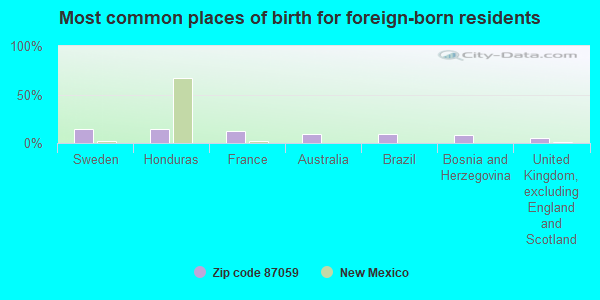
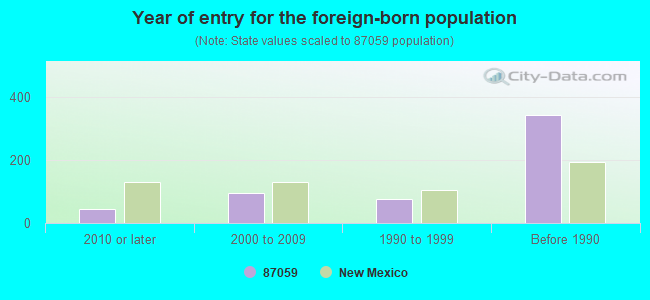
Foreign born population: 333 (3.3%) (72.6% of them are naturalized citizens)
This zip code:
3.3%
Whole state:
9.3%
15%Sweden
14%Honduras
12%France
9%Australia
9%Brazil
9%Bosnia and Herzegovina
5%United Kingdom, excluding England and Scotland
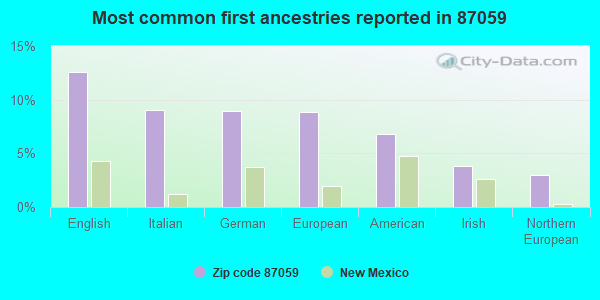
13%English
9%Italian
9%German
9%European
7%American
4%Irish
3%Northern European
Year of entry for the foreign-born population
452010 or later
952000 to 2009
771990 to 1999
342Before 1990
Major facilities with environmental interests located in this zip code:
GCC RIO GRANDE TIJERAS PLANT (11783 STATE HWY. 337 in TIJERAS, NM)
AIR MAJOR (AIRS/AFS) CRITERIA AND HAZARDOUS AIR POLLUTANT INVENTORY (Inventory of air pollution sources) National Pollutant Discharge Elimination System NON-MAJOR (Tracking pollutant discharge elimination systems) - permit - ICIS-, ENFORCEMENT/COMPLIANCE ACTIVITY TRI REPORTER (Tracking of toxic chemicals releasing facilities) Business SIC classification: CEMENT, HYDRAULIC Business NAICS classification: CEMENT MANUFACTURING. Alternative names: GCC RIO GRANDE INC., IDEAL CEMENT COMPANY, RIO GRANDE PORTLAND CEMENT, RIO GRANDE PORTLANT CEMENT CORP.
A MONTOYA ELEMENTARY (24 PUBLIC SCHOOL RD in TIJERAS, NM)
(National Center for Education Statistics) - STATE ID-01011321 Organizations: ALBUQUERQUE PUBLIC SCHOOLS (SCHOOL DISTRICT)
ROOSEVELT MIDDLE (11799 ST. HWY 14 S. in TIJERAS, NM)
(National Center for Education Statistics) - STATE ID-01011452 Organizations: ALBUQUERQUE PUBLIC SCHOOLS (SCHOOL DISTRICT)
BEARCAT HOMEOWNERS ASSOCIATION WATER SYS (14 MOUNTAIN PLACE in TIJERAS, NM)
(Integrated Compliance Information System) - ICIS-06-1998-0309, FORMAL ENFORCEMENT ACTION Business SIC classification: WATER SUPPLY
CHILILI WATER AND SEWER COPERATIVE (14 OLD CHILILI RD in CHILILI, NM)
(Integrated Compliance Information System) - ICIS-06-1998-0089, FORMAL ENFORCEMENT ACTION, ICIS-06-2002-1410, Business SIC classification: WATER SUPPLY
EL SHADDAI WATER COOPERATIVE (PO BOX 2500 in TIJERAS, NM)
(Integrated Compliance Information System) - ICIS-06-2001-5149, FORMAL ENFORCEMENT ACTION Business SIC classification: WATER SUPPLY
LOYDS PIT (11 MI NW OF TIJERAS in TIJERAS, NM)
AIR MINOR (AIRS/AFS) STATE MASTER (New Mexico tracking) Business SIC classification: MISCELLANEOUS NONMETALLIC MINERALS, EXCEPT FUELS Organizations: LOYDS DIRT & GRAVEL
HAVEN TRUCKING (11795 STATE HWY 145 in TIJERAS, NM)
(Resource Conservation and Recovery Act (tracking hazardous waste))
HOLNAM INC (#1 CEMENT PLT LN S HWY 14 in TIJERAS, NM)
(Resource Conservation and Recovery Act (tracking hazardous waste)) Organizations: G E CAPITAL CORP (CONTACT/OWNER)
Alternative names: HOLNAM INC/TIJERAS PLT
CANYON CHEVRON (844 EAST HWY66 in ALBUQUERQUE, NM)
AIR MINOR (AIRS/AFS) Business SIC classification: GASOLINE SERVICE STATIONS
AIR MINOR (AIRS/AFS) Business SIC classification: READY-MIXED CONCRETE Alternative names: JOBE CONCRETE PRODUCTS INC CEMEX - 300TP, RIO GRANDE MATERIALS, RIO GRANDE MATLS 300TPH CON PLT, RIO GRANDE MATERIALS, INC 300TPH CONRETE, RIO GRANDE MATERIALS, INC RIO GRANDE MAT, RIO GRANDE MATERIALS, INC RIO GRANDE MAT
LAFARGE CORP SEDILLO HILL (I-25 EAST EXIT 178 ZUZAX in NOT IN A CITY, NM)
AIR MINOR (AIRS/AFS) Business SIC classification: CRUSHED AND BROKEN LIMESTONE; READY-MIXED CONCRETE
ROUND UP 66 (10747 STATE HWY 337 in ALBUQUERQUE, NM)
AIR MINOR (AIRS/AFS) Business SIC classification: GASOLINE SERVICE STATIONS
Housing units lacking complete plumbing facilities: 1.1% Housing units lacking complete kitchen facilities: 0.7%
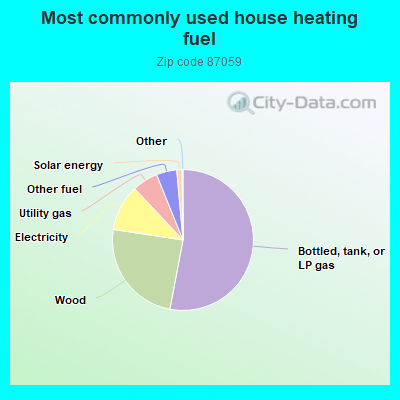
53.0%Bottled, tank, or LP gas
24.4%Wood
10.6%Electricity
5.9%Utility gas
4.7%Other fuel
1.2%Solar energy
Population in 1990: 6,861. Population change in the 1990s: +3,395 (+49.5%).
Place of birth for U.S.-born residents:
This state: 4,226
Northeast: 1,084
Midwest: 1,113
South: 1,234
West: 1,818
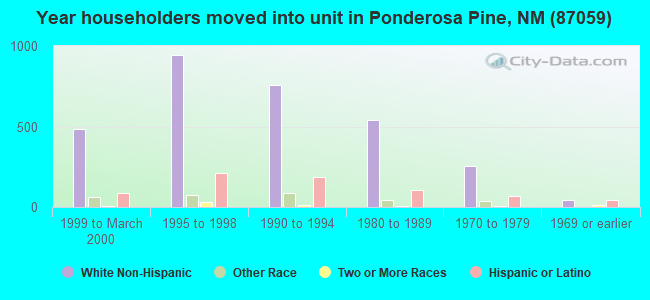
63% of the 87059 zip code residents lived in the same house 5 years ago. Out of people who lived in different houses, 55% lived in this county. Out of people who lived in different counties, 50% lived in New Mexico.
92% of the 87059 zip code residents lived in the same house 1 year ago. Out of people who lived in different houses, 35% moved from this county. Out of people who lived in different houses, 4% moved from different county within same state. Out of people who lived in different houses, 67% moved from different state. Out of people who lived in different houses, 3% moved from abroad.
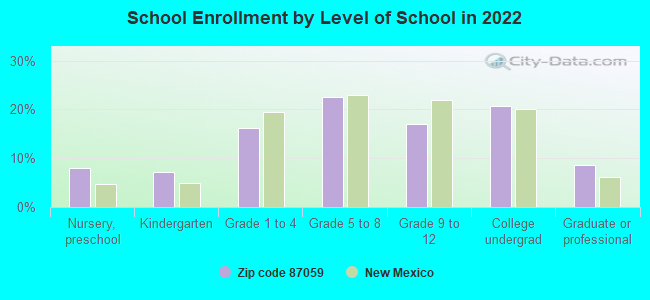
Private vs. public school enrollment:
Students in private schools in grades 1 to 8 (elementary and middle school): 179
Here:
22.9%
New Mexico:
10.2%
Students in private schools in grades 9 to 12 (high school): 42
Here:
12.4%
New Mexico:
10.0%
Students in private undergraduate colleges: 142
Here:
34.6%
New Mexico:
12.3%
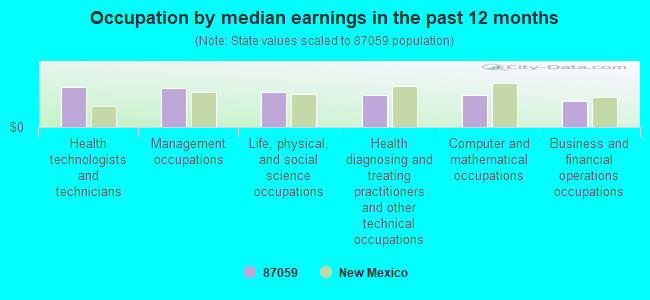
Occupation by median earnings in the past 12 months ($)
103,101Health technologists and technicians
100,890Management occupations
90,361Life, physical, and social science occupations
82,865Health diagnosing and treating practitioners and other technical occupations
81,247Computer and mathematical occupations
67,576Business and financial operations occupations
Companies with federal contracts located in this zip code (TIJERAS, NM):
ADVANCED OPTICAL CONSULTING (43 CAMPO RD; small business) : $542,498 in 9 contractsfrom 2004 to 2006
Contracts for Weapons -- Basic Research (R&D), Other Defense -- Applied Research and Exploratory Development (R&D) by Air Force Signed by year:2000: $0; 2001: $0; 2002: $0; 2003: $0; 2004: $146,000; 2005: $293,644; 2006: $102,854.
Biggest contracts:
$100,000 with Air Force for Weapons -- Basic Research (R&D). Signed on 2005-04-06. Completion date: 2006-03-30.
$100,000, same as above.Signed on 2004-08-23. Completion date: 2006-03-30.
$99,937 with Air Force for Other Defense -- Applied Research and Exploratory Development (R&D). Signed on 2005-04-15. Completion date: 2006-04-13.
$72,854 with Air Force for Weapons -- Basic Research (R&D). Signed on 2006-06-08. Completion date: 2007-03-31.
MOUNTAIN AVIATION ENTERPRISES, (3 MI FROM BOX I40; small business) 8 employees, $250000 revenue. : $76,791 in 2 contractsfrom 2001 to 2003
$40,791 with Forest Service for Forest/Range Fire Suppression/Presuppression Services. Signed on 2003-09-15. Completion date: 2004-03-15.
$36,000 with Forest Service (disused code: now 12C2) for Passenger Air Charter Service. Signed on 2001-10-15. Completion date: 2002-09-15.
BECKER, ROBERT W ASSOCIATES (707 HIGHWAY 66 E STE B; small business) : $61,915 in 2 contractsfrom 2004 to 2006
$48,800 with Air Force for Legal Services. Signed on 2004-12-29. Completion date: 2005-12-28.
$13,115, same as above.Signed on 2006-01-09. Completion date: 2006-12-28.
PEGASUS INDUSTRIES (5 STEEPLECHASE CT; small business)
$15,950 with Air Force for Other Education and Training Services. Signed on 2005-05-01. Completion date: 2006-04-30.
MANAGEMENT SOLUTIONS LLC (15TH & FUTURITY PL; small business)
-$32,000 with ENERGY, Department of for Program Management/Support Services. Taking place in WA. Signed on 2000-06-15. Completion date: 2000-01-15.
Top industries in this zip code by the number of employees in 2005:
Construction: Drywall and Insulation Contractors (50-99 employees: 1 establishment)
Construction: New Single-Family Housing Construction (except Operative Builders) (5-9: 2, 1-4: 13)
Construction: Site Preparation Contractors (20-49: 1)
Accommodation and Food Services: Drinking Places (Alcoholic Beverages) (20-49: 1)
Arts, Entertainment, and Recreation: Musical Groups and Artists (20-49: 1)
Administrative and Support and Waste Management and Remediation Services: Temporary Help Services (20-49: 1)
Professional, Scientific, and Technical Services: Veterinary Services (20-49: 1)
Accommodation and Food Services: Snack and Nonalcoholic Beverage Bars (20-49: 1)
Administrative and Support and Waste Management and Remediation Services: Landscaping Services (10-19: 1, 5-9: 1, 1-4: 2)
People in group quarters in 2010:
9 people in other noninstitutional facilities
Fatal accident statistics in 2014:
Fatal accident count: 2
Vehicles involved in fatal accidents: 2
Fatal accidents caused by drunken drivers: 1
Fatalities: 2
Persons involved in fatal accidents: 2
Pedestrians involved in fatal accidents: 0
Fatal accident statistics in 2013:
Fatal accident count: 2
Vehicles involved in fatal accidents: 4
Fatal accidents caused by drunken drivers: 0
Fatalities: 2
Persons involved in fatal accidents: 4
Pedestrians involved in fatal accidents: 1
Home Mortgage Disclosure Act Aggregated Statistics For Year 2009 (Based on 2 full and 4 partial tracts)
A) FHA, FSA/RHS & VA Home Purchase Loans
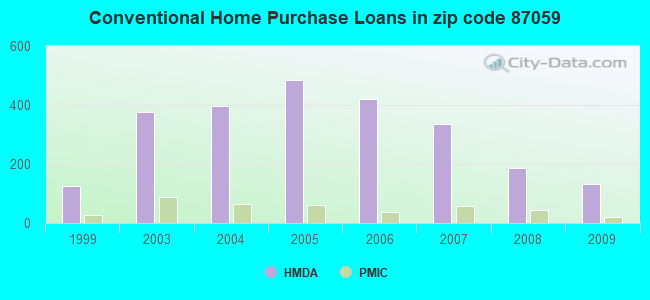
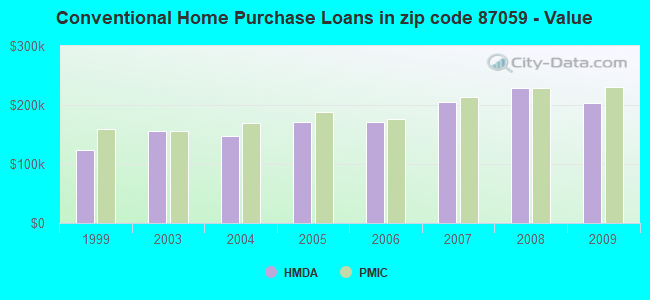
B) Conventional Home Purchase Loans
C) Refinancings
D) Home Improvement Loans
F) Non-occupant Loans on < 5 Family Dwellings (A B C & D)
G) Loans On Manufactured Home Dwelling (A B C & D)
Number
Average Value
Number
Average Value
Number
Average Value
Number
Average Value
Number
Average Value
Number
Average Value
LOANS ORIGINATED
92
$206,758
131
$203,688
612
$217,841
41
$81,980
23
$218,934
52
$128,169
APPLICATIONS APPROVED, NOT ACCEPTED
11
$111,675
14
$212,219
39
$234,551
6
$18,165
6
$129,228
10
$114,938
APPLICATIONS DENIED
13
$132,465
34
$175,207
211
$227,988
40
$47,120
14
$196,785
35
$110,748
APPLICATIONS WITHDRAWN
20
$205,894
23
$146,395
163
$200,226
15
$113,876
5
$101,376
18
$123,353
FILES CLOSED FOR INCOMPLETENESS
2
$149,000
6
$215,373
41
$247,978
2
$162,000
0
$0
1
$190,030
Aggregated Statistics For Year 2008 (Based on 2 full and 4 partial tracts)
A) FHA, FSA/RHS & VA Home Purchase Loans
B) Conventional Home Purchase Loans
C) Refinancings
D) Home Improvement Loans
F) Non-occupant Loans on < 5 Family Dwellings (A B C & D)
G) Loans On Manufactured Home Dwelling (A B C & D)
Number
Average Value
Number
Average Value
Number
Average Value
Number
Average Value
Number
Average Value
Number
Average Value
LOANS ORIGINATED
38
$198,509
186
$229,638
423
$211,047
67
$61,681
31
$191,106
55
$121,586
APPLICATIONS APPROVED, NOT ACCEPTED
7
$132,399
33
$228,890
75
$209,367
17
$49,987
9
$197,742
11
$80,125
APPLICATIONS DENIED
8
$129,509
29
$201,305
223
$190,621
67
$69,075
15
$170,413
58
$96,282
APPLICATIONS WITHDRAWN
5
$173,008
24
$276,490
139
$209,827
21
$148,413
11
$107,105
26
$114,840
FILES CLOSED FOR INCOMPLETENESS
4
$177,500
7
$176,780
33
$185,910
3
$113,820
1
$154,900
4
$146,975
Aggregated Statistics For Year 2007 (Based on 2 full and 4 partial tracts)
A) FHA, FSA/RHS & VA Home Purchase Loans
B) Conventional Home Purchase Loans
C) Refinancings
D) Home Improvement Loans
F) Non-occupant Loans on < 5 Family Dwellings (A B C & D)
G) Loans On Manufactured Home Dwelling (A B C & D)
Number
Average Value
Number
Average Value
Number
Average Value
Number
Average Value
Number
Average Value
Number
Average Value
LOANS ORIGINATED
56
$153,504
336
$204,454
462
$204,177
84
$70,283
70
$194,292
90
$108,202
APPLICATIONS APPROVED, NOT ACCEPTED
4
$95,385
68
$191,051
98
$198,610
9
$79,462
20
$157,362
15
$91,653
APPLICATIONS DENIED
11
$146,576
69
$122,096
309
$154,310
88
$77,814
27
$120,125
94
$100,486
APPLICATIONS WITHDRAWN
9
$108,151
38
$228,330
175
$169,894
39
$86,948
16
$205,222
20
$91,451
FILES CLOSED FOR INCOMPLETENESS
1
$112,840
10
$208,897
36
$194,329
4
$54,975
2
$232,345
3
$93,397
Aggregated Statistics For Year 2006 (Based on 2 full and 4 partial tracts)
A) FHA, FSA/RHS & VA Home Purchase Loans
B) Conventional Home Purchase Loans
C) Refinancings
D) Home Improvement Loans
F) Non-occupant Loans on < 5 Family Dwellings (A B C & D)
G) Loans On Manufactured Home Dwelling (A B C & D)
Number
Average Value
Number
Average Value
Number
Average Value
Number
Average Value
Number
Average Value
Number
Average Value
LOANS ORIGINATED
41
$176,524
419
$171,791
550
$171,125
66
$55,028
54
$160,870
97
$100,907
APPLICATIONS APPROVED, NOT ACCEPTED
6
$109,025
63
$159,560
93
$156,105
21
$58,420
8
$207,965
25
$97,162
APPLICATIONS DENIED
6
$92,160
85
$152,306
308
$149,381
95
$65,819
23
$146,879
74
$91,859
APPLICATIONS WITHDRAWN
8
$114,200
55
$133,529
208
$161,067
29
$66,208
12
$116,362
20
$78,446
FILES CLOSED FOR INCOMPLETENESS
1
$201,910
7
$139,071
56
$165,789
3
$97,377
6
$103,922
1
$81,650
Aggregated Statistics For Year 2005 (Based on 2 full and 4 partial tracts)
A) FHA, FSA/RHS & VA Home Purchase Loans
B) Conventional Home Purchase Loans
C) Refinancings
D) Home Improvement Loans
F) Non-occupant Loans on < 5 Family Dwellings (A B C & D)
G) Loans On Manufactured Home Dwelling (A B C & D)
Number
Average Value
Number
Average Value
Number
Average Value
Number
Average Value
Number
Average Value
Number
Average Value
LOANS ORIGINATED
56
$148,219
484
$170,798
527
$167,014
57
$41,982
66
$160,162
76
$94,281
APPLICATIONS APPROVED, NOT ACCEPTED
5
$121,532
64
$155,702
91
$151,038
5
$26,762
5
$161,942
26
$78,452
APPLICATIONS DENIED
3
$123,407
93
$122,994
286
$145,828
86
$58,144
29
$120,220
69
$79,938
APPLICATIONS WITHDRAWN
5
$78,950
57
$153,374
223
$151,086
20
$188,627
16
$131,442
33
$94,547
FILES CLOSED FOR INCOMPLETENESS
0
$0
9
$196,052
56
$176,756
1
$184,640
2
$161,000
3
$110,457
Aggregated Statistics For Year 2004 (Based on 2 full and 4 partial tracts)
A) FHA, FSA/RHS & VA Home Purchase Loans
B) Conventional Home Purchase Loans
C) Refinancings
D) Home Improvement Loans
F) Non-occupant Loans on < 5 Family Dwellings (A B C & D)
G) Loans On Manufactured Home Dwelling (A B C & D)
Number
Average Value
Number
Average Value
Number
Average Value
Number
Average Value
Number
Average Value
Number
Average Value
LOANS ORIGINATED
61
$150,859
397
$146,708
511
$143,499
76
$59,710
50
$126,412
91
$90,050
APPLICATIONS APPROVED, NOT ACCEPTED
7
$131,124
47
$147,391
73
$163,307
14
$37,625
11
$160,940
13
$62,453
APPLICATIONS DENIED
9
$107,442
70
$125,702
269
$132,386
72
$40,341
10
$103,544
64
$73,406
APPLICATIONS WITHDRAWN
14
$127,356
32
$104,122
210
$154,630
15
$68,372
6
$142,522
28
$90,021
FILES CLOSED FOR INCOMPLETENESS
3
$83,853
12
$216,552
34
$177,111
3
$64,190
4
$157,910
5
$103,664
Aggregated Statistics For Year 2003 (Based on 2 full and 4 partial tracts)
A) FHA, FSA/RHS & VA Home Purchase Loans
B) Conventional Home Purchase Loans
C) Refinancings
D) Home Improvement Loans
F) Non-occupant Loans on < 5 Family Dwellings (A B C & D)
Number
Average Value
Number
Average Value
Number
Average Value
Number
Average Value
Number
Average Value
LOANS ORIGINATED
66
$128,316
377
$156,302
1,359
$138,354
41
$22,385
70
$119,173
APPLICATIONS APPROVED, NOT ACCEPTED
3
$80,970
41
$139,370
159
$122,884
9
$36,917
15
$131,445
APPLICATIONS DENIED
6
$110,987
59
$118,200
333
$127,967
56
$33,795
15
$91,755
APPLICATIONS WITHDRAWN
7
$102,884
42
$163,460
219
$139,462
7
$16,999
16
$146,472
FILES CLOSED FOR INCOMPLETENESS
1
$151,430
13
$156,253
43
$147,967
0
$0
0
$0
Aggregated Statistics For Year 1999 (Based on 2 partial tracts)
A) FHA, FSA/RHS & VA Home Purchase Loans
B) Conventional Home Purchase Loans
C) Refinancings
D) Home Improvement Loans
F) Non-occupant Loans on < 5 Family Dwellings (A B C & D)
2002 - 2018 National Fire Incident Reporting System (NFIRS) incidents
Based on the data from the years 2002 - 2018 the average number of fire incidents per year is 44. The highest number of fires - 75 took place in 2011, and the least - 0 in 2003. The data has a growing trend.
When looking into fire subcategories, the most incidents belonged to: Outside Fires (36.8%), and Structure Fires (27.7%).
Fire incident types reported to NFIRS in Zip Code 87059


 Nearest zip codes: 87015, 87008, 87123, 87111, 87112, 87116.


 Based on the data from the years 2002 - 2018 the average number of fire incidents per year is 44. The highest number of fires - 75 took place in 2011, and the least - 0 in 2003. The data has a growing trend.
 When looking into fire subcategories, the most incidents belonged to: Outside Fires (36.8%), and Structure Fires (27.7%).