Estimated zip code population in 2022: 34,532 Zip code population in 2010: 34,188 Zip code population in 2000: 33,373
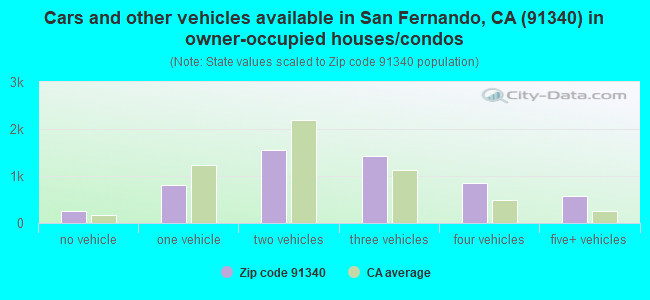
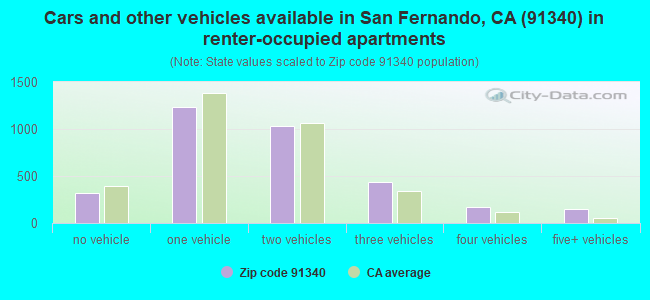
Houses and condos: 9,244 Renter-occupied apartments: 3,341
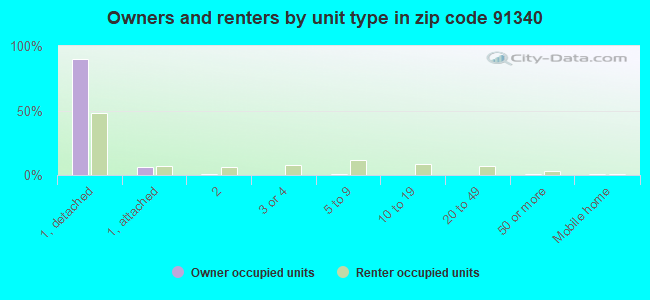
% of renters here:
38%
State:
44%
March 2022 cost of living index in zip code 91340: 135.0 (high, U.S. average is 100)
Land area: 3.4 sq. mi. Water area: 0.0 sq. mi.
Population density: 10,213 people per square mile
(high).
OSM Map
General Map
Google Map
MSN Map
OSM Map
General Map
Google Map
MSN Map
OSM Map
General Map
Google Map
MSN Map
OSM Map
General Map
Google Map
MSN Map
Please wait while loading the map...
Real estate property taxes paid for housing units in 2022:
This zip code:
0.6% ($3,819)
California:
0.7% ($4,831)
Median real estate property taxes paid for housing units with mortgages in 2022: $4,472 (0.7%) Median real estate property taxes paid for housing units with no mortgage in 2022: $2,889 (0.5%)
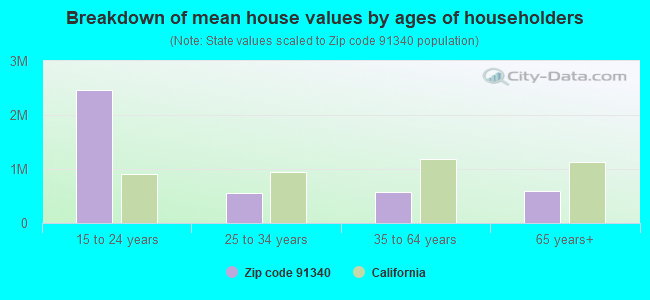
Estimated median house/condo value in 2022: $650,749
91340:
$650,749
California:
$715,900
According to our research of California and other state lists, there were 44 registered sex offenders living in 91340 zip code as of April 27, 2024. The ratio of all residents to sex offenders in zip code 91340 is 823 to 1. The ratio of registered sex offenders to all residents in this zip code is near the state average.
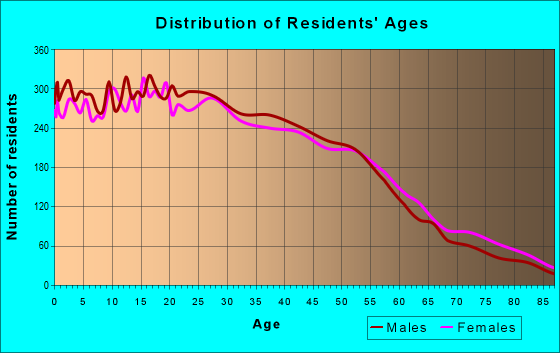
Median resident age:
This zip code:
36.1 years
California median age:
37.9 years
Average household size:
This zip code:
3.9 people
California:
2.8 people
Averages for the 2020 tax year for zip code 91340, filed in 2021:
Average Adjusted Gross Income (AGI) in 2020: $43,426 (Individual Income Tax Returns)
Here:
$43,426
State:
$95,910
Salary/wage: $42,437 (reported on 84.3% of returns)
Here:
$42,437
State:
$77,331
(% of AGI for various income ranges: 1287.7% for AGIs below $25k, 4088.5% for AGIs $25k-50k, 7549.6% for AGIs $50k-75k, 11346.5% for AGIs $75k-100k, 20467.0% for AGIs $100k-200k, 58523.3% for AGIs over 200k)
Taxable interest for individuals: $280 (reported on 19.8% of returns)
This zip code:
$280
California:
$2,294
(% of AGI for various income ranges: 4.5% for AGIs below $25k, 4.8% for AGIs $25k-50k, 10.1% for AGIs $50k-75k, 14.9% for AGIs $75k-100k, 28.7% for AGIs $100k-200k, 226.7% for AGIs over 200k)
Ordinary dividends: $989 (reported on 3.9% of returns)
Here:
$989
State:
$10,949
(% of AGI for various income ranges: 1.7% for AGIs below $25k, 3.4% for AGIs $25k-50k, 7.3% for AGIs $50k-75k, 7.8% for AGIs $75k-100k, 30.0% for AGIs $100k-200k, 206.7% for AGIs over 200k)
Net capital gain/loss in AGI: +$5,162 (reported on 4.6% of returns)
Here:
+$5,162
State:
+$49,306
(% of AGI for various income ranges: 0.9% for AGIs below $25k, 4.4% for AGIs $25k-50k, 9.5% for AGIs $50k-75k, 35.6% for AGIs $75k-100k, 181.5% for AGIs $100k-200k, 7150.0% for AGIs over 200k)
Profit/loss from business: +$8,742 (reported on 18.7% of returns)
Here:
+$8,742
State:
+$15,671
(% of AGI for various income ranges: 326.8% for AGIs below $25k, 172.4% for AGIs $25k-50k, 196.1% for AGIs $50k-75k, 188.5% for AGIs $75k-100k, 365.0% for AGIs $100k-200k)
Taxable individual retirement arrangement distribution: $14,631 (reported on 1.8% of returns)
91340:
$14,631
California:
$23,505
(% of AGI for various income ranges: 11.9% for AGIs below $25k, 17.6% for AGIs $25k-50k, 35.2% for AGIs $50k-75k, 112.3% for AGIs $75k-100k, 246.5% for AGIs $100k-200k)
Total itemized deductions: $27,448 (reported on 9.0% of returns)
Here:
$27,448
State:
$39,517
(% of AGI for various income ranges: 49.8% for AGIs below $25k, 155.0% for AGIs $25k-50k, 539.7% for AGIs $50k-75k, 978.6% for AGIs $75k-100k, 2137.5% for AGIs $100k-200k, 6683.3% for AGIs over 200k)
Charity contributions: $3,907 (reported on 7.2% of returns)
Here:
$3,907
State:
$12,598
(% of AGI for various income ranges: 1.8% for AGIs below $25k, 14.8% for AGIs $25k-50k, 47.6% for AGIs $50k-75k, 113.8% for AGIs $75k-100k, 285.0% for AGIs $100k-200k, 1390.0% for AGIs over 200k)
Taxes paid: $8,328 (reported on 9.0% of returns)
91340:
$8,328
State:
$8,807
(% of AGI for various income ranges: 13.8% for AGIs below $25k, 40.4% for AGIs $25k-50k, 160.2% for AGIs $50k-75k, 322.0% for AGIs $75k-100k, 694.8% for AGIs $100k-200k, 1703.3% for AGIs over 200k)
Earned income credit: $2,189 (reported on 21.5% of returns)
Here:
$2,189
State:
$2,074
(% of AGI for various income ranges: 121.5% for AGIs below $25k, 72.6% for AGIs $25k-50k, 1.4% for AGIs $50k-75k)
Percentage of individuals using paid preparers for their 2020 taxes: 93.4%
Here:
93%
State:
92%
(% for various income ranges: 91.5% for AGIs below $25k, 94.2% for AGIs $25k-50k, 95.0% for AGIs $50k-75k, 94.6% for AGIs $75k-100k, 95.5% for AGIs $100k-200k, 90.0% for AGIs over 200k)
Averages for the 2012 tax year for zip code 91340, filed in 2013:
Average Adjusted Gross Income (AGI) in 2012: $33,824 (Individual Income Tax Returns)
Here:
$33,824
State:
$72,726
Salary/wage: $33,033 (reported on 86.8% of returns)
Here:
$33,033
State:
$59,079
(% of AGI for various income ranges: 76.1% for AGIs below $25k, 89.3% for AGIs $25k-50k, 88.5% for AGIs $50k-75k, 87.2% for AGIs $75k-100k, 85.1% for AGIs $100k-200k, 56.2% for AGIs over 200k)
Taxable interest for individuals: $306 (reported on 18.7% of returns)
This zip code:
$306
California:
$2,146
(% of AGI for various income ranges: 0.1% for AGIs below $25k, 0.1% for AGIs $25k-50k, 0.2% for AGIs $50k-75k, 0.2% for AGIs $75k-100k, 0.2% for AGIs $100k-200k, 0.7% for AGIs over 200k)
Ordinary dividends: $1,610 (reported on 3.4% of returns)
Here:
$1,610
State:
$9,308
(% of AGI for various income ranges: 0.1% for AGIs below $25k, 0.1% for AGIs $50k-75k, 0.2% for AGIs $75k-100k, 0.6% for AGIs $100k-200k)
Net capital gain/loss in AGI: +$2,614 (reported on 2.6% of returns)
Here:
+$2,614
State:
+$30,460
(% of AGI for various income ranges: 1.6% for AGIs $100k-200k)
Profit/loss from business: +$10,626 (reported on 17.2% of returns)
Here:
+$10,626
State:
+$17,064
(% of AGI for various income ranges: 15.2% for AGIs below $25k, 3.7% for AGIs $25k-50k, 1.6% for AGIs $50k-75k, 1.7% for AGIs $75k-100k, 5.4% for AGIs $100k-200k)
Taxable individual retirement arrangement distribution: $11,880 (reported on 2.1% of returns)
91340:
$11,880
California:
$19,557
(% of AGI for various income ranges: 0.4% for AGIs below $25k, 0.6% for AGIs $25k-50k, 0.6% for AGIs $50k-75k, 1.4% for AGIs $75k-100k, 1.7% for AGIs $100k-200k)
Total itemized deductions: $20,079 (32% of AGI, reported on 23.7% of returns)
Here:
$20,079
State:
$34,004
Here:
31.8% of AGI
State:
22.7% of AGI
(% of AGI for various income ranges: 5.4% for AGIs below $25k, 11.9% for AGIs $25k-50k, 18.6% for AGIs $50k-75k, 19.8% for AGIs $75k-100k, 19.3% for AGIs $100k-200k, 19.1% for AGIs over 200k)
Charity contributions: $1,928 (reported on 18.2% of returns)
Here:
$1,928
State:
$4,659
(% of AGI for various income ranges: 0.2% for AGIs below $25k, 0.8% for AGIs $25k-50k, 1.4% for AGIs $50k-75k, 1.4% for AGIs $75k-100k, 1.8% for AGIs $100k-200k, 1.3% for AGIs over 200k)
Taxes paid: $5,899 (reported on 23.7% of returns)
91340:
$5,899
State:
$14,448
(% of AGI for various income ranges: 1.2% for AGIs below $25k, 2.9% for AGIs $25k-50k, 5.2% for AGIs $50k-75k, 6.1% for AGIs $75k-100k, 7.1% for AGIs $100k-200k, 10.0% for AGIs over 200k)
Earned income credit: $2,467 (reported on 30.2% of returns)
Here:
$2,467
State:
$2,286
(% of AGI for various income ranges: 8.2% for AGIs below $25k, 1.7% for AGIs $25k-50k)
Percentage of individuals using paid preparers for their 2012 taxes: 82.4%
Here:
82%
State:
64%
(% for various income ranges: 80.8% for AGIs below $25k, 83.4% for AGIs $25k-50k, 85.1% for AGIs $50k-75k, 84.8% for AGIs $75k-100k, 82.2% for AGIs $100k-200k, 100.0% for AGIs over 200k)
Averages for the 2004 tax year for zip code 91340, filed in 2005:
Average Adjusted Gross Income (AGI) in 2004: $30,061 (Individual Income Tax Returns)
Here:
$30,061
State:
$58,600
Salary/wage: $29,393 (reported on 90.0% of returns)
Here:
$29,393
State:
$49,455
(% of AGI for various income ranges: 81.4% for AGIs below $10k, 85.6% for AGIs $10k-25k, 92.4% for AGIs $25k-50k, 91.4% for AGIs $50k-75k, 92.4% for AGIs $75k-100k, 67.7% for AGIs over 100k)
Taxable interest for individuals: $562 (reported on 24.8% of returns)
This zip code:
$562
California:
$2,365
(% of AGI for various income ranges: 1.0% for AGIs below $10k, 0.4% for AGIs $10k-25k, 0.3% for AGIs $25k-50k, 0.7% for AGIs $50k-75k, 0.2% for AGIs $75k-100k, 0.8% for AGIs over 100k)
Taxable dividends: $1,080 (reported on 4.9% of returns)
Here:
$1,080
State:
$4,746
(% of AGI for various income ranges: 0.8% for AGIs below $10k, 0.1% for AGIs $10k-25k, 0.1% for AGIs $25k-50k, 0.2% for AGIs $50k-75k, 0.1% for AGIs $75k-100k, 0.6% for AGIs over 100k)
Net capital gain/loss: +$7,829 (reported on 3.5% of returns)
Here:
+$7,829
State:
+$23,418
(% of AGI for various income ranges: -0.6% for AGIs below $10k, 0.0% for AGIs $10k-25k, -0.1% for AGIs $25k-50k, 0.1% for AGIs $50k-75k, -0.1% for AGIs $75k-100k, 9.6% for AGIs over 100k)
Profit/loss from business: +$9,810 (reported on 13.2% of returns)
Here:
+$9,810
State:
+$16,826
(% of AGI for various income ranges: 16.2% for AGIs below $10k, 8.1% for AGIs $10k-25k, 2.6% for AGIs $25k-50k, 1.6% for AGIs $50k-75k, 1.6% for AGIs $75k-100k, 7.1% for AGIs over 100k)
IRA payment deduction: $2,398 (reported on 1.0% of returns)
91340:
$2,398
California:
$3,192
(% of AGI for various income ranges: 0.1% for AGIs $10k-25k, 0.1% for AGIs $25k-50k, 0.1% for AGIs $50k-75k, 0.1% for AGIs $75k-100k, 0.2% for AGIs over 100k)
Total itemized deductions: $18,231 (34% of AGI, reported on 26.8% of returns)
Here:
$18,231
State:
$28,113
Here:
34.2% of AGI
State:
25.3% of AGI
(% of AGI for various income ranges: 8.9% for AGIs below $10k, 8.5% for AGIs $10k-25k, 16.2% for AGIs $25k-50k, 21.4% for AGIs $50k-75k, 22.5% for AGIs $75k-100k, 18.9% for AGIs over 100k)
Charity contributions deductions: $1,857 (3% of AGI, reported on 22.1% of returns)
Here:
$1,857
State:
$3,923
Here:
3.3% of AGI
State:
3.3% of AGI
(% of AGI for various income ranges: 0.2% for AGIs below $10k, 0.5% for AGIs $10k-25k, 1.2% for AGIs $25k-50k, 2.1% for AGIs $50k-75k, 2.1% for AGIs $75k-100k, 2.1% for AGIs over 100k)
Total tax: $2,913 (reported on 61.8% of returns)
91340:
$2,913
State:
$10,761
(% of AGI for various income ranges: 3.6% for AGIs below $10k, 3.2% for AGIs $10k-25k, 4.5% for AGIs $25k-50k, 6.3% for AGIs $50k-75k, 8.2% for AGIs $75k-100k, 15.6% for AGIs over 100k)
Earned income credit: $1,989 (reported on 29.7% of returns)
Here:
$1,989
State:
$1,763
Percentage of individuals using paid preparers for their 2004 taxes: 84.6%
Here:
85%
State:
66%
(% for various income ranges: 78.0% for AGIs below $10k, 86.2% for AGIs $10k-25k, 86.3% for AGIs $25k-50k, 84.1% for AGIs $50k-75k, 83.8% for AGIs $75k-100k, 86.0% for AGIs over 100k)
Likely homosexual households (counted as self-reported same-sex unmarried-partner households)
Lesbian couples: 0.1% of all households
Gay men: 0.0% of all households
Household received Food Stamps/SNAP in the past 12 months: 1,559 Household did not receive Food Stamps/SNAP in the past 12 months: 7,370
Women who had a birth in the past 12 months: 492 (308 now married, 185 unmarried) Women who did not have a birth in the past 12 months: 8,122 (2,627 now married, 5,519 unmarried)
Housing units in zip code 91340 with a mortgage: 3,722 (312 second mortgage, 276 both second mortgage and home equity loan) Houses without a mortgage: 223
Median monthly owner costs for units with a mortgage: $2,499 Median monthly owner costs for units without a mortgage: $614
Residents with income below the poverty level in 2022:
This zip code:
11.7%
Whole state:
12.2%
Residents with income below 50% of the poverty level in 2022:
This zip code:
7.1%
Whole state:
6.2%
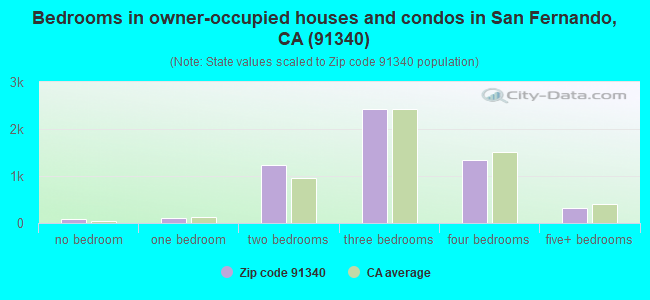
Median number of rooms in houses and condos:
Here:
5.8
State:
6.0
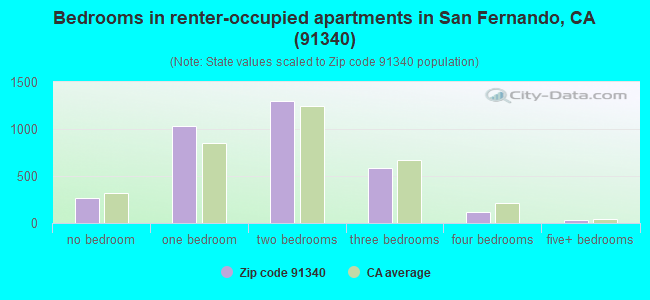
Median number of rooms in apartments:
Here:
4.1
State:
3.9
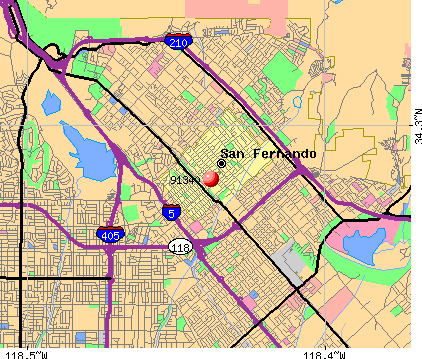
Notable locations in this zip code not listed on our city pages
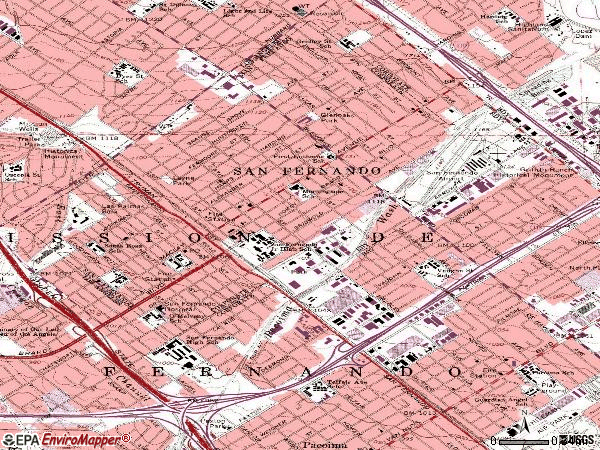
Notable locations in zip code 91340: San Fernando City Hall (A), San Fernando Branch County of Los Angeles Public Library (B), Mauran Ambulance Service (C). Display/hide their locations on the map
Churches in zip code 91340 include: Apostolic Assembly Church (A), Calvary United Pentecostal Church (B), Church of Christ (C), Church of the Nazarene (D), First Baptist Church (E), First Lutheran Church (F), First United Methodist Church (G), La Trinidad Church (H), Liberty Missionary Baptist Church (I). Display/hide their locations on the map
3,820 married couples with children.
1,690 single-parent households (668 men, 1,022 women).
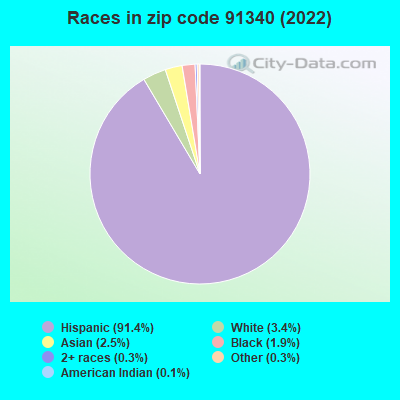
24.0% of residents of 91340 zip code speak English at home.
73.5% of residents speak Spanish at home (61% very well, 17% well, 15% not well, 7% not at all).
0.4% of residents speak other Indo-European language at home (73% very well, 11% well, 16% not well).
2.1% of residents speak Asian or Pacific Island language at home (71% very well, 24% well, 5% not at all).
0.2% of residents speak other language at home (81% very well, 19% not well).
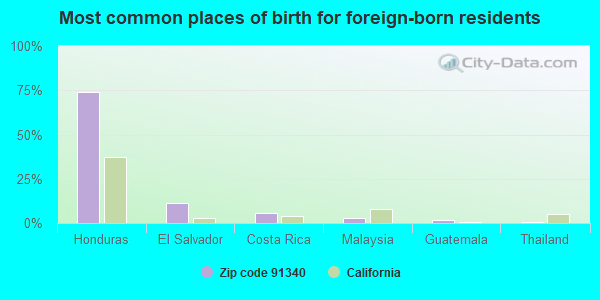
Foreign born population: 12,822 (37.1%) (50.1% of them are naturalized citizens)
This zip code:
37.1%
Whole state:
26.7%
74%Honduras
11%El Salvador
6%Costa Rica
3%Malaysia
2%Guatemala
1%Thailand
0%Brazil
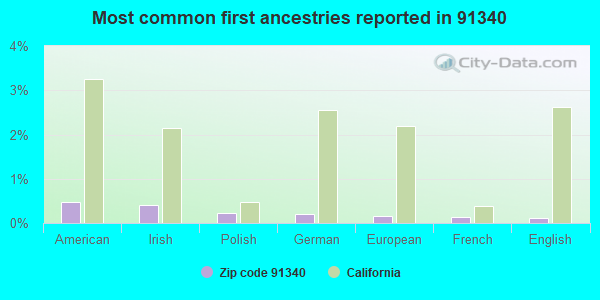
0%American
0%Irish
0%Polish
0%German
0%European
0%French
0%English
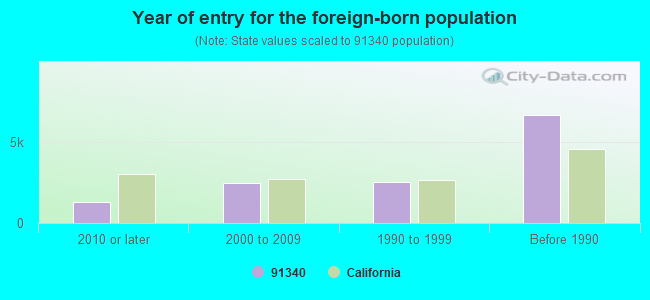
Year of entry for the foreign-born population
1,3202010 or later
2,4842000 to 2009
2,5321990 to 1999
6,660Before 1990
Major facilities with environmental interests located in this zip code:
FIRESTONE STORE #2780 (104 S MACLAY in SAN FERNANDO, CA)
STATE MASTER (California - Hazardous Waste Tracking) - HAZARDOU WASTE PROGRAM Small Quantity Generators, between 100 kg and 1000 kg of hazardous waste/month (Resource Conservation and Recovery Act (tracking hazardous waste)) - notification STATE MASTER (California - Used Oil Recycling System ) - USED OIL RECYCLING Organizations: FIRESTONE TIRE CO (CONTACT/OWNER)
Alternative names: FIRESTONE STORE #67T5
LAUSD SAN FERNANDO JUNIOR HIGH (130 NORTH BRAND BOULEVARD in SAN FERNANDO, CA)
STATE MASTER (California - Hazardous Waste Tracking) - HAZARDOU WASTE PROGRAM HAZARDOUS WASTE BIENNIAL REPORTER (Resource Conservation and Recovery Act (tracking hazardous waste)) Large Quantity Generators, more that 1000 kg of hazardous waste/month (Resource Conservation and Recovery Act (tracking hazardous waste)) Large Quantity Generators, more that 1000 kg of hazardous waste/month (Resource Conservation and Recovery Act (tracking hazardous waste)) - notification Organizations: LOS ANGELES UNFIED SCHOOL DI (CONTACT/OWNER)
Alternative names: SAN FERNANDO MIDDLE SCHOOL
CALIFORNIA TECHNICAL PLATING INCORPORATED (11533 BRADLEY in SAN FERNANDO, CA)
STATE MASTER (California - Hazardous Waste Tracking) - HAZARDOU WASTE PROGRAM CRITERIA AND HAZARDOUS AIR POLLUTANT INVENTORY (Inventory of air pollution sources) HAZARDOUS WASTE BIENNIAL REPORTER (Resource Conservation and Recovery Act (tracking hazardous waste)) Large Quantity Generators, more that 1000 kg of hazardous waste/month (Resource Conservation and Recovery Act (tracking hazardous waste)) TRI REPORTER (Tracking of toxic chemicals releasing facilities) Business SIC and NAICS classification: ELECTROPLATING, PLATING, POLISHING, ANODIZING, AND COLORING Organizations: DAVID ANZURES JR (CONTACT/OPERATOR)
, DAVID ANZURES SR (CONTACT/OWNER)
EQUILON ENTERPRISES (13641 FOOTHILL in SAN FERNANDO, CA) . Federal Facility
STATE MASTER (California - Hazardous Waste Tracking) - HAZARDOU WASTE PROGRAM Large Quantity Generators, more that 1000 kg of hazardous waste/month (Resource Conservation and Recovery Act (tracking hazardous waste)) Organizations: SHELL OIL PRODUCTS US (CONTACT/OPERATOR)
, EQUILON ENTERPRISES LLC DBA SHELL OIL PR (CONTACT/OWNER)
Alternative names: SHELL OIL CO
ACCUTECH PHOTO MACHINING (1724 FIRST ST. in SAN FERNANDO, CA)
STATE MASTER (California - Hazardous Waste Tracking) - HAZARDOU WASTE PROGRAM HAZARDOUS WASTE BIENNIAL REPORTER (Resource Conservation and Recovery Act (tracking hazardous waste)) Large Quantity Generators, more that 1000 kg of hazardous waste/month (Resource Conservation and Recovery Act (tracking hazardous waste)) Business NAICS classification: JEWELRY (EXCEPT COSTUME) MANUFACTURING.; SILVERWARE AND HOLLOWWARE MANUFACTURING. Alternative names: ACCUTECH PHOTOMACHINING INC
FLEX LINK PRODUCTS INCORPORATED (599 FOURTH ST. in SAN FERNANDO, CA)
STATE MASTER (California - Hazardous Waste Tracking) - HAZARDOU WASTE PROGRAM HAZARDOUS WASTE BIENNIAL REPORTER (Resource Conservation and Recovery Act (tracking hazardous waste)) Large Quantity Generators, more that 1000 kg of hazardous waste/month (Resource Conservation and Recovery Act (tracking hazardous waste)) Business NAICS classification: BARE PRINTED CIRCUIT BOARD MANUFACTURING.
KELLEY FLEET SERVICES (1200 ARROYO AVENUE in SAN FERNANDO, CA)
STATE MASTER (California - Hazardous Waste Tracking) - HAZARDOU WASTE PROGRAM Small Quantity Generators, between 100 kg and 1000 kg of hazardous waste/month (Resource Conservation and Recovery Act (tracking hazardous waste)) - notification Alternative names: RYDER TRUCK RENTAL
M TRON MFG (625 ARROYO ST in SAN FERNANDO, CA)
STATE MASTER (California - Hazardous Waste Tracking) - HAZARDOU WASTE PROGRAM Small Quantity Generators, between 100 kg and 1000 kg of hazardous waste/month (Resource Conservation and Recovery Act (tracking hazardous waste)) - notification Business NAICS classification: OTHER COMMERCIAL AND SERVICE INDUSTRY MACHINERY MANUFACTURING. Organizations: RICHARD A BELANGER, JOHN J COLEMAN (CONTACT/OWNER)
LOS ANGELES USD SAN FERNANDO HIGH SCHOOL (11133 OMELVENY AVE in SAN FERNANDO, CA)
STATE MASTER (California - Hazardous Waste Tracking) - HAZARDOU WASTE PROGRAM Small Quantity Generators, between 100 kg and 1000 kg of hazardous waste/month (Resource Conservation and Recovery Act (tracking hazardous waste)) - notification Organizations: LOS ANGELES UNIFIED SCHOOL DISTRICT (CONTACT/OWNER)
Alternative names: LAUSD/ SAN FERNANDO HIGH SCHOOL
CHEVRON STATION NO 95571 (11221 LAUREL CANYON BLVD in SAN FERNANDO, CA)
STATE MASTER (California - Hazardous Waste Tracking) - HAZARDOU WASTE PROGRAM Small Quantity Generators, between 100 kg and 1000 kg of hazardous waste/month (Resource Conservation and Recovery Act (tracking hazardous waste)) - notification Organizations: CHEVRON PRODUCTS CO (CONTACT/OWNER)
Alternative names: CHEVRON STATION #95571
CHEVRON STATION NO 92014 (1100 TRUMAN ST in SAN FERNANDO, CA)
STATE MASTER (California - Hazardous Waste Tracking) - HAZARDOU WASTE PROGRAM Small Quantity Generators, between 100 kg and 1000 kg of hazardous waste/month (Resource Conservation and Recovery Act (tracking hazardous waste)) - notification Organizations: CHEVRON PRODUCTS CO (CONTACT/OWNER)
MURPHY AND SHELBY DODGE (603 SAN FERNANDO RD in SAN FERNANDO, CA)
STATE MASTER (California - Hazardous Waste Tracking) - HAZARDOU WASTE PROGRAM Small Quantity Generators, between 100 kg and 1000 kg of hazardous waste/month (Resource Conservation and Recovery Act (tracking hazardous waste)) - notification Organizations: BILL MURPHY JR (CONTACT/OWNER)
EQUILON ENTERPRISES (11278 LAUREL CANYON/BRAND in SAN FERNANDO, CA) . Federal Facility
STATE MASTER (California - Hazardous Waste Tracking) - HAZARDOU WASTE PROGRAM Small Quantity Generators, between 100 kg and 1000 kg of hazardous waste/month (Resource Conservation and Recovery Act (tracking hazardous waste)) - notification Organizations: EQUILON ENTERPRISES, LLC (CONTACT/OWNER)
Alternative names: SHELL OIL CO
Housing units lacking complete plumbing facilities: 0.7% Housing units lacking complete kitchen facilities: 1.6%
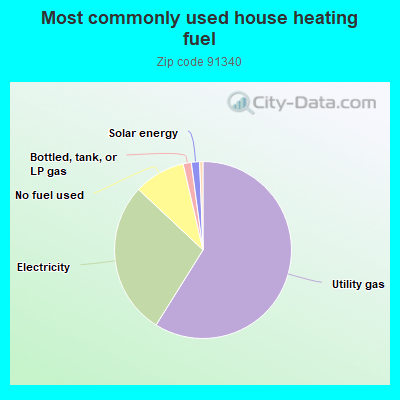
58.9%Utility gas
28.1%Electricity
9.4%No fuel used
1.5%Bottled, tank, or LP gas
1.5%Solar energy
Population in 1990: 33,379.
Place of birth for U.S.-born residents:
This state: 20,129
Northeast: 238
Midwest: 208
South: 410
West: 354
58% of the 91340 zip code residents lived in the same house 5 years ago. Out of people who lived in different houses, 94% lived in this county. Out of people who lived in different counties, 50% lived in California.
94% of the 91340 zip code residents lived in the same house 1 year ago. Out of people who lived in different houses, 82% moved from this county. Out of people who lived in different houses, 13% moved from different county within same state. Out of people who lived in different houses, 5% moved from different state. Out of people who lived in different houses, 0% moved from abroad.
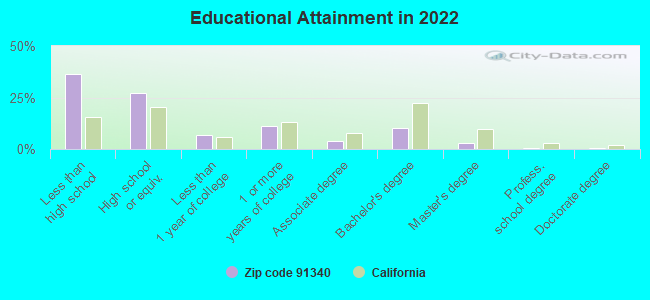
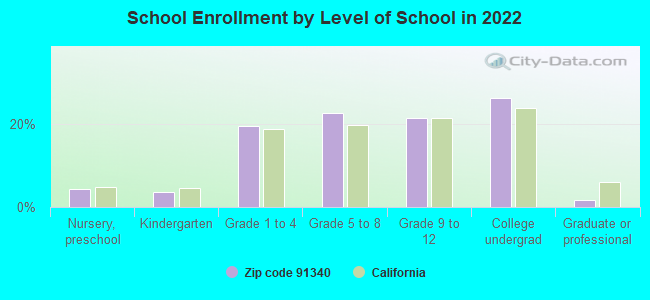
Private vs. public school enrollment:
Students in private schools in grades 1 to 8 (elementary and middle school): 317
Here:
8.6%
California:
10.5%
Students in private schools in grades 9 to 12 (high school): 130
Here:
6.9%
California:
8.5%
Students in private undergraduate colleges: 220
Here:
9.6%
California:
15.9%
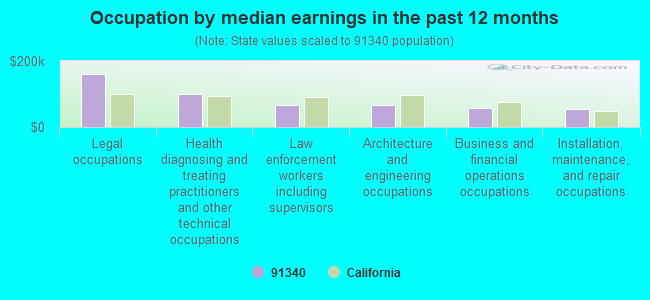
Occupation by median earnings in the past 12 months ($)
159,470Legal occupations
100,547Health diagnosing and treating practitioners and other technical occupations
67,210Law enforcement workers including supervisors
65,844Architecture and engineering occupations
59,013Business and financial operations occupations
54,020Installation, maintenance, and repair occupations
Companies with biggest federal contracts located in this zip code (SAN FERNANDO, CA):
FRAZIER AVIATION INC (445 NO FOX STREET; small business) : $2,915,289 in 95 contractsfrom 2000 to 2006
Contracts for Hose, Pipe, Tube, Lubrication, and Railing Fittings, Airframe Structural Components, Aircraft Landing Gear Components, Parachutes; Aerial Pick Up, Delivery, Recovery Systems; and Cargo Tie Down Equipment, and moreby Defense Logistics Agency, Navy, Air Force, U.S. Coast Guard, and others Signed by year:2000: $607,059; 2001: $303,300; 2002: $425,697; 2003: $125,293; 2004: $554,460; 2005: $628,858; 2006: $270,622.
Biggest contracts:
$312,503 with Defense Logistics Agency for Hose, Pipe, Tube, Lubrication, and Railing Fittings. Signed on 2002-06-26. Completion date: 2002-11-29.
$236,541 with Defense Logistics Agency for Airframe Structural Components. Signed on 2000-07-31. Completion date: 2001-01-27.
$112,173, same as above.Signed on 2005-07-08. Completion date: 2006-03-25.
$112,100, same as above.Signed on 2001-06-29. Completion date: 2002-01-30.
W MACHINE WORKS (13814 DEL SUR STREET; small business) : $2,573,096 in 88 contractsfrom 2000 to 2006
Contracts for Guns, through 30 mm, Torque Converters and Speed Changers, Hardware, Commercial, Coil, Flat, Leaf, and Wire Springs, and moreby Army, Defense Logistics Agency Signed by year:2000: $35,066; 2001: $86,985; 2002: $292,162; 2003: $328,707; 2004: $925,411; 2005: $485,750; 2006: $419,015.
Biggest contracts:
$239,575 with Army for Guns, through 30 mm. Signed on 2004-01-28. Completion date: 2004-06-18.
$118,575, same as above.Signed on 2006-01-30. Completion date: 2006-08-16.
$98,010 with Army for Torque Converters and Speed Changers. Signed on 2006-01-24. Completion date: 2006-04-20.
$97,150 with Army for Hardware, Commercial. Signed on 2002-11-12. Completion date: 2003-05-30.
SOLTEC CORP (12977 ARROYO ST; small business) : $1,661,134 in 39 contractsfrom 2000 to 2006
Contracts for Miscellaneous Communication Equipment, Electrical and Electronic Properties Measuring and Testing Instruments, Stimulated Coherent Radiation Devices, Components and Accessories, Nuclear Reactors, and moreby Navy, U.S. Army Corps of Engineers - civil program financing only, U.S. Secret Service, Army, and others Signed by year:2000: $300,933; 2001: $105,835; 2002: $67,514; 2003: $716,934; 2004: $211,035; 2005: $206,410; 2006: $52,473.
Biggest contracts:
$637,602 with Navy for Miscellaneous Communication Equipment. Signed on 2003-01-02. Completion date: 2003-06-02.
$238,875, same as above.Signed on 2000-02-23. Completion date: 2000-04-24.
$62,391, same as above.Signed on 2005-08-01. Completion date: 2006-01-30.
$60,571, same as above.Signed on 2004-03-10. Completion date: 2004-08-10.
TECHNICAL HEATERS INC (710 JESSIE ST; small business) : $572,793 in 5 contractsfrom 2000 to 2003
Contracts for Waste Disposal Equipment, Aircraft Air Conditioning, Heating, and Pressurizing Equipment, Airframe Structural Components, Pipe, Tube and Rigid Tubing by Army, Defense Logistics Agency, Air Force Signed by year:2000: $69,260; 2001: $384,740; 2002: $27,257; 2003: $91,536; 2004: $0; 2005: $0; 2006: $0.
Biggest contracts:
$384,740 with Army for Waste Disposal Equipment. Signed on 2001-06-11. Completion date: 2001-09-10.
$91,536, same as above.Signed on 2003-07-25. Completion date: 2003-10-15.
$40,240 with Defense Logistics Agency for Aircraft Air Conditioning, Heating, and Pressurizing Equipment. Signed on 2000-05-19. Completion date: 2000-11-17.
$29,020 with Air Force for Airframe Structural Components. Signed on 2000-04-19. Completion date: 2000-04-18.
BEE GEE INC. (1301 8TH ST.; small business) : $235,148 in 6 contractsin 2000
Contracts for Lease or Rental of Equipment -- Ground Effect Vehicles, Motor Vehicles, Trailers, and Cycles, Passenger Motor Vehicles, Tractors, Wheeled, Maintenance, Repair or Alteration of Real Property -- Troop Housing Facilities, and moreby Army, Navy Signed by year:2000: $235,148; 2001: $0; 2002: $0; 2003: $0; 2004: $0; 2005: $0; 2006: $0.
Biggest contracts:
$131,070 with Army for Lease or Rental of Equipment -- Ground Effect Vehicles, Motor Vehicles, Trailers, and Cycles. Signed on 2000-06-02. Completion date: 2000-08-17.
$111,385 with Army for Passenger Motor Vehicles. Signed on 2000-06-07. Completion date: 2000-08-06.
$37,500 with Navy for Tractors, Wheeled. Signed on 2000-02-25. Completion date: 2000-04-01.
$14,345 with Navy for Maintenance, Repair or Alteration of Real Property -- Troop Housing Facilities. Signed on 2000-09-05. Completion date: 2000-11-30.
M-TRON MFG INC (625 ARROYO AVE; small business) : $165,957 in 2 contractsfrom 2005 to 2006
$162,589 with Army for Miscellaneous Power Transmission Equipment. Signed on 2006-01-13. Completion date: 2011-06-30.
$3,368 with Defense Logistics Agency for Miscellaneous Aircraft Accessories and Components. Signed on 2005-12-12. Completion date: 2006-04-11.
VIBRATION ISOLATION PRODUCTS C (11275 SAN FERNANDO RD; small business) : $144,825 in 4 contractsfrom 2000 to 2005
$51,431 with Defense Logistics Agency for Hardware, Weapon System. Signed on 2000-09-29. Completion date: 2000-12-28.
$46,000, same as above.Signed on 2000-04-18. Completion date: 2000-07-17.
$33,894, same as above.Signed on 2000-04-04. Completion date: 2000-06-03.
$13,500 with Navy for Valves, Nonpowered. Signed on 2005-08-15. Completion date: 2005-11-15.
PICO MACOM INC (355 PARKSIDE DR; small business) : $96,642 in 9 contractsfrom 2003 to 2006
Contracts for Converters, Electrical, Nonrotating, Radio and Television Communication Equipment, Except Airborne, Filters and Networks, Switches by Department of Veterans Affairs, American Forces Information Service, Department of Defense Signed by year:2000: $0; 2001: $0; 2002: $0; 2003: $2,181; 2004: $0; 2005: $17,029; 2006: $77,432.
Biggest contracts:
$38,716 with Department of Veterans Affairs for Converters, Electrical, Nonrotating. Taking place in TX. Signed on 2006-09-19. Completion date: 2006-10-31.
$38,716 with Department of Veterans Affairs for Radio and Television Communication Equipment, Except Airborne. Taking place in TX. Signed on 2006-09-15. Completion date: 2006-10-31.
$11,185 with American Forces Information Service for Radio and Television Communication Equipment, Except Airborne. Signed on 2005-01-10. Completion date: 2005-02-09.
$5,702, same as above.Signed on 2005-06-24. Completion date: 2005-02-09.
JRL ELECTRIC SUPPLY (628 CELIS ST; small business) : $69,362 in 9 contractsfrom 2004 to 2005
Contracts for Circuit Breakers, Connectors, Electrical by Defense Logistics Agency, Army Signed by year:2000: $0; 2001: $0; 2002: $0; 2003: $0; 2004: $44,346; 2005: $25,016; 2006: $0.
Biggest contracts:
$12,508 with Defense Logistics Agency for Circuit Breakers. Signed on 2005-01-19. Completion date: 2005-05-17.
$12,508, same as above.Signed on 2005-01-19. Completion date: 2005-05-17.
$8,550, same as above.Signed on 2004-12-23. Completion date: 2005-04-22.
$8,550, same as above.Signed on 2004-12-23. Completion date: 2005-04-22.
CANARE CORPORATION OF AMERICA, (531 5TH ST # A; small business) : $56,684 in 9 contractsfrom 2002 to 2005
Contracts for Radio and Television Communication Equipment, Except Airborne, Connectors, Electrical, Fiber Optic Cable Assemblies and Harnesses, Fiber Optic Cables, and moreby Department of Defense, Navy, Air Force, Army, and others Signed by year:2000: $0; 2001: $0; 2002: $18,525; 2003: $3,313; 2004: $25,842; 2005: $9,004; 2006: $0.
Biggest contracts:
$14,721 with Department of Defense for Radio and Television Communication Equipment, Except Airborne. Signed on 2002-09-25. Completion date: 2002-10-10.
$10,131 with Navy for Connectors, Electrical. Signed on 2004-06-15. Completion date: 2004-07-08.
$9,004 with Air Force for Fiber Optic Cable Assemblies and Harnesses. Signed on 2005-05-17. Completion date: 2005-05-27.
$7,664 with Air Force for Fiber Optic Cables. Signed on 2004-06-01. Completion date: 2004-07-01.
Top industries in this zip code by the number of employees in 2005:
2005 - 2018 National Fire Incident Reporting System (NFIRS) incidents
According to the data from the years 2005 - 2018 the average number of fires per year is 50. The highest number of fires - 86 took place in 2007, and the least - 16 in 2018. The data has a dropping trend.
When looking into fire subcategories, the most reports belonged to: Mobile Property/Vehicle Fires (40.5%), and Structure Fires (30.2%).
Fire incident types reported to NFIRS in Zip Code 91340
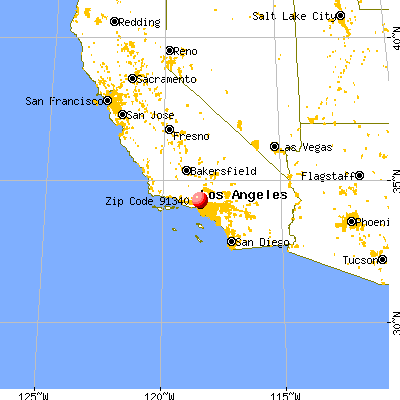


 Nearest zip codes: 91345, 91331, 91402, 91342, 91343, 91344.
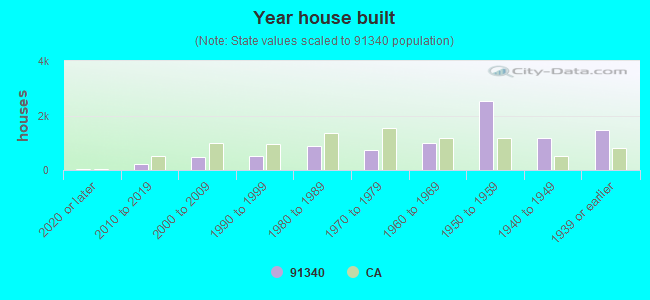


 According to the data from the years 2005 - 2018 the average number of fires per year is 50. The highest number of fires - 86 took place in 2007, and the least - 16 in 2018. The data has a dropping trend.
 When looking into fire subcategories, the most reports belonged to: Mobile Property/Vehicle Fires (40.5%), and Structure Fires (30.2%).