Estimated zip code population in 2022: 91,811 Zip code population in 2010: 91,725 Zip code population in 2000: 81,970
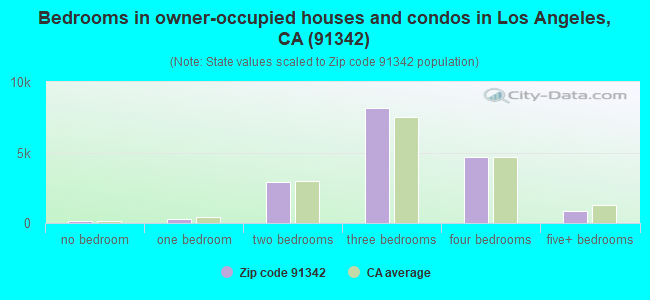
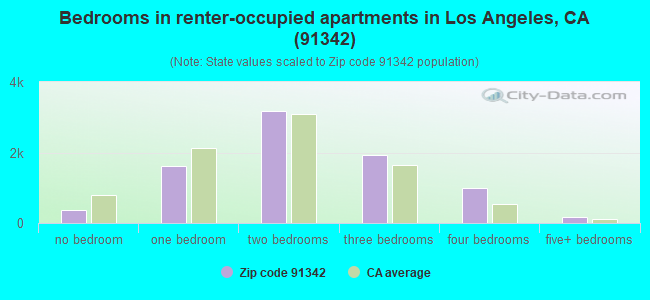
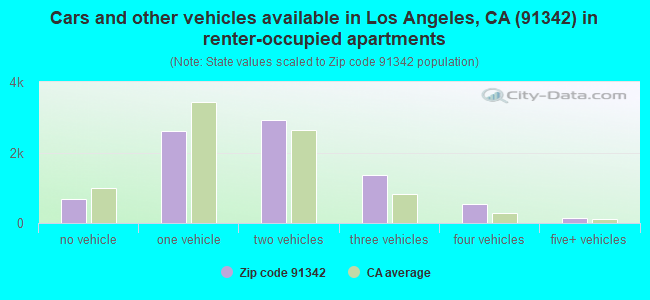
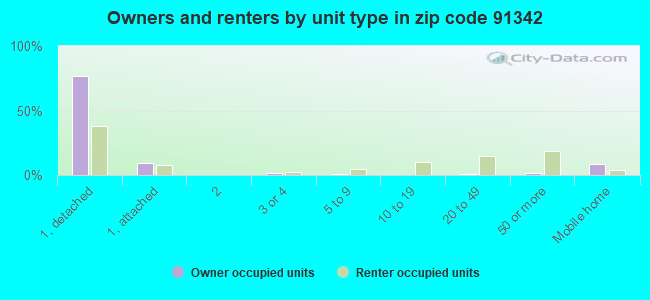
Houses and condos: 26,589 Renter-occupied apartments: 8,309
% of renters here:
33%
State:
44%
March 2022 cost of living index in zip code 91342: 132.8 (high, U.S. average is 100)
Land area: 55.1 sq. mi. Water area: 0.3 sq. mi.
Population density: 1,666 people per square mile
(low).
OSM Map
General Map
Google Map
MSN Map
OSM Map
General Map
Google Map
MSN Map
OSM Map
General Map
Google Map
MSN Map
OSM Map
General Map
Google Map
MSN Map
Please wait while loading the map...
Real estate property taxes paid for housing units in 2022:
This zip code:
0.6% ($3,926)
California:
0.7% ($4,831)
Median real estate property taxes paid for housing units with mortgages in 2022: $4,518 (0.7%) Median real estate property taxes paid for housing units with no mortgage in 2022: $2,592 (0.4%)
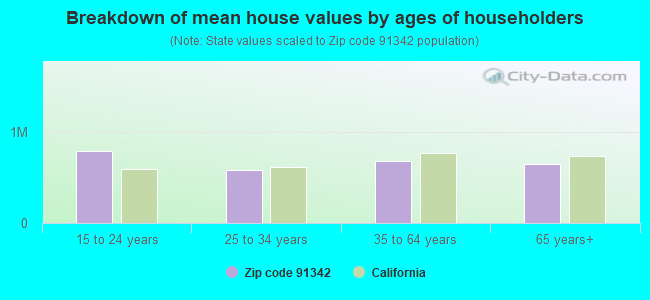
Estimated median house/condo value in 2022: $657,916
91342:
$657,916
California:
$715,900
According to our research of California and other state lists, there were 97 registered sex offenders living in 91342 zip code as of April 27, 2024. The ratio of all residents to sex offenders in zip code 91342 is 996 to 1. The ratio of registered sex offenders to all residents in this zip code is lower than the state average.
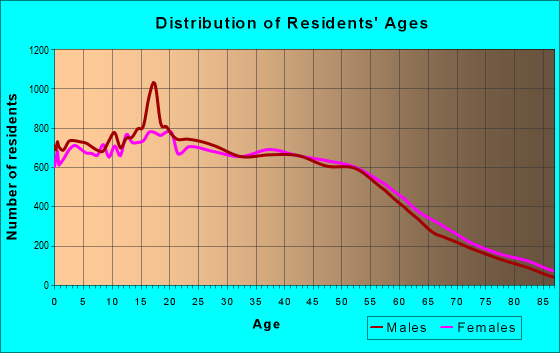
Median resident age:
This zip code:
37.5 years
California median age:
37.9 years
Average household size:
This zip code:
3.6 people
California:
2.8 people
Averages for the 2020 tax year for zip code 91342, filed in 2021:
Average Adjusted Gross Income (AGI) in 2020: $51,999 (Individual Income Tax Returns)
Here:
$51,999
State:
$95,910
Salary/wage: $50,193 (reported on 82.7% of returns)
Here:
$50,193
State:
$77,331
(% of AGI for various income ranges: 1207.9% for AGIs below $25k, 3993.9% for AGIs $25k-50k, 7552.7% for AGIs $50k-75k, 11280.5% for AGIs $75k-100k, 21079.5% for AGIs $100k-200k, 63426.0% for AGIs over 200k)
Taxable interest for individuals: $465 (reported on 25.8% of returns)
This zip code:
$465
California:
$2,294
(% of AGI for various income ranges: 6.8% for AGIs below $25k, 7.2% for AGIs $25k-50k, 18.5% for AGIs $50k-75k, 29.7% for AGIs $75k-100k, 51.2% for AGIs $100k-200k, 426.8% for AGIs over 200k)
Ordinary dividends: $2,090 (reported on 7.3% of returns)
Here:
$2,090
State:
$10,949
(% of AGI for various income ranges: 5.6% for AGIs below $25k, 7.6% for AGIs $25k-50k, 17.9% for AGIs $50k-75k, 37.4% for AGIs $75k-100k, 78.8% for AGIs $100k-200k, 678.4% for AGIs over 200k)
Net capital gain/loss in AGI: +$7,124 (reported on 8.0% of returns)
Here:
+$7,124
State:
+$49,306
(% of AGI for various income ranges: 2.7% for AGIs below $25k, 6.4% for AGIs $25k-50k, 28.4% for AGIs $50k-75k, 69.4% for AGIs $75k-100k, 283.7% for AGIs $100k-200k, 5779.6% for AGIs over 200k)
Profit/loss from business: +$9,568 (reported on 20.2% of returns)
Here:
+$9,568
State:
+$15,671
(% of AGI for various income ranges: 303.5% for AGIs below $25k, 218.7% for AGIs $25k-50k, 228.8% for AGIs $50k-75k, 284.4% for AGIs $75k-100k, 457.4% for AGIs $100k-200k, 2106.4% for AGIs over 200k)
Taxable individual retirement arrangement distribution: $14,823 (reported on 3.0% of returns)
91342:
$14,823
California:
$23,505
(% of AGI for various income ranges: 21.7% for AGIs below $25k, 28.8% for AGIs $25k-50k, 70.5% for AGIs $50k-75k, 118.0% for AGIs $75k-100k, 232.8% for AGIs $100k-200k, 914.4% for AGIs over 200k)
Self-employed (Keogh) retirement plans: $16,020 (reported on 0.1% of returns)
91342:
$16,020
California:
$30,163
(% of AGI for various income ranges: 1.8% for AGIs below $25k, 22.5% for AGIs $100k-200k)
Total itemized deductions: $30,361 (reported on 13.9% of returns)
Here:
$30,361
State:
$39,517
(% of AGI for various income ranges: 64.9% for AGIs below $25k, 198.2% for AGIs $25k-50k, 705.3% for AGIs $50k-75k, 1344.6% for AGIs $75k-100k, 2611.2% for AGIs $100k-200k, 11026.0% for AGIs over 200k)
Charity contributions: $4,665 (reported on 11.1% of returns)
Here:
$4,665
State:
$12,598
(% of AGI for various income ranges: 2.6% for AGIs below $25k, 16.6% for AGIs $25k-50k, 76.1% for AGIs $50k-75k, 136.4% for AGIs $75k-100k, 376.4% for AGIs $100k-200k, 1818.4% for AGIs over 200k)
Taxes paid: $8,563 (reported on 13.8% of returns)
91342:
$8,563
State:
$8,807
(% of AGI for various income ranges: 15.6% for AGIs below $25k, 50.9% for AGIs $25k-50k, 200.4% for AGIs $50k-75k, 422.9% for AGIs $75k-100k, 815.8% for AGIs $100k-200k, 1962.0% for AGIs over 200k)
Earned income credit: $2,120 (reported on 18.5% of returns)
Here:
$2,120
State:
$2,074
(% of AGI for various income ranges: 106.2% for AGIs below $25k, 71.8% for AGIs $25k-50k, 0.9% for AGIs $50k-75k)
Percentage of individuals using paid preparers for their 2020 taxes: 93.1%
Here:
93%
State:
92%
(% for various income ranges: 91.3% for AGIs below $25k, 93.8% for AGIs $25k-50k, 94.1% for AGIs $50k-75k, 94.1% for AGIs $75k-100k, 94.0% for AGIs $100k-200k, 95.2% for AGIs over 200k)
Averages for the 2012 tax year for zip code 91342, filed in 2013:
Average Adjusted Gross Income (AGI) in 2012: $43,126 (Individual Income Tax Returns)
Here:
$43,126
State:
$72,726
Salary/wage: $41,527 (reported on 85.7% of returns)
Here:
$41,527
State:
$59,079
(% of AGI for various income ranges: 74.5% for AGIs below $25k, 86.0% for AGIs $25k-50k, 85.7% for AGIs $50k-75k, 85.3% for AGIs $75k-100k, 84.8% for AGIs $100k-200k, 60.4% for AGIs over 200k)
Taxable interest for individuals: $530 (reported on 26.4% of returns)
This zip code:
$530
California:
$2,146
(% of AGI for various income ranges: 0.4% for AGIs below $25k, 0.2% for AGIs $25k-50k, 0.3% for AGIs $50k-75k, 0.3% for AGIs $75k-100k, 0.3% for AGIs $100k-200k, 0.8% for AGIs over 200k)
Ordinary dividends: $2,298 (reported on 6.7% of returns)
Here:
$2,298
State:
$9,308
(% of AGI for various income ranges: 0.3% for AGIs below $25k, 0.2% for AGIs $25k-50k, 0.2% for AGIs $50k-75k, 0.3% for AGIs $75k-100k, 0.4% for AGIs $100k-200k, 1.5% for AGIs over 200k)
Net capital gain/loss in AGI: +$2,062 (reported on 5.4% of returns)
Here:
+$2,062
State:
+$30,460
(% of AGI for various income ranges: 0.4% for AGIs $100k-200k, 3.0% for AGIs over 200k)
Profit/loss from business: +$10,504 (reported on 18.4% of returns)
Here:
+$10,504
State:
+$17,064
(% of AGI for various income ranges: 15.9% for AGIs below $25k, 4.6% for AGIs $25k-50k, 2.3% for AGIs $50k-75k, 1.8% for AGIs $75k-100k, 1.9% for AGIs $100k-200k, 2.6% for AGIs over 200k)
Taxable individual retirement arrangement distribution: $13,099 (reported on 3.9% of returns)
91342:
$13,099
California:
$19,557
(% of AGI for various income ranges: 0.9% for AGIs below $25k, 0.9% for AGIs $25k-50k, 1.1% for AGIs $50k-75k, 1.3% for AGIs $75k-100k, 1.4% for AGIs $100k-200k, 1.8% for AGIs over 200k)
Self-employment retirement plans: $10,917 (reported on 0.2% of returns)
91342:
$10,917
California:
$24,530
Total itemized deductions: $23,311 (30% of AGI, reported on 33.2% of returns)
Here:
$23,311
State:
$34,004
Here:
30.2% of AGI
State:
22.7% of AGI
(% of AGI for various income ranges: 8.6% for AGIs below $25k, 13.7% for AGIs $25k-50k, 20.0% for AGIs $50k-75k, 22.6% for AGIs $75k-100k, 22.3% for AGIs $100k-200k, 18.8% for AGIs over 200k)
Charity contributions: $2,515 (reported on 26.6% of returns)
Here:
$2,515
State:
$4,659
(% of AGI for various income ranges: 0.4% for AGIs below $25k, 1.0% for AGIs $25k-50k, 1.6% for AGIs $50k-75k, 2.0% for AGIs $75k-100k, 2.2% for AGIs $100k-200k, 2.5% for AGIs over 200k)
Taxes paid: $7,118 (reported on 33.1% of returns)
91342:
$7,118
State:
$14,448
(% of AGI for various income ranges: 2.0% for AGIs below $25k, 3.2% for AGIs $25k-50k, 5.6% for AGIs $50k-75k, 6.9% for AGIs $75k-100k, 7.7% for AGIs $100k-200k, 8.7% for AGIs over 200k)
Earned income credit: $2,411 (reported on 24.9% of returns)
Here:
$2,411
State:
$2,286
(% of AGI for various income ranges: 7.9% for AGIs below $25k, 1.5% for AGIs $25k-50k)
Percentage of individuals using paid preparers for their 2012 taxes: 78.1%
Here:
78%
State:
64%
(% for various income ranges: 76.7% for AGIs below $25k, 79.9% for AGIs $25k-50k, 79.1% for AGIs $50k-75k, 78.6% for AGIs $75k-100k, 76.2% for AGIs $100k-200k, 80.0% for AGIs over 200k)
Averages for the 2004 tax year for zip code 91342, filed in 2005:
Average Adjusted Gross Income (AGI) in 2004: $40,694 (Individual Income Tax Returns)
Here:
$40,694
State:
$58,600
Salary/wage: $37,199 (reported on 87.8% of returns)
Here:
$37,199
State:
$49,455
(% of AGI for various income ranges: 100.7% for AGIs below $10k, 82.0% for AGIs $10k-25k, 88.2% for AGIs $25k-50k, 88.3% for AGIs $50k-75k, 87.7% for AGIs $75k-100k, 60.2% for AGIs over 100k)
Taxable interest for individuals: $768 (reported on 35.3% of returns)
This zip code:
$768
California:
$2,365
(% of AGI for various income ranges: 3.0% for AGIs below $10k, 0.7% for AGIs $10k-25k, 0.5% for AGIs $25k-50k, 0.5% for AGIs $50k-75k, 0.7% for AGIs $75k-100k, 0.8% for AGIs over 100k)
Taxable dividends: $1,468 (reported on 10.0% of returns)
Here:
$1,468
State:
$4,746
(% of AGI for various income ranges: 1.3% for AGIs below $10k, 0.3% for AGIs $10k-25k, 0.2% for AGIs $25k-50k, 0.3% for AGIs $50k-75k, 0.4% for AGIs $75k-100k, 0.5% for AGIs over 100k)
Net capital gain/loss: +$11,687 (reported on 7.9% of returns)
Here:
+$11,687
State:
+$23,418
(% of AGI for various income ranges: -0.1% for AGIs below $10k, -0.2% for AGIs $10k-25k, 0.1% for AGIs $25k-50k, 0.4% for AGIs $50k-75k, 0.8% for AGIs $75k-100k, 8.0% for AGIs over 100k)
Profit/loss from business: +$9,905 (reported on 17.0% of returns)
Here:
+$9,905
State:
+$16,826
(% of AGI for various income ranges: 21.4% for AGIs below $10k, 9.9% for AGIs $10k-25k, 4.5% for AGIs $25k-50k, 2.6% for AGIs $50k-75k, 2.5% for AGIs $75k-100k, 2.0% for AGIs over 100k)
IRA payment deduction: $2,662 (reported on 1.9% of returns)
91342:
$2,662
California:
$3,192
(% of AGI for various income ranges: 0.2% for AGIs below $10k, 0.1% for AGIs $10k-25k, 0.1% for AGIs $25k-50k, 0.1% for AGIs $50k-75k, 0.1% for AGIs $75k-100k, 0.1% for AGIs over 100k)
Self-employed pension: $9,158 (reported on 0.3% of returns)
Here:
$9,158
California:
$17,688
(% of AGI for various income ranges: 0.0% for AGIs $25k-50k, 0.1% for AGIs $50k-75k, 0.1% for AGIs $75k-100k, 0.1% for AGIs over 100k)
Total itemized deductions: $21,017 (33% of AGI, reported on 39.5% of returns)
Here:
$21,017
State:
$28,113
Here:
32.8% of AGI
State:
25.3% of AGI
(% of AGI for various income ranges: 15.9% for AGIs below $10k, 12.1% for AGIs $10k-25k, 20.2% for AGIs $25k-50k, 25.9% for AGIs $50k-75k, 26.1% for AGIs $75k-100k, 17.5% for AGIs over 100k)
Charity contributions deductions: $2,403 (4% of AGI, reported on 33.8% of returns)
Here:
$2,403
State:
$3,923
Here:
3.6% of AGI
State:
3.3% of AGI
(% of AGI for various income ranges: 0.6% for AGIs below $10k, 0.7% for AGIs $10k-25k, 1.6% for AGIs $25k-50k, 2.5% for AGIs $50k-75k, 2.8% for AGIs $75k-100k, 2.3% for AGIs over 100k)
Total tax: $4,309 (reported on 69.7% of returns)
91342:
$4,309
State:
$10,761
(% of AGI for various income ranges: 5.3% for AGIs below $10k, 3.8% for AGIs $10k-25k, 5.2% for AGIs $25k-50k, 7.0% for AGIs $50k-75k, 8.6% for AGIs $75k-100k, 11.0% for AGIs over 100k)
Earned income credit: $1,886 (reported on 22.7% of returns)
Here:
$1,886
State:
$1,763
Percentage of individuals using paid preparers for their 2004 taxes: 79.5%
Here:
79%
State:
66%
(% for various income ranges: 72.2% for AGIs below $10k, 81.7% for AGIs $10k-25k, 81.5% for AGIs $25k-50k, 80.7% for AGIs $50k-75k, 77.3% for AGIs $75k-100k, 77.7% for AGIs over 100k)
Likely homosexual households (counted as self-reported same-sex unmarried-partner households)
Lesbian couples: 0.1% of all households
Gay men: 0.2% of all households
Household received Food Stamps/SNAP in the past 12 months: 4,360 Household did not receive Food Stamps/SNAP in the past 12 months: 21,246
Women who had a birth in the past 12 months: 1,394 (638 now married, 762 unmarried) Women who did not have a birth in the past 12 months: 21,750 (7,905 now married, 13,874 unmarried)
Housing units in zip code 91342 with a mortgage: 11,808 (689 second mortgage, 20 home equity loan, 582 both second mortgage and home equity loan) Houses without a mortgage: 132
Median monthly owner costs for units with a mortgage: $2,757 Median monthly owner costs for units without a mortgage: $912
Residents with income below the poverty level in 2022:
This zip code:
13.3%
Whole state:
12.2%
Residents with income below 50% of the poverty level in 2022:
This zip code:
6.9%
Whole state:
6.2%
Median number of rooms in houses and condos:
Here:
5.8
State:
6.0
Median number of rooms in apartments:
Here:
4.6
State:
3.9
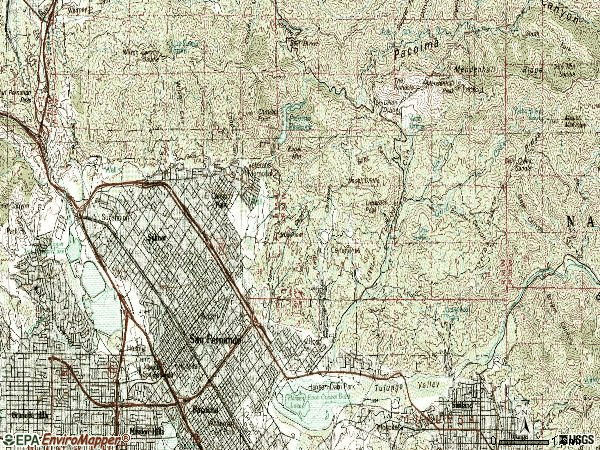
Notable locations in this zip code not listed on our city pages
Notable locations in zip code 91342: Little Tujunga Station (A), Tujunga District Office (B), Herreres Ranch (C), Karl Holton Camp (D), Little Tujunga Station (E), Lopez Canyon Forest Station (F), Middle Ranch (G), Paradise Ranch (H), San Fernando Ranger Station (I), Cottonwood Glen (J), Lopez Canyon Landfill (K), Tunnel (L), Watts Ranch (M), Rancho Sombrero (N), El Cariso Regional Park (O), Burns Ranch (P), LACD Fire Camp 9 (Q), San Fernando Valley Juvenile Hall (R), El Cariso Golf Course (S), Angels Gun Club (T). Display/hide their locations on the map
Churches in zip code 91342 include: Lakeview Terrace Baptist Church (A), Mountain View Baptist Church (B), Peace Lutheran Church (C), Ancient Church of the East (D), Christ Tabernacle Church of God (E), First Southern Baptist Church (F), Kingdom Hall of Jehovahs Witnesses (G), La Voz - Sylmar Seventh Day Adventist Church (H), Light And Life Christian Fellowship Church (I). Display/hide their locations on the map
Parks in zip code 91342 include: Dexter Park (1), Griffith Ranch Historical Monument (2), Sylmar Park (3), Veterans Memorial Park (4), Kagel Canyon Park (5), Lakeview Terrace Recreation Center (6), Stetson Ranch Park (7). Display/hide their locations on the map
9,445 married couples with children.
5,730 single-parent households (1,778 men, 3,952 women).
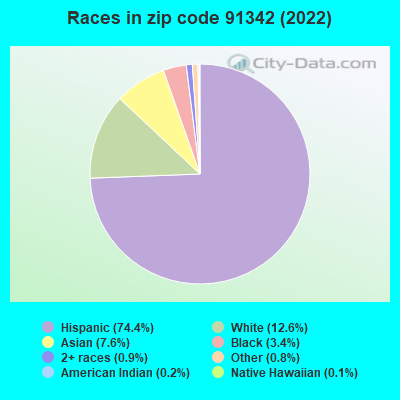
31.0% of residents of 91342 zip code speak English at home.
60.4% of residents speak Spanish at home (63% very well, 17% well, 14% not well, 6% not at all).
2.8% of residents speak other Indo-European language at home (66% very well, 24% well, 5% not well, 5% not at all).
5.4% of residents speak Asian or Pacific Island language at home (74% very well, 18% well, 5% not well, 3% not at all).
0.8% of residents speak other language at home (73% very well, 14% well, 9% not well, 4% not at all).
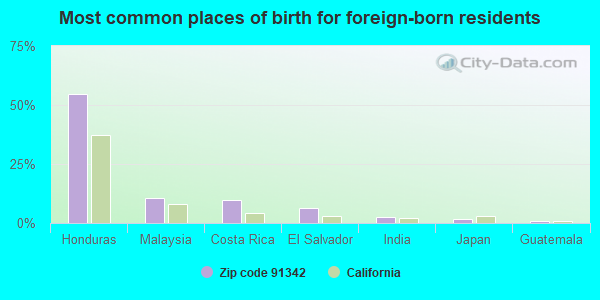
Foreign born population: 32,811 (35.7%) (58.8% of them are naturalized citizens)
This zip code:
35.7%
Whole state:
26.7%
55%Honduras
11%Malaysia
10%Costa Rica
6%El Salvador
3%India
2%Japan
1%Guatemala
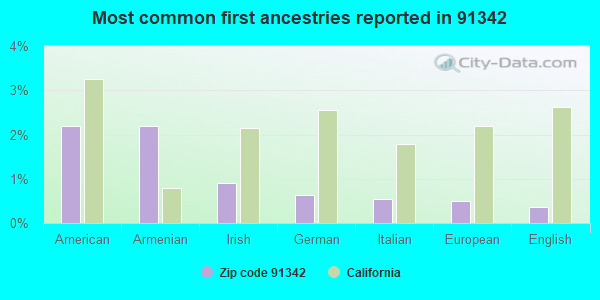
2%American
2%Armenian
1%Irish
1%German
1%Italian
1%European
0%English
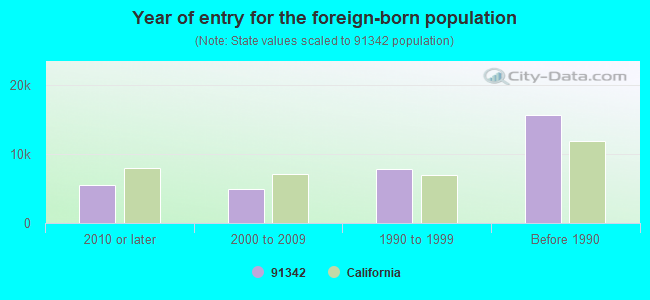
Year of entry for the foreign-born population
5,4552010 or later
4,8532000 to 2009
7,7791990 to 1999
15,598Before 1990
Major facilities with environmental interests located in this zip code:
LOS ANGELES AQUEDUCT FILTRATION PLANT (13101 SEPULVEDA BLVD in SYLMAR, CA) . Federal Facility
STATE MASTER (California - Hazardous Waste Tracking) - HAZARDOU WASTE PROGRAM (Integrated Compliance Information System) - ICIS-09-2004-0057, FORMAL ENFORCEMENT ACTION HAZARDOUS WASTE BIENNIAL REPORTER (Resource Conservation and Recovery Act (tracking hazardous waste)) Large Quantity Generators, more that 1000 kg of hazardous waste/month (Resource Conservation and Recovery Act (tracking hazardous waste)) Organizations: LOS ANGELES DEPARTMENT OF WATER & POWER (CONTACT/OPERATOR)
Alternative names: LA DEPARTMENT WATER & POWER, LA FILTRATION PLANT, LOS ANGELES FILTRATION PLANT, SYLMAR WATER TREATMENT PLANT
L 3 COMMUNICATIONS OCEAN SYSTEMS (15825 ROXFORD STREET in SYLMAR, CA)
STATE MASTER (California - Hazardous Waste Tracking) - HAZARDOU WASTE PROGRAM CRITERIA AND HAZARDOUS AIR POLLUTANT INVENTORY (Inventory of air pollution sources) HAZARDOUS WASTE BIENNIAL REPORTER (Resource Conservation and Recovery Act (tracking hazardous waste)) Large Quantity Generators, more that 1000 kg of hazardous waste/month (Resource Conservation and Recovery Act (tracking hazardous waste)) - notification TRI REPORTER (Tracking of toxic chemicals releasing facilities) Business SIC classification: SEARCH, DETECTION, NAVIGATION, GUIDANCE, AERONAUTICAL, AND NAUTICAL SYSTEMS AND INSTRUMENTS Business NAICS classification: SEARCH, DETECTION, NAVIGATION, GUIDANCE, AERONAUTICAL, AND NAUTICAL SYSTEM AND INSTRUMENT MANUFACTURING. Organizations: L-3 COMMUNICATIONS OCEAN SYSTEMS, INC (CONTACT/OPERATOR)
, L-3 COMMUNICATIONS , INC (CONTACT/OWNER)
Alternative names: ALLIED-SIGNAL INC. OCEAN SYS., L-3 COMM. INC DBA OCEAN SYSTEMS DIV, L 3 COMMUNICATIONS OCEAN SYSTEMS DIVISIO, L 3 COMMUNICATION OCEAN SYST
JOHANSON DIELECTRICS INCORPORATED (15191 BLEDSOE ST. in SYLMAR, CA)
AIR MAJOR (AIRS/AFS) STATE MASTER (California - Hazardous Waste Tracking) - HAZARDOU WASTE PROGRAM CRITERIA AND HAZARDOUS AIR POLLUTANT INVENTORY (Inventory of air pollution sources) HAZARDOUS WASTE BIENNIAL REPORTER (Resource Conservation and Recovery Act (tracking hazardous waste)) Large Quantity Generators, more that 1000 kg of hazardous waste/month (Resource Conservation and Recovery Act (tracking hazardous waste)) TRI REPORTER (Tracking of toxic chemicals releasing facilities) Business SIC classification: ELECTRONIC CAPACITORS; ELECTRONIC COMPONENTS Business NAICS classification: ELECTRONIC CAPACITOR MANUFACTURING. Organizations: N ERIC JOHANSON (CONTACT/OWNER)
Alternative names: JOHANSON DIELECTRICS INC.
ISU PETASYS INC. (12930 BRADLEY AVE. in SYLMAR, CA)
STATE MASTER (California - Hazardous Waste Tracking) - HAZARDOU WASTE PROGRAM CRITERIA AND HAZARDOUS AIR POLLUTANT INVENTORY (Inventory of air pollution sources) Large Quantity Generators, more that 1000 kg of hazardous waste/month (Resource Conservation and Recovery Act (tracking hazardous waste)) TRI REPORTER (Tracking of toxic chemicals releasing facilities) Business SIC classification: PRINTED CIRCUIT BOARDS Business NAICS classification: BARE PRINTED CIRCUIT BOARD MANUFACTURING. Alternative names: PETASYS AMERICA INC
GENERAL POLYMERS WEST INC (12355 GLADSTONE AVENUE in SYLMAR, CA)
STATE MASTER (California - Hazardous Waste Tracking) - HAZARDOU WASTE PROGRAM CRITERIA AND HAZARDOUS AIR POLLUTANT INVENTORY (Inventory of air pollution sources) Large Quantity Generators, more that 1000 kg of hazardous waste/month (Resource Conservation and Recovery Act (tracking hazardous waste)) TRI REPORTER (Tracking of toxic chemicals releasing facilities) Business SIC classification: ADHESIVES AND SEALANTS; NONCLASSIFIABLE ESTABLISHMENTS Organizations: K AND W PROPERTIES (CONTACT/OWNER)
Alternative names: C E MACMILLIN CO INC, GENERAL POLYMERS W INCORPORATED
FENTON AVENUE CHARTER SCHOOL (11828 GAIN ST in LAKE VIEW TERRACE, CA)
STATE MASTER (California - Hazardous Waste Tracking) - HAZARDOU WASTE PROGRAM Large Quantity Generators, more that 1000 kg of hazardous waste/month (Resource Conservation and Recovery Act (tracking hazardous waste)) Organizations: LOS ANGELES UNIFIED SCHOOL DISTRICT (CONTACT/OWNER)
LLAMAS PLASTICS INCORPORATED (12970 BRADLEY AVENUE in SYLMAR, CA)
STATE MASTER (California - Hazardous Waste Tracking) - HAZARDOU WASTE PROGRAM CRITERIA AND HAZARDOUS AIR POLLUTANT INVENTORY (Inventory of air pollution sources) Large Quantity Generators, more that 1000 kg of hazardous waste/month (Resource Conservation and Recovery Act (tracking hazardous waste)) Business SIC classification: PLASTICS PRODUCTS Business NAICS classification: OTHER AIRCRAFT PARTS AND AUXILIARY EQUIPMENT MANUFACTURING.
CASTLE PRECISION INDUSTRIES (15148 BLEDSOE ST in SYLMAR, CA)
STATE MASTER (California - Hazardous Waste Tracking) - HAZARDOU WASTE PROGRAM Small Quantity Generators, between 100 kg and 1000 kg of hazardous waste/month (Resource Conservation and Recovery Act (tracking hazardous waste)) - notification Organizations: WILLIAM WINDETTE GARY BERGER (CONTACT/OWNER)
LINABOND INC (12960 BRADLEY AVE in SYLMAR, CA)
STATE MASTER (California - Hazardous Waste Tracking) - HAZARDOU WASTE PROGRAM Small Quantity Generators, between 100 kg and 1000 kg of hazardous waste/month (Resource Conservation and Recovery Act (tracking hazardous waste)) Organizations: WEINSTOCK CO I LLC (CONTACT/OWNER)
LA FIRE STATION 91 (14430 POLK ST in SYLMAR, CA)
STATE MASTER (California - Hazardous Waste Tracking) - HAZARDOU WASTE PROGRAM Small Quantity Generators, between 100 kg and 1000 kg of hazardous waste/month (Resource Conservation and Recovery Act (tracking hazardous waste)) - notification Organizations: CITY OF LOS ANGELES (CONTACT/OWNER)
Alternative names: CITY OF LA GENERAL SERVICES
ANTHONY INTERNATIONL (12812 ARROYO STREET in SYLMAR, CA)
(Integrated Compliance Information System) - ICIS-09-2004-0036, FORMAL ENFORCEMENT ACTION CRITERIA AND HAZARDOUS AIR POLLUTANT INVENTORY (Inventory of air pollution sources) TRI REPORTER (Tracking of toxic chemicals releasing facilities) Business SIC classification: GLASS PRODUCTS, MADE OF PURCHASED GLASS; NONCLASSIFIABLE ESTABLISHMENTS Business NAICS classification: GLASS PRODUCT MANUFACTURING MADE OF PURCHASED GLASS. Alternative names: ANTHONY INTL.
FENTON AVENUE ELEMENTARY (CHAR) (11828 GAIN ST. in LAKE VIEW TERRACE, CA)
(National Center for Education Statistics) - STATE ID-6017016 Organizations: LOS ANGELES UNIFIED (SCHOOL DISTRICT)
HERRICK AVENUE ELEMENTARY (13350 HERRICK AVE. in SYLMAR, CA)
(National Center for Education Statistics) - STATE ID-6017552 Organizations: LOS ANGELES UNIFIED (SCHOOL DISTRICT)
Housing units lacking complete plumbing facilities: 0.5% Housing units lacking complete kitchen facilities: 2.1%
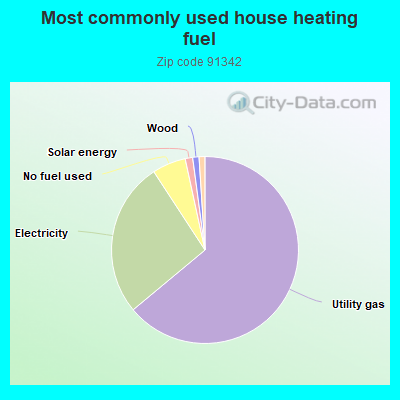
63.9%Utility gas
26.8%Electricity
5.8%No fuel used
1.3%Solar energy
1.1%Wood
1.0%Bottled, tank, or LP gas
Population in 1990: 68,612. Population change in the 1990s: +13,358 (+19.5%).
Place of birth for U.S.-born residents:
This state: 52,443
Northeast: 1,072
Midwest: 1,398
South: 1,890
West: 1,106
54% of the 91342 zip code residents lived in the same house 5 years ago. Out of people who lived in different houses, 89% lived in this county. Out of people who lived in different counties, 50% lived in California.
94% of the 91342 zip code residents lived in the same house 1 year ago. Out of people who lived in different houses, 76% moved from this county. Out of people who lived in different houses, 14% moved from different county within same state. Out of people who lived in different houses, 4% moved from different state. Out of people who lived in different houses, 9% moved from abroad.
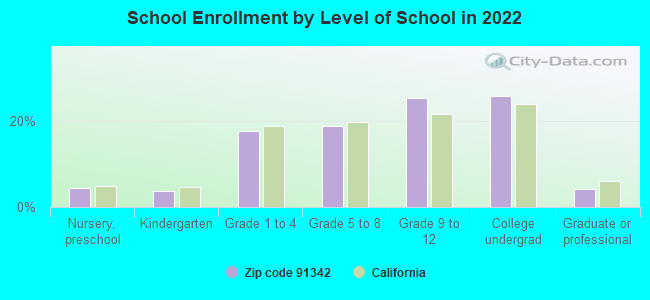
Private vs. public school enrollment:
Students in private schools in grades 1 to 8 (elementary and middle school): 866
Here:
10.0%
California:
10.5%
Students in private schools in grades 9 to 12 (high school): 487
Here:
8.1%
California:
8.5%
Students in private undergraduate colleges: 606
Here:
9.9%
California:
15.9%
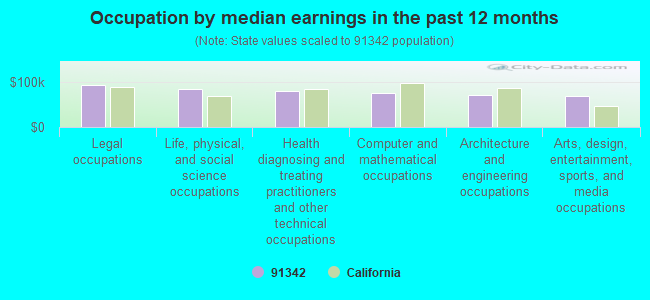
Occupation by median earnings in the past 12 months ($)
94,169Legal occupations
85,629Life, physical, and social science occupations
80,299Health diagnosing and treating practitioners and other technical occupations
75,172Computer and mathematical occupations
71,013Architecture and engineering occupations
68,389Arts, design, entertainment, sports, and media occupations
Companies with biggest federal contracts located in this zip code (SYLMAR, CA):
L-3 COMMUNICATIONS CORPORATION (15825 ROXFORD ST) : $108,158,266 in 209 contractsfrom 1999 to 2006
Contracts for Underwater Sound Equipment, Miscellaneous Communication Equipment, Technical Representation Services -- Construction, Mining, Excavating, and Highway Maintenance Equipment, Technical Representation Services -- Communication, Detection, and Coherent Radiation Equipment, and moreby Navy, Defense Logistics Agency Signed by year:2000: $22,026,772; 2001: $9,862,835; 2002: $20,423,665; 2003: $16,134,582; 2004: $19,155,664; 2005: $13,009,487; 2006: $6,701,819.
Biggest contracts:
$12,867,000 with Navy for Underwater Sound Equipment. Signed on 2004-10-19. Completion date: 2006-01-24.
$8,682,000, same as above.Signed on 2002-12-17. Completion date: 2004-04-05.
$5,214,470 with Navy for Miscellaneous Communication Equipment. Signed on 2001-10-23. Completion date: 2006-09-30.
$4,671,390 with Navy for Underwater Sound Equipment. Signed on 2000-09-01. Completion date: 2001-05-24.
ESTERLINE MASON ELECTRIC COMPA (13955 BALBOA BLVD; small business) : $25,651,532 in 653 contractsfrom 1999 to 2006
Contracts for Helicopter Rotor Blades, Drive Mechanisms and Components, Miscellaneous Aircraft Accessories and Components, Aircraft Propellers and Components, Miscellaneous Electrical and Electronic Components, and moreby Department of Defense, Army, Defense Logistics Agency, Bureau of Prisoners/Federal Prison System, and others Signed by year:2000: $2,305,528; 2001: $1,320,194; 2002: $4,266,796; 2003: $5,609,345; 2004: $3,849,290; 2005: $6,485,924; 2006: $1,689,474.
Biggest contracts:
$1,789,865 with Department of Defense for Helicopter Rotor Blades, Drive Mechanisms and Components. Signed on 2003-06-24. Completion date: 2004-06-30.
$1,413,220 with Army for Miscellaneous Aircraft Accessories and Components. Signed on 2005-03-30. Completion date: 2011-12-30.
$756,597, same as above.Signed on 2002-04-03. Completion date: 2006-04-30.
$677,256, same as above.Signed on 2003-02-28. Completion date: 2006-04-30.
SIERRACIN/SYLMAR CORPORATION (12780 SAN FERNANDO RD; small business) : $20,980,566 in 66 contractsfrom 1999 to 2006
Contracts for Airframe Structural Components, Glass Fabricated Materials, Vehicular Furniture and Accessories, Gliders, and moreby Air Force, Navy, Army, Defense Logistics Agency, and others Signed by year:2000: $9,399,800; 2001: $3,743,691; 2002: $585,144; 2003: $672,801; 2004: $1,324,128; 2005: $61,184; 2006: $251,958.
Biggest contracts:
$4,444,760 with Air Force for Airframe Structural Components. Signed on 2000-04-04. Completion date: 2001-04-30.
$3,539,270 with Navy for Airframe Structural Components. Signed on 1999-12-02. Completion date: 2000-12-01.
$2,167,570, same as above.Signed on 2000-12-02. Completion date: 2001-06-01.
$1,244,042, same as above.Signed on 2000-09-12. Completion date: 2000-10-12.
LLAMAS PLASTICS INC (12970 BRADLEY AVE; small business) : $17,949,084 in 184 contractsfrom 1999 to 2006
Contracts for Airframe Structural Components, Systems Engineering Services, Plastics Fabricated Materials, Packing and Gasket Materials, and moreby Air Force, Defense Logistics Agency, Navy Signed by year:2000: $3,624,623; 2001: $4,656,288; 2002: $2,936,041; 2003: $2,334,803; 2004: $1,819,277; 2005: $1,009,306; 2006: $788,531.
Biggest contracts:
$1,117,566 with Air Force for Airframe Structural Components. Signed on 2001-07-23. Completion date: 2003-07-31.
$716,128, same as above.Signed on 2003-04-23. Completion date: 2004-04-30.
$602,560 with Defense Logistics Agency for Airframe Structural Components. Signed on 2002-08-06. Completion date: 2005-03-08.
$501,424, same as above.Signed on 2000-03-31. Completion date: 2002-02-19.
M S AEROSPACE, INC (13928 BALBOA BLVD; small business) : $8,722,217 in 410 contractsfrom 2000 to 2006
Contracts for Bolts, Screws, Nuts and Washers, Studs, and moreby Defense Logistics Agency, Army, Navy Signed by year:2000: $668,667; 2001: $1,657,777; 2002: $1,043,237; 2003: $209,600; 2004: $2,031,514; 2005: $2,456,135; 2006: $655,287.
Biggest contracts:
$232,560 with Defense Logistics Agency for Bolts. Signed on 2001-01-17. Completion date: 2001-06-06.
$232,560, same as above.Signed on 2001-01-17. Completion date: 2001-06-06.
$171,000, same as above.Signed on 2001-04-05. Completion date: 2001-08-23.
$99,995, same as above.Signed on 2001-09-27. Completion date: 2001-09-28.
T M W CORPORATION (15148 BLEDSOE ST; small business) : $8,025,028 in 201 contractsfrom 1999 to 2006
Contracts for Miscellaneous Power Transmission Equipment, Aircraft Landing Gear Components, Pipe, Tube and Rigid Tubing, Aircraft Hydraulic, Vacuum, and De-icing System Components, and moreby Defense Logistics Agency, Air Force, Navy, Army, and others Signed by year:2000: $257,070; 2001: $105,680; 2002: $1,305,814; 2003: $306,020; 2004: $3,545,073; 2005: $1,409,616; 2006: $495,887.
Biggest contracts:
$549,473 with Defense Logistics Agency for Miscellaneous Power Transmission Equipment. Signed on 2004-02-12. Completion date: 2004-12-18.
$470,800 with Air Force for Aircraft Landing Gear Components. Signed on 2004-12-01. Completion date: 2006-01-31.
$413,034, same as above.Signed on 1999-12-08. Completion date: 2000-05-31.
$299,000, same as above.Signed on 2004-02-17. Completion date: 2006-02-28.
BEI SENSORS & SYSTEMS COMPANY (13100 TELFAIR AVE) : $4,913,719 in 43 contractsfrom 2000 to 2006
Contracts for Liquid and Gas Flow, Liquid Level, and Mechanical Motion Measuring Instruments, Synchros and Resolvers, Maintenance, Repair and Rebuilding of Equipment -- Communication, Detection, and Coherent Radiation Equipment, Fire Control Radar Equipment, except Airborne, and moreby Army, Navy, Defense Logistics Agency, Air Force, and others Signed by year:2000: $1,291,668; 2001: $470,017; 2002: $949,677; 2003: $496,610; 2004: $854,558; 2005: $316,709; 2006: $534,480.
Biggest contracts:
$854,440 with Army for Liquid and Gas Flow, Liquid Level, and Mechanical Motion Measuring Instruments. Taking place in AR. Signed on 2004-12-17. Completion date: 2005-09-05.
$500,160, same as above.Signed on 2005-06-27. Completion date: 2005-09-05.
$495,693 with Navy for Synchros and Resolvers. Signed on 2006-01-26. Completion date: 2006-05-18.
$358,182 with Army for Liquid and Gas Flow, Liquid Level, and Mechanical Motion Measuring Instruments. Taking place in AR. Signed on 2001-04-25. Completion date: 2002-01-07.
QUALLION LLC (12744 SAN FERNANDO RD (SYL; small business) : $4,691,947 in 8 contractsfrom 2003 to 2006
Contracts for Defense Electronics and Communication Equipment -- Basic Research (R&D), Services -- Basic Research (R&D), Defense Missile and Space Systems -- Advanced Development (R&D), Batteries, Rechargeable by Army, NASA Signed by year:2000: $0; 2001: $0; 2002: $0; 2003: $1,181,533; 2004: $1,205,750; 2005: $1,454,664; 2006: $850,000.
Biggest contracts:
$1,249,743 with Army for Defense Electronics and Communication Equipment -- Basic Research (R&D). Signed on 2005-02-25. Completion date: 2006-08-24.
$1,200,000, same as above.Signed on 2004-03-04. Completion date: 2005-05-31.
$1,181,533 with Army for Services -- Basic Research (R&D). Signed on 2003-04-30. Completion date: 2004-10-30.
$850,000 with Army for Defense Electronics and Communication Equipment -- Basic Research (R&D). Signed on 2006-04-12. Completion date: 2007-04-18.
VALLEY-TODECO, INC (12975 BRADLEY AVE) : $4,117,674 in 69 contractsfrom 2000 to 2006
Contracts for Bolts, Gas Turbines and Jet Engines, Aircraft; Prime Moving, and Components, Studs, Hardware, Commercial, and moreby Defense Logistics Agency, Air Force Signed by year:2000: $454,065; 2001: $2,677,809; 2002: $865,770; 2003: $0; 2004: $22,330; 2005: $65,903; 2006: $31,797.
Biggest contracts:
$693,280 with Defense Logistics Agency for Bolts. Signed on 2001-04-05. Completion date: 2001-08-23.
$192,499 with Defense Logistics Agency for Gas Turbines and Jet Engines, Aircraft; Prime Moving, and Components. Signed on 2001-03-12. Completion date: 2001-09-08.
$192,499, same as above.Signed on 2001-06-26. Completion date: 2001-12-19.
$99,950 with Defense Logistics Agency for Bolts. Signed on 2001-01-16. Completion date: 2001-06-02.
SUPERIOR GUNITE (12306 VAN NUYS BLVD; small business) : $4,095,107 in 8 contractsfrom 2002 to 2004
Contracts for Maintenance, Repair or Alteration of Real Property -- Other Non-Building Facilities by U.S. Army Corps of Engineers - civil program financing only, Army Signed by year:2000: $0; 2001: $0; 2002: $3,766,121; 2003: $240,588; 2004: $88,398; 2005: $0; 2006: $0.
Biggest contracts:
$3,766,121 with U.S. Army Corps of Engineers - civil program financing only for Maintenance, Repair or Alteration of Real Property -- Other Non-Building Facilities. Taking place in HI. Signed on 2002-09-23. Completion date: 2003-06-07.
$167,000 with Army for Maintenance, Repair or Alteration of Real Property -- Other Non-Building Facilities. Taking place in HI. Signed on 2003-12-20. Completion date: 2003-06-07.
$88,398, same as above.Signed on 2004-02-11. Completion date: 2003-06-07.
$80,000 with U.S. Army Corps of Engineers - civil program financing only for Maintenance, Repair or Alteration of Real Property -- Other Non-Building Facilities. Taking place in HI. Signed on 2003-06-20. Completion date: 2003-06-07.
Top industries in this zip code by the number of employees in 2005:
Health Care and Social Assistance: General Medical and Surgical Hospitals (over 1000 employees: 1 establishment)
Health Care and Social Assistance: Nursing Care Facilities (100-249: 6, 50-99: 1, 20-49: 1, 10-19: 4, 5-9: 1)
2005 - 2018 National Fire Incident Reporting System (NFIRS) incidents
According to the data from the years 2005 - 2018 the average number of fires per year is 175. The highest number of fires - 233 took place in 2006, and the least - 101 in 2012. The data has a dropping trend.
When looking into fire subcategories, the most reports belonged to: Outside Fires (34.9%), and Mobile Property/Vehicle Fires (31.9%).
Fire incident types reported to NFIRS in Zip Code 91342
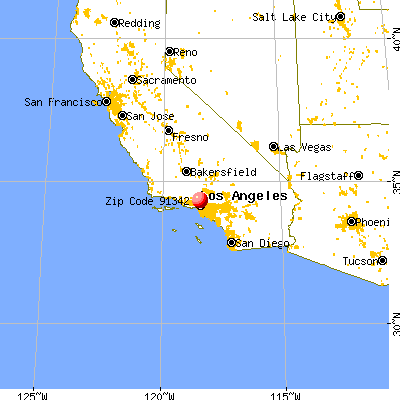


 Nearest zip codes: 91340, 91387, 91040, 91331, 91345, 91352.


 . Federal Facility
 According to the data from the years 2005 - 2018 the average number of fires per year is 175. The highest number of fires - 233 took place in 2006, and the least - 101 in 2012. The data has a dropping trend.
 When looking into fire subcategories, the most reports belonged to: Outside Fires (34.9%), and Mobile Property/Vehicle Fires (31.9%).