Estimated zip code population in 2022: 28,526 Zip code population in 2010: 25,851 Zip code population in 2000: 25,985
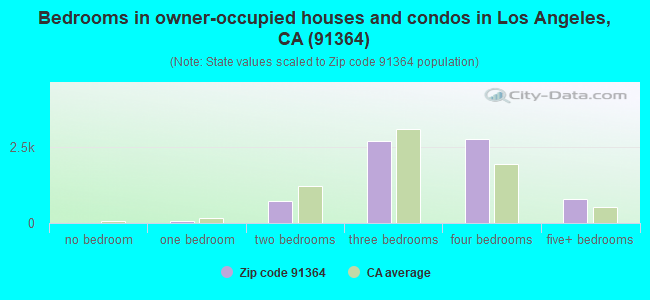
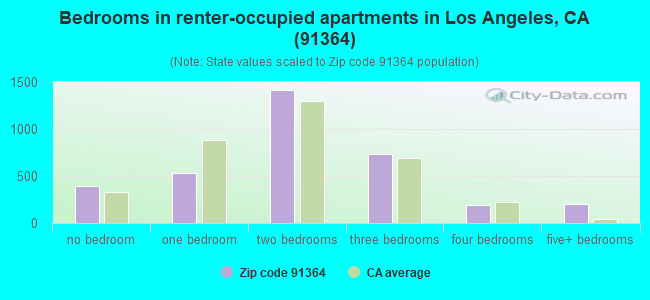
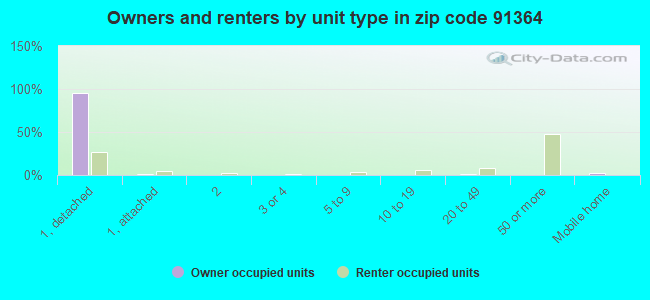
Houses and condos: 11,249 Renter-occupied apartments: 3,457
% of renters here:
33%
State:
44%
March 2022 cost of living index in zip code 91364: 138.8 (high, U.S. average is 100)
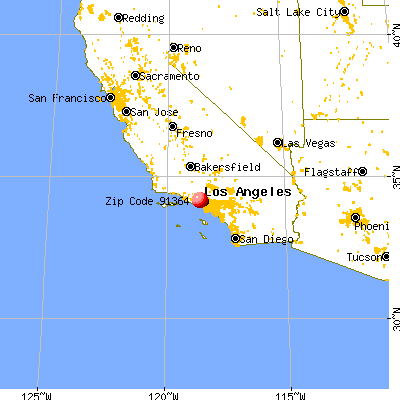
Land area: 7.6 sq. mi. Water area: 0.0 sq. mi.
Population density: 3,757 people per square mile
(average).
OSM Map
General Map
Google Map
MSN Map
OSM Map
General Map
Google Map
MSN Map
OSM Map
General Map
Google Map
MSN Map
OSM Map
General Map
Google Map
MSN Map
Please wait while loading the map...
Real estate property taxes paid for housing units in 2022:
This zip code:
0.7% ($8,769)
California:
0.7% ($4,831)
Median real estate property taxes paid for housing units with mortgages in 2022: $9,567 (0.8%) Median real estate property taxes paid for housing units with no mortgage in 2022: $5,295 (0.5%)
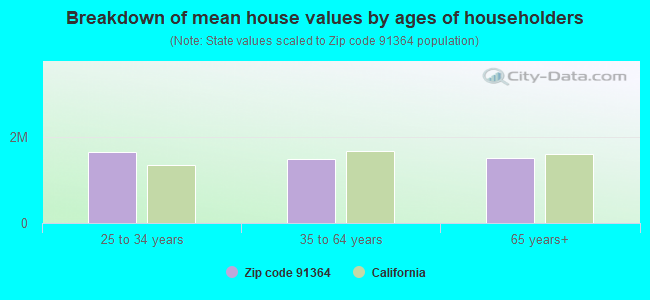
Estimated median house/condo value in 2022: $1,202,795
91364:
$1,202,795
California:
$715,900
According to our research of California and other state lists, there were 12 registered sex offenders living in 91364 zip code as of April 27, 2024. The ratio of all residents to sex offenders in zip code 91364 is 2,334 to 1. The ratio of registered sex offenders to all residents in this zip code is much lower than the state average.
Median resident age:
This zip code:
43.1 years
California median age:
37.9 years
Average household size:
This zip code:
2.7 people
California:
2.8 people
Averages for the 2020 tax year for zip code 91364, filed in 2021:
Average Adjusted Gross Income (AGI) in 2020: $165,836 (Individual Income Tax Returns)
Here:
$165,836
State:
$95,910
Salary/wage: $119,265 (reported on 72.4% of returns)
Here:
$119,265
State:
$77,331
(% of AGI for various income ranges: 1166.9% for AGIs below $25k, 4076.1% for AGIs $25k-50k, 8014.2% for AGIs $50k-75k, 11957.9% for AGIs $75k-100k, 23086.2% for AGIs $100k-200k, 125143.0% for AGIs over 200k)
Taxable interest for individuals: $6,137 (reported on 48.1% of returns)
This zip code:
$6,137
California:
$2,294
(% of AGI for various income ranges: 46.9% for AGIs below $25k, 70.1% for AGIs $25k-50k, 137.4% for AGIs $50k-75k, 256.8% for AGIs $75k-100k, 432.7% for AGIs $100k-200k, 5294.8% for AGIs over 200k)
Ordinary dividends: $13,680 (reported on 35.1% of returns)
Here:
$13,680
State:
$10,949
(% of AGI for various income ranges: 88.2% for AGIs below $25k, 167.0% for AGIs $25k-50k, 299.8% for AGIs $50k-75k, 455.5% for AGIs $75k-100k, 884.9% for AGIs $100k-200k, 8036.2% for AGIs over 200k)
Net capital gain/loss in AGI: +$71,333 (reported on 35.7% of returns)
Here:
+$71,333
State:
+$49,306
(% of AGI for various income ranges: 67.9% for AGIs below $25k, 156.7% for AGIs $25k-50k, 288.5% for AGIs $50k-75k, 468.9% for AGIs $75k-100k, 1292.5% for AGIs $100k-200k, 54305.6% for AGIs over 200k)
Profit/loss from business: +$25,604 (reported on 30.3% of returns)
Here:
+$25,604
State:
+$15,671
(% of AGI for various income ranges: 296.8% for AGIs below $25k, 596.4% for AGIs $25k-50k, 950.8% for AGIs $50k-75k, 1351.6% for AGIs $75k-100k, 2178.9% for AGIs $100k-200k, 9531.3% for AGIs over 200k)
Taxable individual retirement arrangement distribution: $27,887 (reported on 9.5% of returns)
91364:
$27,887
California:
$23,505
(% of AGI for various income ranges: 64.4% for AGIs below $25k, 183.2% for AGIs $25k-50k, 281.4% for AGIs $50k-75k, 583.0% for AGIs $75k-100k, 946.2% for AGIs $100k-200k, 3023.5% for AGIs over 200k)
Self-employed (Keogh) retirement plans: $29,150 (reported on 2.5% of returns)
91364:
$29,150
California:
$30,163
(% of AGI for various income ranges: 11.9% for AGIs below $25k, 32.6% for AGIs $50k-75k, 99.1% for AGIs $75k-100k, 196.1% for AGIs $100k-200k, 1174.3% for AGIs over 200k)
Total itemized deductions: $43,120 (reported on 29.6% of returns)
Here:
$43,120
State:
$39,517
(% of AGI for various income ranges: 333.8% for AGIs below $25k, 708.4% for AGIs $25k-50k, 1465.9% for AGIs $50k-75k, 2233.8% for AGIs $75k-100k, 4003.8% for AGIs $100k-200k, 16011.3% for AGIs over 200k)
Charity contributions: $11,343 (reported on 24.4% of returns)
Here:
$11,343
State:
$12,598
(% of AGI for various income ranges: 11.0% for AGIs below $25k, 52.8% for AGIs $25k-50k, 103.6% for AGIs $50k-75k, 182.1% for AGIs $75k-100k, 430.5% for AGIs $100k-200k, 5120.2% for AGIs over 200k)
Taxes paid: $9,141 (reported on 29.6% of returns)
91364:
$9,141
State:
$8,807
(% of AGI for various income ranges: 70.2% for AGIs below $25k, 155.7% for AGIs $25k-50k, 344.4% for AGIs $50k-75k, 607.9% for AGIs $75k-100k, 1106.9% for AGIs $100k-200k, 2793.3% for AGIs over 200k)
Earned income credit: $1,379 (reported on 8.5% of returns)
Here:
$1,379
State:
$2,074
(% of AGI for various income ranges: 58.3% for AGIs below $25k, 48.3% for AGIs $25k-50k)
Percentage of individuals using paid preparers for their 2020 taxes: 92.5%
Here:
93%
State:
92%
(% for various income ranges: 90.3% for AGIs below $25k, 92.1% for AGIs $25k-50k, 93.3% for AGIs $50k-75k, 91.9% for AGIs $75k-100k, 93.8% for AGIs $100k-200k, 94.4% for AGIs over 200k)
Averages for the 2012 tax year for zip code 91364, filed in 2013:
Average Adjusted Gross Income (AGI) in 2012: $147,108 (Individual Income Tax Returns)
Here:
$147,108
State:
$72,726
Salary/wage: $118,547 (reported on 73.9% of returns)
Here:
$118,547
State:
$59,079
(% of AGI for various income ranges: 61.0% for AGIs below $25k, 64.5% for AGIs $25k-50k, 65.2% for AGIs $50k-75k, 63.9% for AGIs $75k-100k, 68.0% for AGIs $100k-200k, 55.9% for AGIs over 200k)
Taxable interest for individuals: $3,570 (reported on 51.5% of returns)
This zip code:
$3,570
California:
$2,146
(% of AGI for various income ranges: 3.1% for AGIs below $25k, 1.4% for AGIs $25k-50k, 1.3% for AGIs $50k-75k, 1.5% for AGIs $75k-100k, 1.3% for AGIs $100k-200k, 1.1% for AGIs over 200k)
Ordinary dividends: $13,161 (reported on 34.4% of returns)
Here:
$13,161
State:
$9,308
(% of AGI for various income ranges: 4.5% for AGIs below $25k, 2.6% for AGIs $25k-50k, 2.0% for AGIs $50k-75k, 2.7% for AGIs $75k-100k, 2.1% for AGIs $100k-200k, 3.5% for AGIs over 200k)
Net capital gain/loss in AGI: +$24,521 (reported on 33.5% of returns)
Here:
+$24,521
State:
+$30,460
(% of AGI for various income ranges: 0.8% for AGIs $25k-50k, 0.4% for AGIs $50k-75k, 0.6% for AGIs $75k-100k, 1.7% for AGIs $100k-200k, 8.1% for AGIs over 200k)
Profit/loss from business: +$36,866 (reported on 30.0% of returns)
Here:
+$36,866
State:
+$17,064
(% of AGI for various income ranges: 21.5% for AGIs below $25k, 14.6% for AGIs $25k-50k, 9.4% for AGIs $50k-75k, 7.6% for AGIs $75k-100k, 6.0% for AGIs $100k-200k, 6.9% for AGIs over 200k)
Taxable individual retirement arrangement distribution: $30,567 (reported on 12.5% of returns)
91364:
$30,567
California:
$19,557
(% of AGI for various income ranges: 3.9% for AGIs below $25k, 3.4% for AGIs $25k-50k, 3.8% for AGIs $50k-75k, 3.6% for AGIs $75k-100k, 3.6% for AGIs $100k-200k, 2.0% for AGIs over 200k)
Self-employment retirement plans: $25,794 (reported on 2.4% of returns)
91364:
$25,794
California:
$24,530
(% of AGI for various income ranges: 0.5% for AGIs below $25k, 0.2% for AGIs $50k-75k, 0.3% for AGIs $75k-100k, 0.5% for AGIs $100k-200k, 0.5% for AGIs over 200k)
Total itemized deductions: $52,162 (22% of AGI, reported on 55.6% of returns)
Here:
$52,162
State:
$34,004
Here:
21.9% of AGI
State:
22.7% of AGI
(% of AGI for various income ranges: 34.1% for AGIs below $25k, 22.9% for AGIs $25k-50k, 24.9% for AGIs $50k-75k, 24.2% for AGIs $75k-100k, 23.2% for AGIs $100k-200k, 17.2% for AGIs over 200k)
Charity contributions: $5,663 (reported on 46.1% of returns)
Here:
$5,663
State:
$4,659
(% of AGI for various income ranges: 1.2% for AGIs below $25k, 1.5% for AGIs $25k-50k, 1.6% for AGIs $50k-75k, 1.9% for AGIs $75k-100k, 1.8% for AGIs $100k-200k, 1.8% for AGIs over 200k)
Taxes paid: $25,469 (reported on 55.2% of returns)
91364:
$25,469
State:
$14,448
(% of AGI for various income ranges: 7.7% for AGIs below $25k, 5.0% for AGIs $25k-50k, 6.7% for AGIs $50k-75k, 7.6% for AGIs $75k-100k, 9.1% for AGIs $100k-200k, 10.5% for AGIs over 200k)
Earned income credit: $1,546 (reported on 10.0% of returns)
Here:
$1,546
State:
$2,286
(% of AGI for various income ranges: 3.7% for AGIs below $25k, 0.6% for AGIs $25k-50k)
Percentage of individuals using paid preparers for their 2012 taxes: 74.4%
Here:
74%
State:
64%
(% for various income ranges: 70.0% for AGIs below $25k, 70.4% for AGIs $25k-50k, 71.8% for AGIs $50k-75k, 75.8% for AGIs $75k-100k, 77.9% for AGIs $100k-200k, 85.5% for AGIs over 200k)
Averages for the 2004 tax year for zip code 91364, filed in 2005:
Average Adjusted Gross Income (AGI) in 2004: $103,524 (Individual Income Tax Returns)
Here:
$103,524
State:
$58,600
Salary/wage: $82,206 (reported on 72.9% of returns)
Here:
$82,206
State:
$49,455
(% of AGI for various income ranges: 57.6% for AGIs $10k-25k, 66.6% for AGIs $25k-50k, 65.6% for AGIs $50k-75k, 68.5% for AGIs $75k-100k, 52.9% for AGIs over 100k)
Taxable interest for individuals: $4,403 (reported on 64.0% of returns)
This zip code:
$4,403
California:
$2,365
(% of AGI for various income ranges: 6.0% for AGIs $10k-25k, 3.1% for AGIs $25k-50k, 2.2% for AGIs $50k-75k, 2.4% for AGIs $75k-100k, 2.5% for AGIs over 100k)
Taxable dividends: $6,628 (reported on 40.5% of returns)
Here:
$6,628
State:
$4,746
(% of AGI for various income ranges: 4.0% for AGIs $10k-25k, 2.4% for AGIs $25k-50k, 2.0% for AGIs $50k-75k, 1.9% for AGIs $75k-100k, 2.5% for AGIs over 100k)
Net capital gain/loss: +$31,563 (reported on 39.8% of returns)
Here:
+$31,563
State:
+$23,418
(% of AGI for various income ranges: 0.8% for AGIs $10k-25k, 0.8% for AGIs $25k-50k, 1.2% for AGIs $50k-75k, 1.3% for AGIs $75k-100k, 15.4% for AGIs over 100k)
Profit/loss from business: +$22,974 (reported on 30.0% of returns)
Here:
+$22,974
State:
+$16,826
(% of AGI for various income ranges: 17.1% for AGIs $10k-25k, 12.4% for AGIs $25k-50k, 10.1% for AGIs $50k-75k, 9.3% for AGIs $75k-100k, 5.0% for AGIs over 100k)
IRA payment deduction: $3,686 (reported on 4.7% of returns)
91364:
$3,686
California:
$3,192
(% of AGI for various income ranges: 0.3% for AGIs $10k-25k, 0.4% for AGIs $25k-50k, 0.3% for AGIs $50k-75k, 0.4% for AGIs $75k-100k, 0.1% for AGIs over 100k)
Self-employed pension: $19,599 (reported on 3.9% of returns)
Here:
$19,599
California:
$17,688
(% of AGI for various income ranges: 0.2% for AGIs $10k-25k, 0.5% for AGIs $25k-50k, 0.8% for AGIs $50k-75k, 0.7% for AGIs $75k-100k, 0.8% for AGIs over 100k)
Total itemized deductions: $37,344 (23% of AGI, reported on 58.2% of returns)
Here:
$37,344
State:
$28,113
Here:
22.9% of AGI
State:
25.3% of AGI
(% of AGI for various income ranges: 34.0% for AGIs $10k-25k, 27.1% for AGIs $25k-50k, 27.9% for AGIs $50k-75k, 27.9% for AGIs $75k-100k, 17.7% for AGIs over 100k)
Charity contributions deductions: $4,358 (3% of AGI, reported on 51.7% of returns)
Here:
$4,358
State:
$3,923
Here:
2.6% of AGI
State:
3.3% of AGI
(% of AGI for various income ranges: 1.9% for AGIs $10k-25k, 2.1% for AGIs $25k-50k, 2.4% for AGIs $50k-75k, 2.5% for AGIs $75k-100k, 2.1% for AGIs over 100k)
Total tax: $22,400 (reported on 83.4% of returns)
91364:
$22,400
State:
$10,761
(% of AGI for various income ranges: 6.5% for AGIs $10k-25k, 8.6% for AGIs $25k-50k, 10.1% for AGIs $50k-75k, 10.9% for AGIs $75k-100k, 20.3% for AGIs over 100k)
Earned income credit: $1,210 (reported on 7.1% of returns)
Here:
$1,210
State:
$1,763
Percentage of individuals using paid preparers for their 2004 taxes: 75.8%
Here:
76%
State:
66%
(% for various income ranges: 69.8% for AGIs below $10k, 71.0% for AGIs $10k-25k, 73.9% for AGIs $25k-50k, 76.8% for AGIs $50k-75k, 78.3% for AGIs $75k-100k, 82.2% for AGIs over 100k)
Likely homosexual households (counted as self-reported same-sex unmarried-partner households)
Lesbian couples: 0.1% of all households
Gay men: 0.1% of all households
Household received Food Stamps/SNAP in the past 12 months: 377 Household did not receive Food Stamps/SNAP in the past 12 months: 9,907
Women who had a birth in the past 12 months: 309 (178 now married, 132 unmarried) Women who did not have a birth in the past 12 months: 6,294 (3,335 now married, 2,923 unmarried)
Housing units in zip code 91364 with a mortgage: 5,182 (683 second mortgage, 5 home equity loan, 567 both second mortgage and home equity loan) Houses without a mortgage: 85
Median monthly owner costs for units with a mortgage: $3,876 Median monthly owner costs for units without a mortgage: $1,240
Residents with income below the poverty level in 2022:
This zip code:
7.0%
Whole state:
12.2%
Residents with income below 50% of the poverty level in 2022:
This zip code:
1.8%
Whole state:
6.2%
Median number of rooms in houses and condos:
Here:
6.5
State:
6.0
Median number of rooms in apartments:
Here:
3.9
State:
3.9
Notable locations in this zip code not listed on our city pages
Notable locations in zip code 91364: Pacific Lodge Boys Home (A), Woodland Hills Country Club (B), Woodland Hills Branch Los Angeles Public Library (C). Display/hide their locations on the map
4,816 married couples with children.
994 single-parent households (307 men, 687 women).
64.1% of residents of 91364 zip code speak English at home.
9.0% of residents speak Spanish at home (79% very well, 14% well, 7% not well).
19.5% of residents speak other Indo-European language at home (67% very well, 21% well, 9% not well, 3% not at all).
5.4% of residents speak Asian or Pacific Island language at home (61% very well, 21% well, 17% not well, 1% not at all).
2.8% of residents speak other language at home (83% very well, 17% well).
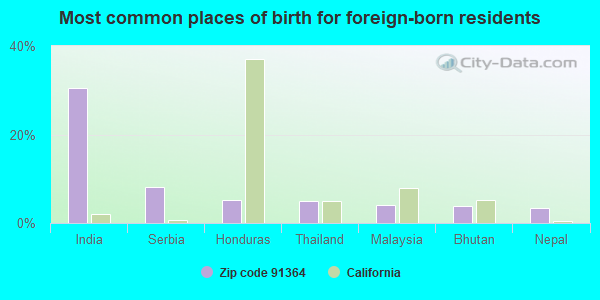
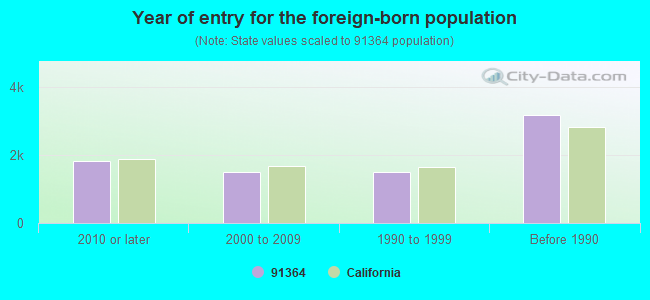
Foreign born population: 7,512 (26.3%) (71.7% of them are naturalized citizens)
This zip code:
26.3%
Whole state:
26.7%
31%India
8%Serbia
5%Honduras
5%Thailand
4%Malaysia
4%Bhutan
3%Nepal
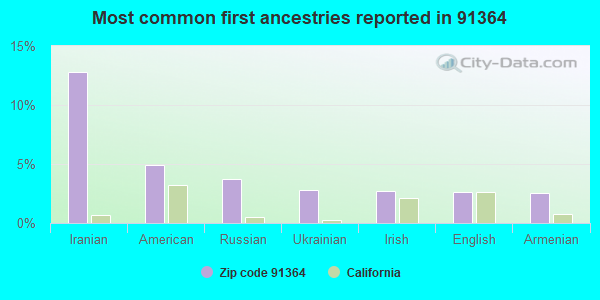
13%Iranian
5%American
4%Russian
3%Ukrainian
3%Irish
3%English
3%Armenian
Year of entry for the foreign-born population
1,8292010 or later
1,5122000 to 2009
1,5181990 to 1999
3,187Before 1990
Public high school in in zip code 91364 not listed on the city page:
Major facilities with environmental interests located in this zip code:
LA FIRE STATION 84 (5340 CANOGA AVE in WOODLAND HILLS, CA)
STATE MASTER (California - Hazardous Waste Tracking) - HAZARDOU WASTE PROGRAM Small Quantity Generators, between 100 kg and 1000 kg of hazardous waste/month (Resource Conservation and Recovery Act (tracking hazardous waste)) - notification Organizations: CITY OF LOS ANGELES (CONTACT/OWNER)
Alternative names: CITY OF LA GENERAL SERVICES
LAUSD EL CAMINO REAL HIGH SCHOOL (5440 VALLEY CIR BLVD in WOODLAND HILLS, CA)
STATE MASTER (California - Hazardous Waste Tracking) - HAZARDOU WASTE PROGRAM Small Quantity Generators, between 100 kg and 1000 kg of hazardous waste/month (Resource Conservation and Recovery Act (tracking hazardous waste)) - notification Alternative names: EL CAMINO REAL SENIOR HIGH, LAUSD - EL CAMINO REAL HS
EQUILON ENTERPRISES (20900 VENTURA BLVD in WOODLAND HILLS, CA) . Federal Facility
STATE MASTER (California - Hazardous Waste Tracking) - HAZARDOU WASTE PROGRAM Small Quantity Generators, between 100 kg and 1000 kg of hazardous waste/month (Resource Conservation and Recovery Act (tracking hazardous waste)) - notification Organizations: EQUILON ENTERPRISES, LLC (CONTACT/OWNER)
Alternative names: SHELL OIL CO
CHEVRON STATION NO 91925 (5356 CANOGA AVE in WOODLAND HILLS, CA)
STATE MASTER (California - Hazardous Waste Tracking) - HAZARDOU WASTE PROGRAM Small Quantity Generators, between 100 kg and 1000 kg of hazardous waste/month (Resource Conservation and Recovery Act (tracking hazardous waste)) - notification Organizations: CHEVRON PRODUCTS CO (CONTACT/OWNER)
CALABASH STREET ELEMENTARY (23055 EUGENE ST. in WOODLAND HILLS, CA)
(National Center for Education Statistics) - STATE ID-6016240 Organizations: LOS ANGELES UNIFIED (SCHOOL DISTRICT)
ALPHA ADVANCED SYST INC DBA RITE CLEAN (21931 in WOODLAND HILLS, CA)
Small Quantity Generators, between 100 kg and 1000 kg of hazardous waste/month (Resource Conservation and Recovery Act (tracking hazardous waste)) (Resource Conservation and Recovery Act (tracking hazardous waste)) Organizations: ALPHA ADVANCED CLEANERS (CONTACT/OWNER)
Alternative names: RITE CLEANERS
EXXONMOBIL OIL CORP NO 11473 (20101 VENTURA BLVD in WOODLAND HILLS, CA)
HAZARDOUS WASTE BIENNIAL REPORTER (Resource Conservation and Recovery Act (tracking hazardous waste)) Large Quantity Generators, more that 1000 kg of hazardous waste/month (Resource Conservation and Recovery Act (tracking hazardous waste)) Organizations: EXXONMOBIL OIL CORPORATION (CONTACT/OPERATOR)
Alternative names: EXXONMOBIL OIL CORP.
FLAIR INCORPORATED DBA FAZIO CLEANERS (23383 MULHOLLAND DRIVE in WOODLAND HILLS, CA)
CRITERIA AND HAZARDOUS AIR POLLUTANT INVENTORY (Inventory of air pollution sources) Small Quantity Generators, between 100 kg and 1000 kg of hazardous waste/month (Resource Conservation and Recovery Act (tracking hazardous waste)) - notification Business SIC classification: DRYCLEANING PLANTS, EXCEPT RUG CLEANING
LA WOODLAND HILLS LIBRARY (22200 VENTURA BLVD in WOODLAND HILLS, CA)
Small Quantity Generators, between 100 kg and 1000 kg of hazardous waste/month (Resource Conservation and Recovery Act (tracking hazardous waste)) - notification Organizations: CITY OF LOS ANGELES (CONTACT/OWNER)
CHIC CLEANERS (20929 VENTURA BLVD in WOODLAND HILLS, CA)
Small Quantity Generators, between 100 kg and 1000 kg of hazardous waste/month (Resource Conservation and Recovery Act (tracking hazardous waste)) - notification Organizations: SONG CHANG JOO (CONTACT/OWNER)
MOTION PICTURE AND TELEVISION FUND (23388 MULHOLLAND DR in WOODLAND HILLS, CA)
CRITERIA AND HAZARDOUS AIR POLLUTANT INVENTORY (Inventory of air pollution sources) Small Quantity Generators, between 100 kg and 1000 kg of hazardous waste/month (Resource Conservation and Recovery Act (tracking hazardous waste)) - notification Business SIC classification: SKILLED NURSING CARE FACILITIES Business NAICS classification: TRUST, FIDUCIARY, AND CUSTODY ACTIVITIES. Alternative names: MOTION PICTURE & TELEVISION FU
CELEBRITY CLEANERS (22812 VICTORY BLVD in WOODLAND HILLS, CA)
Small Quantity Generators, between 100 kg and 1000 kg of hazardous waste/month (Resource Conservation and Recovery Act (tracking hazardous waste)) - notification Organizations: KHANG CHAU (CONTACT/OWNER)
EXOTIC COLLISION CENTER INC (5332 TOPANGA CANYON BLVD in WOODLAND HILLS, CA)
Small Quantity Generators, between 100 kg and 1000 kg of hazardous waste/month (Resource Conservation and Recovery Act (tracking hazardous waste)) - notification
Housing units lacking complete plumbing facilities: 0.1% Housing units lacking complete kitchen facilities: 3.7%
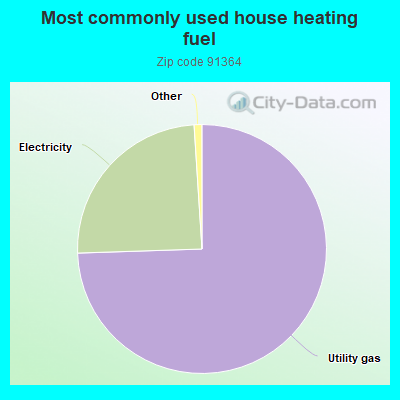
74.4%Utility gas
24.5%Electricity
Population in 1990: 25,638. Population change in the 1990s: +347 (+1.4%).
Place of birth for U.S.-born residents:
This state: 13,898
Northeast: 2,758
Midwest: 1,749
South: 1,365
West: 636
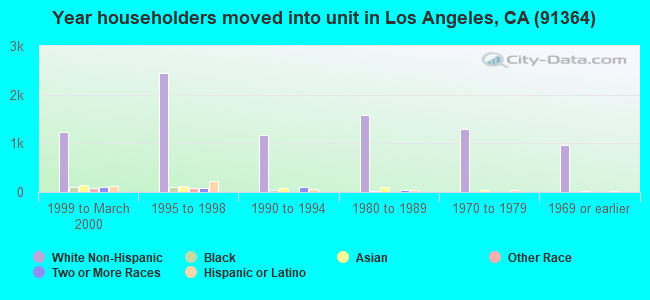
62% of the 91364 zip code residents lived in the same house 5 years ago. Out of people who lived in different houses, 81% lived in this county. Out of people who lived in different counties, 50% lived in California.
85% of the 91364 zip code residents lived in the same house 1 year ago. Out of people who lived in different houses, 75% moved from this county. Out of people who lived in different houses, 7% moved from different county within same state. Out of people who lived in different houses, 8% moved from different state. Out of people who lived in different houses, 6% moved from abroad.
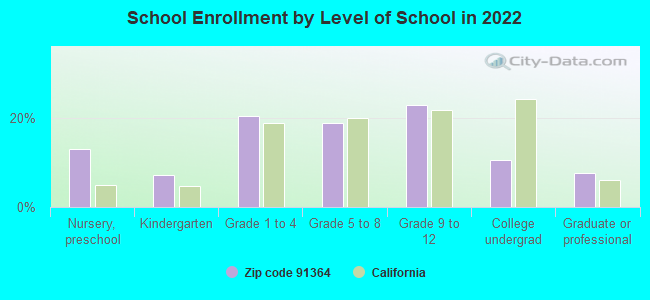
Private vs. public school enrollment:
Students in private schools in grades 1 to 8 (elementary and middle school): 620
Here:
25.6%
California:
10.5%
Students in private schools in grades 9 to 12 (high school): 244
Here:
17.6%
California:
8.5%
Students in private undergraduate colleges: 91
Here:
14.3%
California:
15.9%
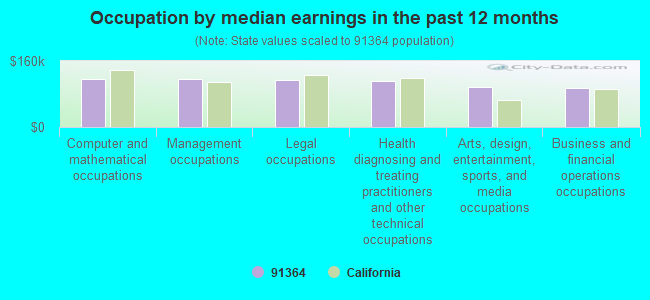
Occupation by median earnings in the past 12 months ($)
117,137Computer and mathematical occupations
115,947Management occupations
114,587Legal occupations
112,519Health diagnosing and treating practitioners and other technical occupations
96,604Arts, design, entertainment, sports, and media occupations
94,481Business and financial operations occupations
Companies with federal contracts located in this zip code (WOODLAND HILLS, CA):
LAVENDER INDUSTRIES INC (22647 VENTURA BLVD #1020; small business)
$98,079 with Air Force for Other Research and Development -- Basic Research (R&D). Signed on 2006-04-19. Completion date: 2007-01-08.
VILIM, KATHLEEN (21799 VENTURA BLVD)
$32,648 with Department of Defense for ADP Facility Operation and Maintenance Services. Signed on 2002-03-08. Completion date: 2002-03-30.
SANTUCCI, SANDRA (4432 ENSENADA DR; small business) : $23,620 in 4 contractsfrom 2002 to 2004
$33,444 with Department of Defense for Radio and Television Communication Equipment, Except Airborne. Signed on 2002-09-28. Completion date: 2002-11-12.
$12,120 with Navy for Video Recording and Reproducing Equipment. Signed on 2002-12-18. Completion date: 2003-01-17.
$11,500, same as above.Signed on 2004-09-27. Completion date: 2004-10-27.
-$33,444 with Department of Defense for Radio and Television Communication Equipment, Except Airborne. Signed on 2003-01-02. Completion date: 2002-11-12.
PIERSOL, ALLAN (23021 BRENFORD ST; small business) : $21,152 in 5 contractsfrom 2003 to 2004
Contracts for Other Professional Services by Army Signed by year:2000: $0; 2001: $0; 2002: $0; 2003: $22,200; 2004: -$1,048; 2005: $0; 2006: $0.
Biggest contracts:
$8,800 with Army for Other Professional Services. Signed on 2003-11-17. Completion date: 2003-07-31.
$8,000, same as above.Signed on 2003-07-03. Completion date: 2003-07-31.
$4,000, same as above.Signed on 2003-07-03. Completion date: 2003-07-31.
$1,400, same as above.Signed on 2003-09-22. Completion date: 2003-07-31.
BERNARD'S OFFICE FURNITURE INC (22049 VENTURA BLVD; small business)
$18,187 with Air Force for Office Furniture. Signed on 2005-09-30. Completion date: 2005-12-29.
Top industries in this zip code by the number of employees in 2005:
Administrative and Support and Waste Management and Remediation Services: Temporary Help Services (500-999 employees: 1 establishment, 250-499 employees: 1 establishment, 100-249 employees: 2 establishments, 50-99 employees: 1 establishment, 20-49 employees: 2 establishments, 10-19 employees: 1 establishment, 5-9 employees: 2 establishments, 1-4 employees: 1 establishment)
2005 - 2018 National Fire Incident Reporting System (NFIRS) incidents
According to the data from the years 2005 - 2018 the average number of fires per year is 35. The highest number of fires - 55 took place in 2005, and the least - 20 in 2017. The data has a dropping trend.
When looking into fire subcategories, the most reports belonged to: Structure Fires (44.4%), and Outside Fires (30.3%).
Fire incident types reported to NFIRS in Zip Code 91364


 Nearest zip codes: 91367, 91371, 91303, 91356, 90290, 91306.


 (Students: 830, Location: 5461 WINNETKA AVE., Grades: KG-12, Charter school)
 According to the data from the years 2005 - 2018 the average number of fires per year is 35. The highest number of fires - 55 took place in 2005, and the least - 20 in 2017. The data has a dropping trend.
 When looking into fire subcategories, the most reports belonged to: Structure Fires (44.4%), and Outside Fires (30.3%).