Estimated zip code population in 2022: 43,190 Zip code population in 2010: 44,958 Zip code population in 2000: 45,348
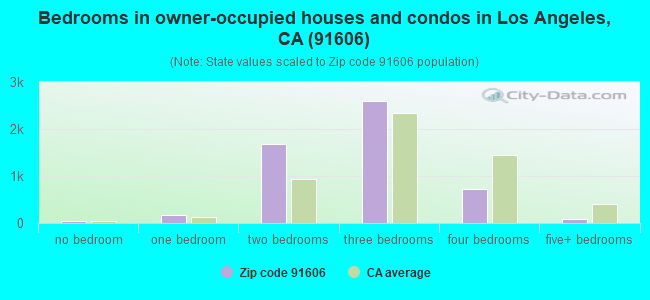
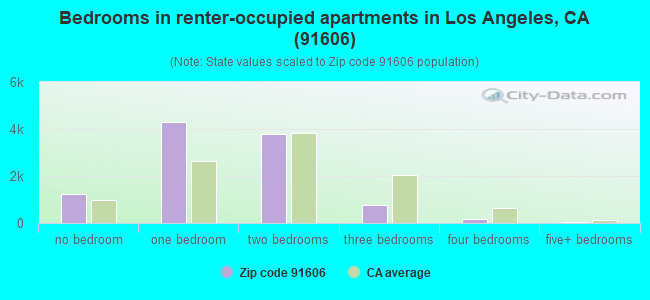
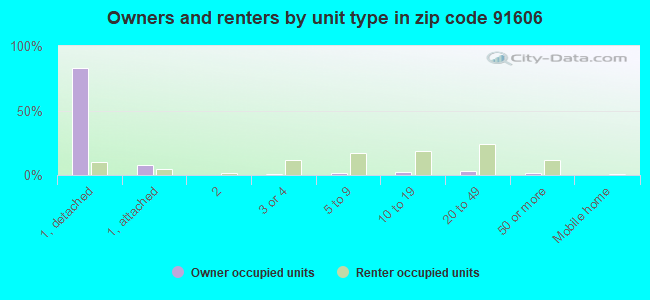
Houses and condos: 16,622 Renter-occupied apartments: 10,266
% of renters here:
66%
State:
44%
March 2022 cost of living index in zip code 91606: 140.7 (very high, U.S. average is 100)
Land area: 3.3 sq. mi. Water area: 0.0 sq. mi.
Population density: 12,960 people per square mile
(very high).
OSM Map
General Map
Google Map
MSN Map
OSM Map
General Map
Google Map
MSN Map
OSM Map
General Map
Google Map
MSN Map
OSM Map
General Map
Google Map
MSN Map
Please wait while loading the map...
Real estate property taxes paid for housing units in 2022:
This zip code:
0.6% ($4,641)
California:
0.7% ($4,831)
Median real estate property taxes paid for housing units with mortgages in 2022: $5,167 (0.6%) Median real estate property taxes paid for housing units with no mortgage in 2022: $3,237 (0.4%)
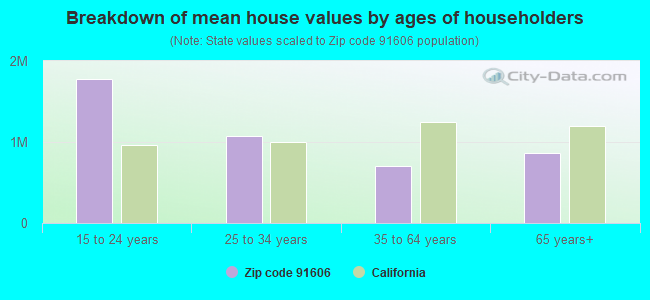
Estimated median house/condo value in 2022: $829,154
91606:
$829,154
California:
$715,900
According to our research of California and other state lists, there were 33 registered sex offenders living in 91606 zip code as of April 27, 2024. The ratio of all residents to sex offenders in zip code 91606 is 1,384 to 1. The ratio of registered sex offenders to all residents in this zip code is lower than the state average.
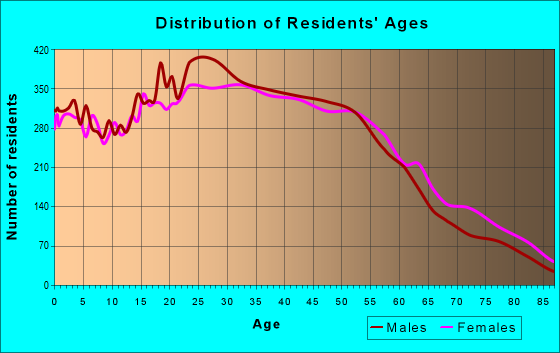
Median resident age:
This zip code:
38.0 years
California median age:
37.9 years
Average household size:
This zip code:
2.7 people
California:
2.8 people
Averages for the 2020 tax year for zip code 91606, filed in 2021:
Average Adjusted Gross Income (AGI) in 2020: $46,424 (Individual Income Tax Returns)
Here:
$46,424
State:
$95,910
Salary/wage: $43,460 (reported on 79.5% of returns)
Here:
$43,460
State:
$77,331
(% of AGI for various income ranges: 1186.3% for AGIs below $25k, 4123.5% for AGIs $25k-50k, 7669.1% for AGIs $50k-75k, 12150.6% for AGIs $75k-100k, 22494.4% for AGIs $100k-200k, 71973.0% for AGIs over 200k)
Taxable interest for individuals: $686 (reported on 21.3% of returns)
This zip code:
$686
California:
$2,294
(% of AGI for various income ranges: 11.2% for AGIs below $25k, 11.8% for AGIs $25k-50k, 21.1% for AGIs $50k-75k, 61.8% for AGIs $75k-100k, 102.7% for AGIs $100k-200k, 314.0% for AGIs over 200k)
Ordinary dividends: $2,443 (reported on 9.2% of returns)
Here:
$2,443
State:
$10,949
(% of AGI for various income ranges: 11.2% for AGIs below $25k, 13.1% for AGIs $25k-50k, 38.8% for AGIs $50k-75k, 83.3% for AGIs $75k-100k, 122.2% for AGIs $100k-200k, 1251.0% for AGIs over 200k)
Net capital gain/loss in AGI: +$6,616 (reported on 9.7% of returns)
Here:
+$6,616
State:
+$49,306
(% of AGI for various income ranges: 2.4% for AGIs below $25k, 14.4% for AGIs $25k-50k, 49.7% for AGIs $50k-75k, 121.1% for AGIs $75k-100k, 426.8% for AGIs $100k-200k, 7633.0% for AGIs over 200k)
Profit/loss from business: +$8,310 (reported on 28.1% of returns)
Here:
+$8,310
State:
+$15,671
(% of AGI for various income ranges: 347.1% for AGIs below $25k, 268.4% for AGIs $25k-50k, 324.4% for AGIs $50k-75k, 505.1% for AGIs $75k-100k, 860.8% for AGIs $100k-200k, 3372.0% for AGIs over 200k)
Taxable individual retirement arrangement distribution: $13,233 (reported on 3.0% of returns)
91606:
$13,233
California:
$23,505
(% of AGI for various income ranges: 25.7% for AGIs below $25k, 30.4% for AGIs $25k-50k, 68.9% for AGIs $50k-75k, 177.6% for AGIs $75k-100k, 240.4% for AGIs $100k-200k, 1070.0% for AGIs over 200k)
Self-employed (Keogh) retirement plans: $17,575 (reported on 0.2% of returns)
91606:
$17,575
California:
$30,163
(% of AGI for various income ranges: 91.3% for AGIs $100k-200k)
Total itemized deductions: $34,423 (reported on 8.9% of returns)
Here:
$34,423
State:
$39,517
(% of AGI for various income ranges: 66.7% for AGIs below $25k, 157.6% for AGIs $25k-50k, 451.6% for AGIs $50k-75k, 981.3% for AGIs $75k-100k, 2471.4% for AGIs $100k-200k, 19304.0% for AGIs over 200k)
Charity contributions: $4,545 (reported on 6.9% of returns)
Here:
$4,545
State:
$12,598
(% of AGI for various income ranges: 2.1% for AGIs below $25k, 12.4% for AGIs $25k-50k, 38.5% for AGIs $50k-75k, 119.9% for AGIs $75k-100k, 324.4% for AGIs $100k-200k, 1758.0% for AGIs over 200k)
Taxes paid: $8,041 (reported on 8.9% of returns)
91606:
$8,041
State:
$8,807
(% of AGI for various income ranges: 16.0% for AGIs below $25k, 40.0% for AGIs $25k-50k, 125.3% for AGIs $50k-75k, 305.7% for AGIs $75k-100k, 752.2% for AGIs $100k-200k, 1989.0% for AGIs over 200k)
Earned income credit: $1,824 (reported on 20.0% of returns)
Here:
$1,824
State:
$2,074
(% of AGI for various income ranges: 93.7% for AGIs below $25k, 68.8% for AGIs $25k-50k, 0.9% for AGIs $50k-75k)
Percentage of individuals using paid preparers for their 2020 taxes: 92.2%
Here:
92%
State:
92%
(% for various income ranges: 90.5% for AGIs below $25k, 92.9% for AGIs $25k-50k, 93.6% for AGIs $50k-75k, 95.1% for AGIs $75k-100k, 93.2% for AGIs $100k-200k, 91.7% for AGIs over 200k)
Averages for the 2012 tax year for zip code 91606, filed in 2013:
Average Adjusted Gross Income (AGI) in 2012: $35,204 (Individual Income Tax Returns)
Here:
$35,204
State:
$72,726
Salary/wage: $34,648 (reported on 82.9% of returns)
Here:
$34,648
State:
$59,079
(% of AGI for various income ranges: 73.3% for AGIs below $25k, 86.7% for AGIs $25k-50k, 85.9% for AGIs $50k-75k, 83.9% for AGIs $75k-100k, 82.5% for AGIs $100k-200k, 62.4% for AGIs over 200k)
Taxable interest for individuals: $658 (reported on 20.7% of returns)
This zip code:
$658
California:
$2,146
(% of AGI for various income ranges: 0.6% for AGIs below $25k, 0.3% for AGIs $25k-50k, 0.3% for AGIs $50k-75k, 0.4% for AGIs $75k-100k, 0.3% for AGIs $100k-200k, 0.6% for AGIs over 200k)
Ordinary dividends: $2,394 (reported on 7.2% of returns)
Here:
$2,394
State:
$9,308
(% of AGI for various income ranges: 0.6% for AGIs below $25k, 0.3% for AGIs $25k-50k, 0.4% for AGIs $50k-75k, 0.7% for AGIs $75k-100k, 0.6% for AGIs $100k-200k, 0.5% for AGIs over 200k)
Net capital gain/loss in AGI: +$2,988 (reported on 6.2% of returns)
Here:
+$2,988
State:
+$30,460
(% of AGI for various income ranges: 0.2% for AGIs $25k-50k, 0.1% for AGIs $50k-75k, 0.5% for AGIs $75k-100k, 0.9% for AGIs $100k-200k, 4.3% for AGIs over 200k)
Profit/loss from business: +$9,245 (reported on 25.9% of returns)
Here:
+$9,245
State:
+$17,064
(% of AGI for various income ranges: 18.2% for AGIs below $25k, 5.6% for AGIs $25k-50k, 3.5% for AGIs $50k-75k, 3.2% for AGIs $75k-100k, 3.0% for AGIs $100k-200k, 4.6% for AGIs over 200k)
Taxable individual retirement arrangement distribution: $10,338 (reported on 3.4% of returns)
91606:
$10,338
California:
$19,557
(% of AGI for various income ranges: 1.0% for AGIs below $25k, 0.7% for AGIs $25k-50k, 0.9% for AGIs $50k-75k, 1.4% for AGIs $75k-100k, 1.5% for AGIs $100k-200k)
Self-employment retirement plans: $9,700 (reported on 0.2% of returns)
91606:
$9,700
California:
$24,530
Total itemized deductions: $22,688 (32% of AGI, reported on 22.8% of returns)
Here:
$22,688
State:
$34,004
Here:
32.1% of AGI
State:
22.7% of AGI
(% of AGI for various income ranges: 8.6% for AGIs below $25k, 11.1% for AGIs $25k-50k, 15.7% for AGIs $50k-75k, 19.7% for AGIs $75k-100k, 20.4% for AGIs $100k-200k, 22.3% for AGIs over 200k)
Charity contributions: $2,211 (reported on 17.3% of returns)
Here:
$2,211
State:
$4,659
(% of AGI for various income ranges: 0.3% for AGIs below $25k, 0.7% for AGIs $25k-50k, 1.2% for AGIs $50k-75k, 1.5% for AGIs $75k-100k, 1.8% for AGIs $100k-200k, 2.1% for AGIs over 200k)
Taxes paid: $6,449 (reported on 22.7% of returns)
91606:
$6,449
State:
$14,448
(% of AGI for various income ranges: 1.7% for AGIs below $25k, 2.4% for AGIs $25k-50k, 4.2% for AGIs $50k-75k, 6.0% for AGIs $75k-100k, 7.2% for AGIs $100k-200k, 8.3% for AGIs over 200k)
Earned income credit: $2,229 (reported on 28.1% of returns)
Here:
$2,229
State:
$2,286
(% of AGI for various income ranges: 7.4% for AGIs below $25k, 1.4% for AGIs $25k-50k)
Percentage of individuals using paid preparers for their 2012 taxes: 75.1%
Here:
75%
State:
64%
(% for various income ranges: 75.4% for AGIs below $25k, 75.3% for AGIs $25k-50k, 74.8% for AGIs $50k-75k, 73.5% for AGIs $75k-100k, 72.2% for AGIs $100k-200k, 83.3% for AGIs over 200k)
Averages for the 2004 tax year for zip code 91606, filed in 2005:
Average Adjusted Gross Income (AGI) in 2004: $30,704 (Individual Income Tax Returns)
Here:
$30,704
State:
$58,600
Salary/wage: $30,077 (reported on 85.1% of returns)
Here:
$30,077
State:
$49,455
(% of AGI for various income ranges: 100.1% for AGIs below $10k, 81.4% for AGIs $10k-25k, 88.3% for AGIs $25k-50k, 86.6% for AGIs $50k-75k, 87.0% for AGIs $75k-100k, 67.0% for AGIs over 100k)
Taxable interest for individuals: $1,055 (reported on 29.1% of returns)
This zip code:
$1,055
California:
$2,365
(% of AGI for various income ranges: 2.6% for AGIs below $10k, 0.9% for AGIs $10k-25k, 0.8% for AGIs $25k-50k, 0.9% for AGIs $50k-75k, 0.8% for AGIs $75k-100k, 1.6% for AGIs over 100k)
Taxable dividends: $1,951 (reported on 9.2% of returns)
Here:
$1,951
State:
$4,746
(% of AGI for various income ranges: 1.7% for AGIs below $10k, 0.4% for AGIs $10k-25k, 0.4% for AGIs $25k-50k, 0.6% for AGIs $50k-75k, 0.6% for AGIs $75k-100k, 1.0% for AGIs over 100k)
Net capital gain/loss: +$8,299 (reported on 7.8% of returns)
Here:
+$8,299
State:
+$23,418
(% of AGI for various income ranges: -0.6% for AGIs below $10k, -0.1% for AGIs $10k-25k, 0.2% for AGIs $25k-50k, 0.4% for AGIs $50k-75k, 0.9% for AGIs $75k-100k, 12.0% for AGIs over 100k)
Profit/loss from business: +$8,503 (reported on 22.7% of returns)
Here:
+$8,503
State:
+$16,826
(% of AGI for various income ranges: 34.6% for AGIs below $10k, 12.0% for AGIs $10k-25k, 4.7% for AGIs $25k-50k, 3.9% for AGIs $50k-75k, 2.2% for AGIs $75k-100k, 3.7% for AGIs over 100k)
IRA payment deduction: $2,848 (reported on 1.8% of returns)
91606:
$2,848
California:
$3,192
(% of AGI for various income ranges: 0.1% for AGIs below $10k, 0.1% for AGIs $10k-25k, 0.2% for AGIs $25k-50k, 0.2% for AGIs $50k-75k, 0.2% for AGIs $75k-100k, 0.2% for AGIs over 100k)
Self-employed pension: $9,604 (reported on 0.3% of returns)
Here:
$9,604
California:
$17,688
Total itemized deductions: $19,061 (33% of AGI, reported on 25.9% of returns)
Here:
$19,061
State:
$28,113
Here:
32.6% of AGI
State:
25.3% of AGI
(% of AGI for various income ranges: 14.0% for AGIs below $10k, 9.5% for AGIs $10k-25k, 14.3% for AGIs $25k-50k, 20.3% for AGIs $50k-75k, 21.9% for AGIs $75k-100k, 19.2% for AGIs over 100k)
Charity contributions deductions: $2,133 (3% of AGI, reported on 21.3% of returns)
Here:
$2,133
State:
$3,923
Here:
3.5% of AGI
State:
3.3% of AGI
(% of AGI for various income ranges: 0.6% for AGIs below $10k, 0.5% for AGIs $10k-25k, 1.2% for AGIs $25k-50k, 1.9% for AGIs $50k-75k, 2.1% for AGIs $75k-100k, 2.4% for AGIs over 100k)
Total tax: $3,648 (reported on 69.3% of returns)
91606:
$3,648
State:
$10,761
(% of AGI for various income ranges: 6.7% for AGIs below $10k, 4.2% for AGIs $10k-25k, 6.0% for AGIs $25k-50k, 8.6% for AGIs $50k-75k, 10.4% for AGIs $75k-100k, 16.1% for AGIs over 100k)
Earned income credit: $1,820 (reported on 27.8% of returns)
Here:
$1,820
State:
$1,763
Percentage of individuals using paid preparers for their 2004 taxes: 78.1%
Here:
78%
State:
66%
(% for various income ranges: 73.7% for AGIs below $10k, 81.1% for AGIs $10k-25k, 77.4% for AGIs $25k-50k, 77.7% for AGIs $50k-75k, 77.2% for AGIs $75k-100k, 81.8% for AGIs over 100k)
Likely homosexual households (counted as self-reported same-sex unmarried-partner households)
Lesbian couples: 0.3% of all households
Gay men: 0.3% of all households
Household received Food Stamps/SNAP in the past 12 months: 2,666 Household did not receive Food Stamps/SNAP in the past 12 months: 13,086
Women who had a birth in the past 12 months: 463 (385 now married, 76 unmarried) Women who did not have a birth in the past 12 months: 10,689 (3,798 now married, 6,908 unmarried)
Housing units in zip code 91606 with a mortgage: 3,965 (358 second mortgage, 47 home equity loan, 269 both second mortgage and home equity loan) Houses without a mortgage: 95
Median monthly owner costs for units with a mortgage: $2,802 Median monthly owner costs for units without a mortgage: $707
Residents with income below the poverty level in 2022:
This zip code:
18.5%
Whole state:
12.2%
Residents with income below 50% of the poverty level in 2022:
This zip code:
12.4%
Whole state:
6.2%
Median number of rooms in houses and condos:
Here:
5.3
State:
6.0
Median number of rooms in apartments:
Here:
3.2
State:
3.9
Notable locations in this zip code not listed on our city pages
Shopping Centers: Victory Plaza Shopping Center (1), Valley Plaza Shopping Center (2), Laurel Plaza Shopping Center (3). Display/hide their locations on the map
Churches in zip code 91606 include: Centro Familiar Christiano (A), East Valley Congregational Church (B), First Southern Baptist Church (C), Saint Patrick's Catholic Church (D), Emmanuel Lutheran Church (E), Iglesia Evangelica Bethel (F), Saint Jane Frances Catholic Church (G). Display/hide their locations on the map
4,462 married couples with children.
2,315 single-parent households (534 men, 1,781 women).
33.4% of residents of 91606 zip code speak English at home.
46.8% of residents speak Spanish at home (56% very well, 20% well, 18% not well, 6% not at all).
16.2% of residents speak other Indo-European language at home (52% very well, 21% well, 18% not well, 10% not at all).
2.6% of residents speak Asian or Pacific Island language at home (50% very well, 33% well, 13% not well, 4% not at all).
1.6% of residents speak other language at home (86% very well, 4% well, 8% not well, 1% not at all).
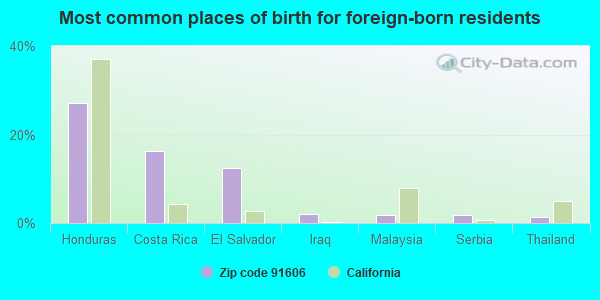
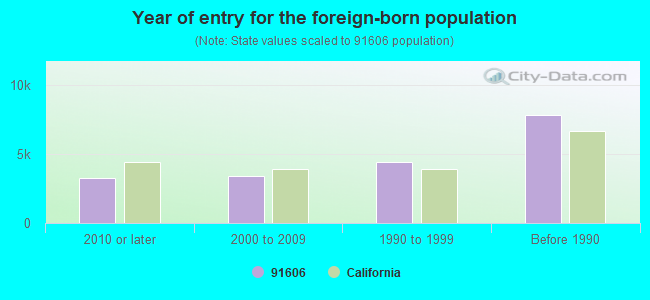
Foreign born population: 18,402 (42.6%) (63.1% of them are naturalized citizens)
This zip code:
42.6%
Whole state:
26.7%
27%Honduras
16%Costa Rica
12%El Salvador
2%Iraq
2%Malaysia
2%Serbia
1%Thailand
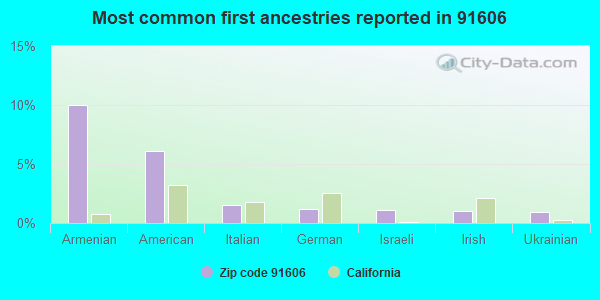
10%Armenian
6%American
2%Italian
1%German
1%Israeli
1%Irish
1%Ukrainian
Year of entry for the foreign-born population
3,2832010 or later
3,4392000 to 2009
4,4171990 to 1999
7,840Before 1990
Major facilities with environmental interests located in this zip code:
EAST VALLEY NEW MS NO 1 (6501 LAUREL CANYON BLVD in N HOLLYWOOD, CA)
STATE MASTER (California - Hazardous Waste Tracking) - HAZARDOU WASTE PROGRAM Large Quantity Generators, more that 1000 kg of hazardous waste/month (Resource Conservation and Recovery Act (tracking hazardous waste)) Organizations: E VALLEY NEW MS 1 (CONTACT/OPERATOR)
, LAUSD (CONTACT/OWNER)
FAIR EL (6501 FAIR AVE in NORTH HOLLYWOOD, CA)
STATE MASTER (California - Hazardous Waste Tracking) - HAZARDOU WASTE PROGRAM Small Quantity Generators, between 100 kg and 1000 kg of hazardous waste/month (Resource Conservation and Recovery Act (tracking hazardous waste)) - notification Organizations: LAUSD (CONTACT/OWNER)
Alternative names: FAIR AVENUE ELEMENTARY, LAUSD/FAIR AVE ELEM
LA USD OXNARD EL (10912 OXNARD ST in NORTH HOLLYWOOD, CA)
STATE MASTER (California - Hazardous Waste Tracking) - HAZARDOU WASTE PROGRAM Small Quantity Generators, between 100 kg and 1000 kg of hazardous waste/month (Resource Conservation and Recovery Act (tracking hazardous waste)) - notification Alternative names: LAUSD/OXNARD ST ELEM, OXNARD STREET ELEMENTARY
MONLUX (JOHN B.) ELEMENTARY (6051 BELLAIRE AVE. in NORTH HOLLYWOOD, CA)
(National Center for Education Statistics) - STATE ID-6018196 Organizations: LOS ANGELES UNIFIED (SCHOOL DISTRICT)
A-1 CLEANER (12902 1/2 VICTORY BLVD in NORTH HOLLYWOOD, CA)
(Resource Conservation and Recovery Act (tracking hazardous waste)) Organizations: CHANG SOK IN (CONTACT/OWNER)
ANDRES AUTO BODY PAINT (10537 VICTORY BOULEVARD in NORTH HOLLYWOOD, CA)
CRITERIA AND HAZARDOUS AIR POLLUTANT INVENTORY (Inventory of air pollution sources) Small Quantity Generators, between 100 kg and 1000 kg of hazardous waste/month (Resource Conservation and Recovery Act (tracking hazardous waste)) Business SIC classification: GENERAL AUTOMOTIVE REPAIR SHOPS Organizations: DUQUETTE ANDRE (CONTACT/OWNER)
GARO'S FOREIGN AUTO (6708 LANKERSHIM BLVD. in NORTH HOLLYWOOD, CA)
Small Quantity Generators, between 100 kg and 1000 kg of hazardous waste/month (Resource Conservation and Recovery Act (tracking hazardous waste)) - notification Organizations: GARO BEDJOIAN (CONTACT/OWNER)
INVASION INC (6709 LANKERSHIM in NORTH HOLLYWOOD, CA)
Small Quantity Generators, between 100 kg and 1000 kg of hazardous waste/month (Resource Conservation and Recovery Act (tracking hazardous waste)) - notification Organizations: SAMSON MASSACAI (CONTACT/OWNER)
L A RADIATOR NORTH HOLLYWOOD (6111 VINELAND AVE in NORTH HOLLYWOOD, CA)
Small Quantity Generators, between 100 kg and 1000 kg of hazardous waste/month (Resource Conservation and Recovery Act (tracking hazardous waste)) Organizations: ARDASHES KARAIAN (CONTACT/OWNER)
ANZA MANAGEMENT (6340 LANKERSHIM BLVD in N HOLLYWOOD, CA)
COMPLIANCE ACTIVITY (Tracking inspections of insecticide, fungicide, and rodenticide, and toxic substances)
ECONO CLEANERS (6108 LANKERSHIM BLVD in NORTH HOLLYWOOD, CA)
Small Quantity Generators, between 100 kg and 1000 kg of hazardous waste/month (Resource Conservation and Recovery Act (tracking hazardous waste)) - notification Organizations: JASHINKOO (CONTACT/OWNER)
GLO TONE CLEANERS (12508 OXNARD ST in NORTH HOLLYWOOD, CA)
Small Quantity Generators, between 100 kg and 1000 kg of hazardous waste/month (Resource Conservation and Recovery Act (tracking hazardous waste))
MODERN TECH SCHOOL OF X RAY (6180 LAUREL CANYON BLVD in NORTH HOLLYWOOD, CA)
Small Quantity Generators, between 100 kg and 1000 kg of hazardous waste/month (Resource Conservation and Recovery Act (tracking hazardous waste)) - notification
Housing units lacking complete plumbing facilities: 0.7% Housing units lacking complete kitchen facilities: 2.9%
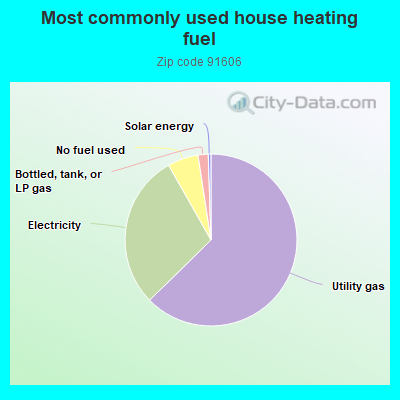
62.6%Utility gas
29.1%Electricity
5.8%No fuel used
1.9%Bottled, tank, or LP gas
0.5%Solar energy
Population in 1990: 39,737. Population change in the 1990s: +5,611 (+14.1%).
Place of birth for U.S.-born residents:
This state: 18,333
Northeast: 1,720
Midwest: 1,407
South: 1,728
West: 839
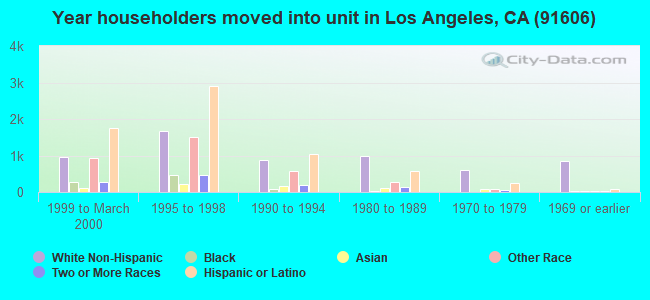
54% of the 91606 zip code residents lived in the same house 5 years ago. Out of people who lived in different houses, 90% lived in this county. Out of people who lived in different counties, 50% lived in California.
92% of the 91606 zip code residents lived in the same house 1 year ago. Out of people who lived in different houses, 73% moved from this county. Out of people who lived in different houses, 9% moved from different county within same state. Out of people who lived in different houses, 15% moved from different state. Out of people who lived in different houses, 4% moved from abroad.
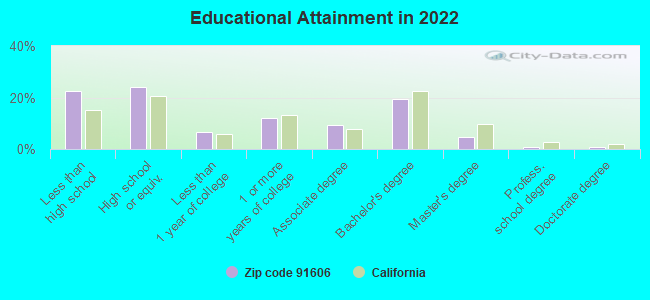
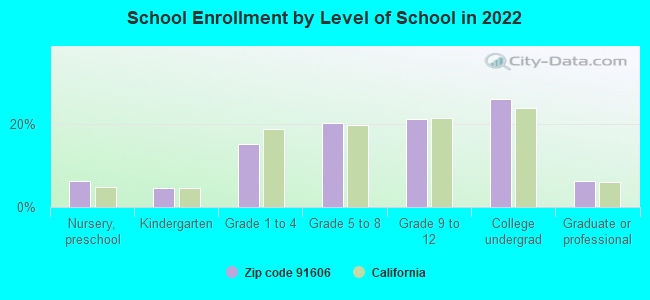
Private vs. public school enrollment:
Students in private schools in grades 1 to 8 (elementary and middle school): 209
Here:
6.1%
California:
10.5%
Students in private schools in grades 9 to 12 (high school): 123
Here:
6.0%
California:
8.5%
Students in private undergraduate colleges: 393
Here:
15.5%
California:
15.9%
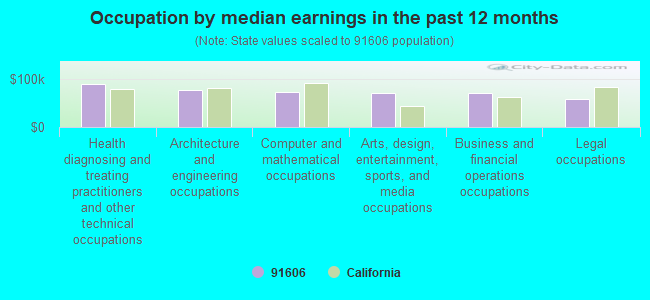
Occupation by median earnings in the past 12 months ($)
90,222Health diagnosing and treating practitioners and other technical occupations
77,449Architecture and engineering occupations
74,251Computer and mathematical occupations
71,894Arts, design, entertainment, sports, and media occupations
71,490Business and financial operations occupations
59,051Legal occupations
Companies with federal contracts located in this zip code:
THE SPACECONNECTION, INC (10530 VICTORY BLVD in NORTH HOLLYWOO, CA; small business)
$90,000 with Navy for Plumbing Fixtures and Accessories. Signed on 2003-12-30. Completion date: 2003-12-31.
PREMIER LIGHTING & PRODUCTION (12023 VICTORY BLVD in NORTH HOLLYWOO, CA; small business)
$3,546 with American Forces Information Service for Cable, Cord, and Wire Assemblies: Communications Equipment. Signed on 2004-01-09. Completion date: 2004-01-15.
Top industries in this zip code by the number of employees in 2005:
Management of Companies and Enterprises: Corporate, Subsidiary, and Regional Managing Offices (500-999 employees: 1 establishment, 1-4 employees: 1 establishment)
Finance and Insurance: Insurance Agencies and Brokerages (250-499: 1, 50-99: 1, 10-19: 2, 5-9: 2, 1-4: 5)
2005 - 2018 National Fire Incident Reporting System (NFIRS) incidents
Based on the data from the years 2005 - 2018 the average number of fire incidents per year is 67. The highest number of reported fires - 90 took place in 2013, and the least - 47 in 2005. The data has a rising trend.
When looking into fire subcategories, the most reports belonged to: Structure Fires (41.7%), and Outside Fires (32.3%).
Fire incident types reported to NFIRS in Zip Code 91606
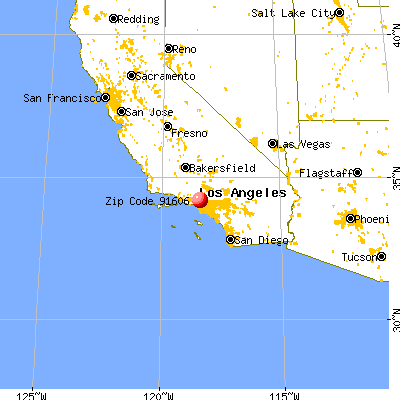


 Nearest zip codes: 91601, 91607, 91605, 91602, 91505, 91401.
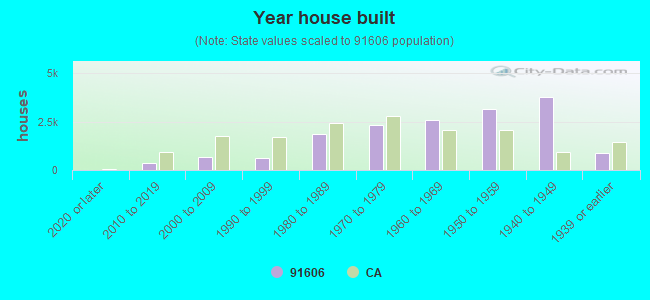


 Based on the data from the years 2005 - 2018 the average number of fire incidents per year is 67. The highest number of reported fires - 90 took place in 2013, and the least - 47 in 2005. The data has a rising trend.
 When looking into fire subcategories, the most reports belonged to: Structure Fires (41.7%), and Outside Fires (32.3%).