Estimated zip code population in 2022: 18,513 Zip code population in 2010: 17,403 Zip code population in 2000: 16,468
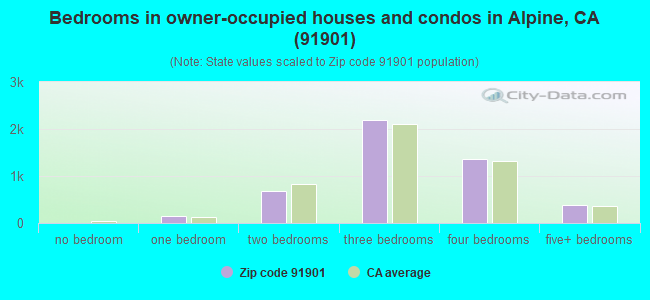
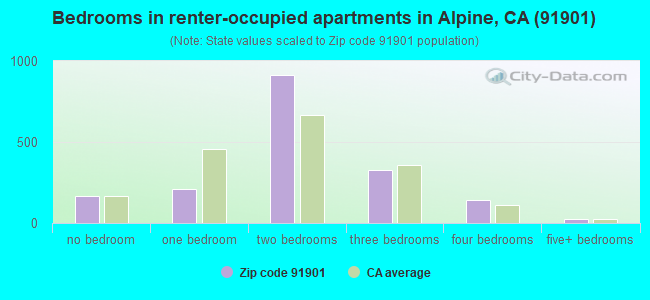
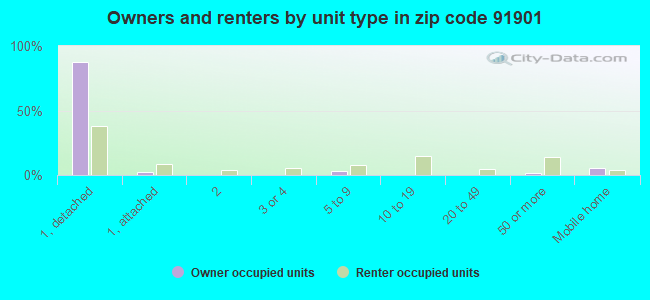
Houses and condos: 6,759 Renter-occupied apartments: 1,781
% of renters here:
27%
State:
44%
March 2022 cost of living index in zip code 91901: 121.6 (high, U.S. average is 100)
Land area: 89.3 sq. mi. Water area: 0.8 sq. mi.
Population density: 207 people per square mile
(very low).
OSM Map
General Map
Google Map
MSN Map
OSM Map
General Map
Google Map
MSN Map
OSM Map
General Map
Google Map
MSN Map
OSM Map
General Map
Google Map
MSN Map
Please wait while loading the map...
Real estate property taxes paid for housing units in 2022:
This zip code:
0.7% ($5,451)
California:
0.7% ($4,831)
Median real estate property taxes paid for housing units with mortgages in 2022: $5,849 (0.7%) Median real estate property taxes paid for housing units with no mortgage in 2022: $3,844 (0.5%)
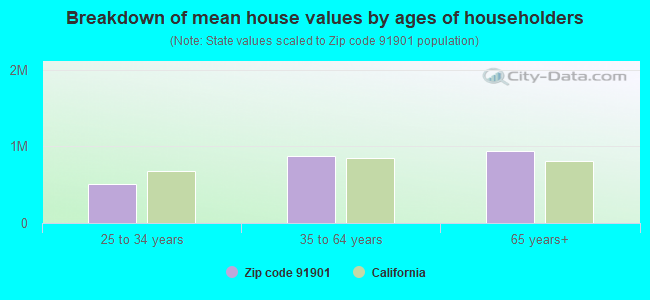
Estimated median house/condo value in 2022: $803,528
91901:
$803,528
California:
$715,900
According to our research of California and other state lists, there were 17 registered sex offenders living in 91901 zip code as of April 27, 2024. The ratio of all residents to sex offenders in zip code 91901 is 1,109 to 1. The ratio of registered sex offenders to all residents in this zip code is lower than the state average.
Median resident age:
This zip code:
42.7 years
California median age:
37.9 years
Average household size:
This zip code:
2.8 people
California:
2.8 people
Averages for the 2020 tax year for zip code 91901, filed in 2021:
Average Adjusted Gross Income (AGI) in 2020: $100,049 (Individual Income Tax Returns)
Here:
$100,049
State:
$95,910
Salary/wage: $80,547 (reported on 77.4% of returns)
Here:
$80,547
State:
$77,331
(% of AGI for various income ranges: 1125.0% for AGIs below $25k, 3653.2% for AGIs $25k-50k, 6280.8% for AGIs $50k-75k, 9169.1% for AGIs $75k-100k, 18186.3% for AGIs $100k-200k, 66284.3% for AGIs over 200k)
Taxable interest for individuals: $1,444 (reported on 43.6% of returns)
This zip code:
$1,444
California:
$2,294
(% of AGI for various income ranges: 21.9% for AGIs below $25k, 22.3% for AGIs $25k-50k, 57.9% for AGIs $50k-75k, 58.7% for AGIs $75k-100k, 109.7% for AGIs $100k-200k, 1012.1% for AGIs over 200k)
Ordinary dividends: $5,303 (reported on 21.1% of returns)
Here:
$5,303
State:
$10,949
(% of AGI for various income ranges: 40.9% for AGIs below $25k, 46.4% for AGIs $25k-50k, 116.8% for AGIs $50k-75k, 136.8% for AGIs $75k-100k, 212.0% for AGIs $100k-200k, 1610.4% for AGIs over 200k)
Net capital gain/loss in AGI: +$19,680 (reported on 21.1% of returns)
Here:
+$19,680
State:
+$49,306
(% of AGI for various income ranges: 5.5% for AGIs below $25k, 50.7% for AGIs $25k-50k, 122.8% for AGIs $50k-75k, 258.9% for AGIs $75k-100k, 485.9% for AGIs $100k-200k, 9461.8% for AGIs over 200k)
Profit/loss from business: +$16,166 (reported on 16.7% of returns)
Here:
+$16,166
State:
+$15,671
(% of AGI for various income ranges: 107.0% for AGIs below $25k, 155.8% for AGIs $25k-50k, 254.3% for AGIs $50k-75k, 243.2% for AGIs $75k-100k, 567.6% for AGIs $100k-200k, 3721.1% for AGIs over 200k)
Taxable individual retirement arrangement distribution: $21,600 (reported on 9.9% of returns)
91901:
$21,600
California:
$23,505
(% of AGI for various income ranges: 59.5% for AGIs below $25k, 112.4% for AGIs $25k-50k, 236.8% for AGIs $50k-75k, 397.0% for AGIs $75k-100k, 734.4% for AGIs $100k-200k, 1643.6% for AGIs over 200k)
Self-employed (Keogh) retirement plans: $26,900 (reported on 0.7% of returns)
91901:
$26,900
California:
$30,163
(% of AGI for various income ranges: 59.8% for AGIs $75k-100k, 463.2% for AGIs over 200k)
Total itemized deductions: $35,621 (reported on 24.6% of returns)
Here:
$35,621
State:
$39,517
(% of AGI for various income ranges: 155.3% for AGIs below $25k, 250.7% for AGIs $25k-50k, 694.8% for AGIs $50k-75k, 1183.0% for AGIs $75k-100k, 2924.7% for AGIs $100k-200k, 9820.0% for AGIs over 200k)
Charity contributions: $6,152 (reported on 20.7% of returns)
Here:
$6,152
State:
$12,598
(% of AGI for various income ranges: 8.6% for AGIs below $25k, 21.9% for AGIs $25k-50k, 56.4% for AGIs $50k-75k, 115.8% for AGIs $75k-100k, 373.7% for AGIs $100k-200k, 1947.1% for AGIs over 200k)
Taxes paid: $9,105 (reported on 24.6% of returns)
91901:
$9,105
State:
$8,807
(% of AGI for various income ranges: 31.2% for AGIs below $25k, 59.2% for AGIs $25k-50k, 181.1% for AGIs $50k-75k, 332.3% for AGIs $75k-100k, 839.5% for AGIs $100k-200k, 2191.4% for AGIs over 200k)
Earned income credit: $1,877 (reported on 9.2% of returns)
Here:
$1,877
State:
$2,074
(% of AGI for various income ranges: 60.9% for AGIs below $25k, 55.0% for AGIs $25k-50k)
Percentage of individuals using paid preparers for their 2020 taxes: 94.0%
Here:
94%
State:
92%
(% for various income ranges: 91.6% for AGIs below $25k, 94.9% for AGIs $25k-50k, 91.4% for AGIs $50k-75k, 95.3% for AGIs $75k-100k, 95.5% for AGIs $100k-200k, 96.7% for AGIs over 200k)
Averages for the 2012 tax year for zip code 91901, filed in 2013:
Average Adjusted Gross Income (AGI) in 2012: $89,135 (Individual Income Tax Returns)
Here:
$89,135
State:
$72,726
Salary/wage: $65,174 (reported on 80.3% of returns)
Here:
$65,174
State:
$59,079
(% of AGI for various income ranges: 70.7% for AGIs below $25k, 73.4% for AGIs $25k-50k, 65.1% for AGIs $50k-75k, 68.7% for AGIs $75k-100k, 72.0% for AGIs $100k-200k, 39.0% for AGIs over 200k)
Taxable interest for individuals: $1,506 (reported on 45.0% of returns)
This zip code:
$1,506
California:
$2,146
(% of AGI for various income ranges: 1.5% for AGIs below $25k, 0.9% for AGIs $25k-50k, 1.0% for AGIs $50k-75k, 0.7% for AGIs $75k-100k, 0.6% for AGIs $100k-200k, 0.8% for AGIs over 200k)
Ordinary dividends: $6,208 (reported on 21.2% of returns)
Here:
$6,208
State:
$9,308
(% of AGI for various income ranges: 2.2% for AGIs below $25k, 1.1% for AGIs $25k-50k, 1.2% for AGIs $50k-75k, 0.9% for AGIs $75k-100k, 0.8% for AGIs $100k-200k, 2.2% for AGIs over 200k)
Net capital gain/loss in AGI: +$32,419 (reported on 19.2% of returns)
Here:
+$32,419
State:
+$30,460
(% of AGI for various income ranges: 0.8% for AGIs $50k-75k, 0.8% for AGIs $75k-100k, 0.7% for AGIs $100k-200k, 17.8% for AGIs over 200k)
Profit/loss from business: +$14,827 (reported on 18.2% of returns)
Here:
+$14,827
State:
+$17,064
(% of AGI for various income ranges: 8.2% for AGIs below $25k, 5.6% for AGIs $25k-50k, 3.2% for AGIs $50k-75k, 3.5% for AGIs $75k-100k, 3.2% for AGIs $100k-200k, 1.6% for AGIs over 200k)
Taxable individual retirement arrangement distribution: $19,739 (reported on 10.5% of returns)
91901:
$19,739
California:
$19,557
(% of AGI for various income ranges: 2.3% for AGIs below $25k, 2.4% for AGIs $25k-50k, 3.0% for AGIs $50k-75k, 3.7% for AGIs $75k-100k, 3.1% for AGIs $100k-200k, 1.1% for AGIs over 200k)
Self-employment retirement plans: $19,083 (reported on 0.8% of returns)
91901:
$19,083
California:
$24,530
Total itemized deductions: $35,891 (24% of AGI, reported on 47.9% of returns)
Here:
$35,891
State:
$34,004
Here:
23.8% of AGI
State:
22.7% of AGI
(% of AGI for various income ranges: 17.7% for AGIs below $25k, 15.2% for AGIs $25k-50k, 18.7% for AGIs $50k-75k, 20.4% for AGIs $75k-100k, 22.5% for AGIs $100k-200k, 17.4% for AGIs over 200k)
Charity contributions: $3,548 (reported on 40.9% of returns)
Here:
$3,548
State:
$4,659
(% of AGI for various income ranges: 1.3% for AGIs below $25k, 1.1% for AGIs $25k-50k, 1.4% for AGIs $50k-75k, 1.8% for AGIs $75k-100k, 2.0% for AGIs $100k-200k, 1.5% for AGIs over 200k)
Taxes paid: $13,811 (reported on 47.8% of returns)
91901:
$13,811
State:
$14,448
(% of AGI for various income ranges: 3.6% for AGIs below $25k, 3.5% for AGIs $25k-50k, 5.1% for AGIs $50k-75k, 6.3% for AGIs $75k-100k, 8.0% for AGIs $100k-200k, 9.0% for AGIs over 200k)
Earned income credit: $2,019 (reported on 10.5% of returns)
Here:
$2,019
State:
$2,286
(% of AGI for various income ranges: 4.1% for AGIs below $25k, 0.9% for AGIs $25k-50k)
Percentage of individuals using paid preparers for their 2012 taxes: 63.1%
Here:
63%
State:
64%
(% for various income ranges: 51.8% for AGIs below $25k, 57.8% for AGIs $25k-50k, 68.0% for AGIs $50k-75k, 70.7% for AGIs $75k-100k, 71.8% for AGIs $100k-200k, 81.8% for AGIs over 200k)
Averages for the 2004 tax year for zip code 91901, filed in 2005:
Average Adjusted Gross Income (AGI) in 2004: $73,549 (Individual Income Tax Returns)
Here:
$73,549
State:
$58,600
Salary/wage: $59,596 (reported on 82.1% of returns)
Here:
$59,596
State:
$49,455
(% of AGI for various income ranges: 142.0% for AGIs below $10k, 73.7% for AGIs $10k-25k, 74.5% for AGIs $25k-50k, 75.3% for AGIs $50k-75k, 77.2% for AGIs $75k-100k, 59.8% for AGIs over 100k)
Taxable interest for individuals: $1,466 (reported on 57.3% of returns)
This zip code:
$1,466
California:
$2,365
(% of AGI for various income ranges: 8.7% for AGIs below $10k, 2.4% for AGIs $10k-25k, 1.8% for AGIs $25k-50k, 1.6% for AGIs $50k-75k, 1.0% for AGIs $75k-100k, 0.8% for AGIs over 100k)
Taxable dividends: $3,114 (reported on 26.8% of returns)
Here:
$3,114
State:
$4,746
(% of AGI for various income ranges: 8.4% for AGIs below $10k, 1.4% for AGIs $10k-25k, 1.6% for AGIs $25k-50k, 1.1% for AGIs $50k-75k, 0.8% for AGIs $75k-100k, 1.0% for AGIs over 100k)
Net capital gain/loss: +$18,286 (reported on 24.2% of returns)
Here:
+$18,286
State:
+$23,418
(% of AGI for various income ranges: -4.1% for AGIs below $10k, 0.8% for AGIs $10k-25k, 0.8% for AGIs $25k-50k, 0.8% for AGIs $50k-75k, 2.0% for AGIs $75k-100k, 9.3% for AGIs over 100k)
Profit/loss from business: +$16,920 (reported on 19.9% of returns)
Here:
+$16,920
State:
+$16,826
(% of AGI for various income ranges: 21.3% for AGIs below $10k, 9.4% for AGIs $10k-25k, 4.7% for AGIs $25k-50k, 6.3% for AGIs $50k-75k, 4.9% for AGIs $75k-100k, 3.6% for AGIs over 100k)
IRA payment deduction: $3,342 (reported on 3.1% of returns)
91901:
$3,342
California:
$3,192
(% of AGI for various income ranges: 0.3% for AGIs $10k-25k, 0.3% for AGIs $25k-50k, 0.3% for AGIs $50k-75k, 0.2% for AGIs $75k-100k, 0.1% for AGIs over 100k)
Self-employed pension: $14,804 (reported on 1.7% of returns)
Here:
$14,804
California:
$17,688
(% of AGI for various income ranges: 0.4% for AGIs $50k-75k, 0.2% for AGIs $75k-100k, 0.4% for AGIs over 100k)
Total itemized deductions: $31,908 (28% of AGI, reported on 52.6% of returns)
Here:
$31,908
State:
$28,113
Here:
27.5% of AGI
State:
25.3% of AGI
(% of AGI for various income ranges: 50.2% for AGIs below $10k, 18.1% for AGIs $10k-25k, 20.9% for AGIs $25k-50k, 27.0% for AGIs $50k-75k, 28.6% for AGIs $75k-100k, 21.0% for AGIs over 100k)
Charity contributions deductions: $3,460 (3% of AGI, reported on 47.5% of returns)
Here:
$3,460
State:
$3,923
Here:
2.9% of AGI
State:
3.3% of AGI
(% of AGI for various income ranges: 1.7% for AGIs below $10k, 1.3% for AGIs $10k-25k, 1.7% for AGIs $25k-50k, 2.4% for AGIs $50k-75k, 2.7% for AGIs $75k-100k, 2.3% for AGIs over 100k)
Total tax: $11,944 (reported on 82.5% of returns)
91901:
$11,944
State:
$10,761
(% of AGI for various income ranges: 5.7% for AGIs below $10k, 5.3% for AGIs $10k-25k, 6.9% for AGIs $25k-50k, 8.3% for AGIs $50k-75k, 8.8% for AGIs $75k-100k, 17.1% for AGIs over 100k)
Earned income credit: $1,541 (reported on 8.0% of returns)
Here:
$1,541
State:
$1,763
Percentage of individuals using paid preparers for their 2004 taxes: 67.3%
Here:
67%
State:
66%
(% for various income ranges: 50.4% for AGIs below $10k, 61.7% for AGIs $10k-25k, 65.3% for AGIs $25k-50k, 73.5% for AGIs $50k-75k, 73.9% for AGIs $75k-100k, 78.4% for AGIs over 100k)
Likely homosexual households (counted as self-reported same-sex unmarried-partner households)
Lesbian couples: 0.1% of all households
Gay men: 0.0% of all households
Household received Food Stamps/SNAP in the past 12 months: 430 Household did not receive Food Stamps/SNAP in the past 12 months: 6,022
Women who had a birth in the past 12 months: 238 (184 now married, 54 unmarried) Women who did not have a birth in the past 12 months: 4,071 (1,932 now married, 2,126 unmarried)
Housing units in zip code 91901 with a mortgage: 3,442 (368 second mortgage, 7 home equity loan, 356 both second mortgage and home equity loan) Houses without a mortgage: 54
Median monthly owner costs for units with a mortgage: $2,939 Median monthly owner costs for units without a mortgage: $946
Residents with income below the poverty level in 2022:
This zip code:
8.8%
Whole state:
12.2%
Residents with income below 50% of the poverty level in 2022:
This zip code:
4.7%
Whole state:
6.2%
Median number of rooms in houses and condos:
Here:
6.3
State:
6.0
Median number of rooms in apartments:
Here:
4.2
State:
3.9
Notable locations in this zip code not listed on our city pages
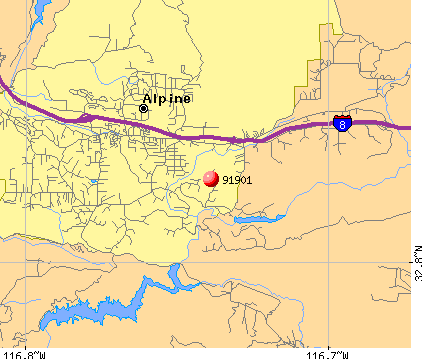
Notable locations in zip code 91901: Japatu Station (A), Horsethief Trailhead (B), Loveland Fishing Access Trailhead (C), Lyster Ranch (D), Eichenlaub Ranch (E), Barrett Honor Camp (F), Mar-Tar-Awa Campground (G), Viejas Honor Camp (H), Murphy Ranch (I), Carveacre Ranch (J), Lemon Grove Rod and Gun club (K), Alpine Fire Protection District Station 17 (L), Alpine Community Center (M), Alpine Branch San Diego County Library (N), Viejas Fire Department (O), United States Forest Service Cleveland National Forest Station Alpine (P), Descanso Ranger District (Q), San Diego East Visitors Bureau (R). Display/hide their locations on the map
Shopping Centers: Viejas Outlet Center Shopping Center (1), Country Side Shopping Center (2), Alpine Creek Shopping Center (3). Display/hide their locations on the map
Churches in zip code 91901 include: First Baptist Church of the Willows (A), Alpine Church of Christ (B), Alpine Community Church (C), Alpine Lutheran Church (D), Bethel Assembly of God Church (E), Christ the King Episcopal Church (F), The Church of Jesus Christ of Latter Day Saints (G), First Baptist Church of Alpine (H), Good Shepherd of the Hills Church (I). Display/hide their locations on the map
Creeks: Viejas Creek (A), Espinosa Creek (B), Taylor Creek (C), Alpine Creek (D), Pine Valley Creek (E), Chocolate Creek (F). Display/hide their locations on the map
In group quarters: 245 (-1 institutionalized population)
Size of family households: 1,953 2-persons, 1,098 3-persons, 1,062 4-persons, 410 5-persons, 197 6-persons, 104 7-or-more-persons
Size of nonfamily households: 1,287 1-person, 374 2-persons, 38 3-persons
2,424 married couples with children.
818 single-parent households (460 men, 358 women).
83.8% of residents of 91901 zip code speak English at home.
10.8% of residents speak Spanish at home (68% very well, 14% well, 14% not well, 4% not at all).
2.5% of residents speak other Indo-European language at home (93% very well, 7% well).
2.1% of residents speak Asian or Pacific Island language at home (37% very well, 53% well, 10% not well).
0.3% of residents speak other language at home (100% very well).
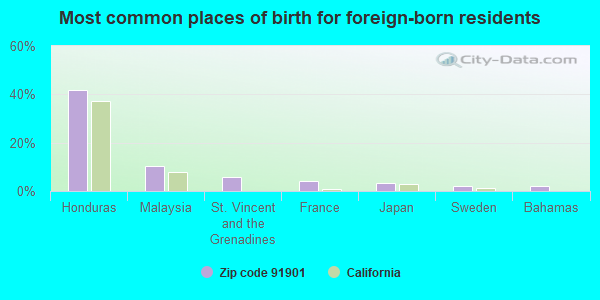
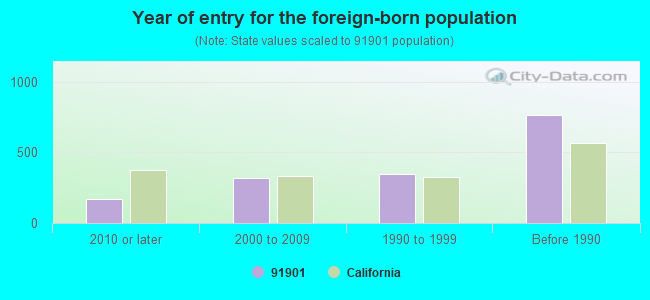
Foreign born population: 1,503 (8.1%) (70.3% of them are naturalized citizens)
This zip code:
8.1%
Whole state:
26.7%
42%Honduras
11%Malaysia
6%St. Vincent and the Grenadines
4%France
3%Japan
2%Sweden
2%Bahamas
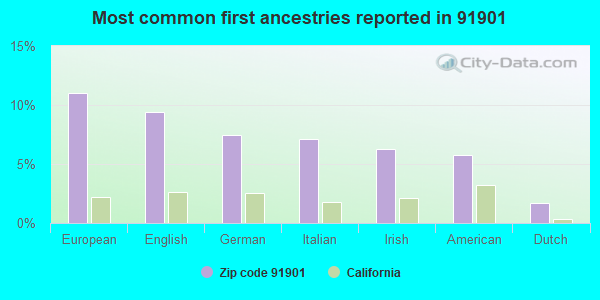
11%European
9%English
7%German
7%Italian
6%Irish
6%American
2%Dutch
Year of entry for the foreign-born population
1692010 or later
3192000 to 2009
3501990 to 1999
764Before 1990
Facilities with environmental interests located in this zip code:
ALPINE SHELL SERVICE (1340 TAVERN ROAD in ALPINE, CA)
STATE MASTER (California - Hazardous Waste Tracking) - HAZARDOU WASTE PROGRAM CRITERIA AND HAZARDOUS AIR POLLUTANT INVENTORY (Inventory of air pollution sources) Large Quantity Generators, more that 1000 kg of hazardous waste/month (Resource Conservation and Recovery Act (tracking hazardous waste)) Business SIC classification: GASOLINE SERVICE STATIONS Organizations: SHELL OIL PRODUCTS US (CONTACT/OPERATOR)
, EQUILON ENTERPRISES LLC DBA SHELL OIL PR (CONTACT/OWNER)
Alternative names: SHELL OIL PRODUCTS U S, SHELL SERVICE STN
ALPINE COMMUNITY DAY (1323-A ADMINISTRATION WAY in ALPINE, CA)
(National Center for Education Statistics) - STATE ID-6120380 Organizations: ALPINE UNION ELEMENTARY (SCHOOL DISTRICT)
ALPINE ELEMENTARY (1850 ALPINE BLVD. in ALPINE, CA)
(National Center for Education Statistics) - STATE ID-6037519 Organizations: ALPINE UNION ELEMENTARY (SCHOOL DISTRICT)
MAC QUEEN (JOAN) MIDDLE (2001TAVERN ROAD in ALPINE, CA)
(National Center for Education Statistics) - STATE ID-6037535 Organizations: ALPINE UNION ELEMENTARY (SCHOOL DISTRICT)
MOUNTAIN VIEW LEARNING ACADEMY (8818 HARBISON CAYON RD. in ALPINE, CA)
(National Center for Education Statistics) - STATE ID-6109953 Organizations: ALPINE UNION ELEMENTARY (SCHOOL DISTRICT)
ALPINE CREEK CLEANERS INCORPORATED (1347 TAVERN ROAD 28A in ALPINE, CA)
CRITERIA AND HAZARDOUS AIR POLLUTANT INVENTORY (Inventory of air pollution sources) Small Quantity Generators, between 100 kg and 1000 kg of hazardous waste/month (Resource Conservation and Recovery Act (tracking hazardous waste)) Business SIC classification: DRYCLEANING PLANTS, EXCEPT RUG CLEANING
CHEVRON STATION 9 1640 (2235 ALPINE DR in ALPINE, CA)
Small Quantity Generators, between 100 kg and 1000 kg of hazardous waste/month (Resource Conservation and Recovery Act (tracking hazardous waste)) - notification Organizations: CHEVRON USA PRODUCTS CO (CONTACT/OWNER)
ALPINE BURNSITE 1 (9715 CHOCOLATE SUMMIT DR. in ALPINE, CA)
CRITERIA AND HAZARDOUS AIR POLLUTANT INVENTORY (Inventory of air pollution sources) Business SIC classification: REFUSE SYSTEMS Business NAICS classification: SOLID WASTE LANDFILL.
ALPINE BURNSITE 2 (10043 CHOCOLATE SUMMIT DR. in ALPINE, CA)
CRITERIA AND HAZARDOUS AIR POLLUTANT INVENTORY (Inventory of air pollution sources) Business SIC classification: REFUSE SYSTEMS Business NAICS classification: SOLID WASTE LANDFILL.
ALPINE GAS & DIESEL (1145 TAVERN RD in ALPINE, CA)
CRITERIA AND HAZARDOUS AIR POLLUTANT INVENTORY (Inventory of air pollution sources) Business SIC classification: GASOLINE SERVICE STATIONS
CRITERIA AND HAZARDOUS AIR POLLUTANT INVENTORY (Inventory of air pollution sources) Business SIC classification: DRYCLEANING PLANTS, EXCEPT RUG CLEANING
Housing units lacking complete plumbing facilities: 2.0% Housing units lacking complete kitchen facilities: 1.9%
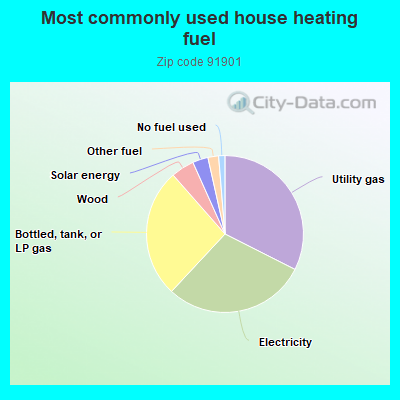
32.5%Utility gas
29.5%Electricity
26.6%Bottled, tank, or LP gas
4.8%Wood
3.2%Solar energy
2.2%Other fuel
1.3%No fuel used
Population in 1990: 12,566. Population change in the 1990s: +3,902 (+31.1%).
Place of birth for U.S.-born residents:
This state: 12,988
Northeast: 942
Midwest: 1,317
South: 649
West: 909
48% of the 91901 zip code residents lived in the same house 5 years ago. Out of people who lived in different houses, 76% lived in this county. Out of people who lived in different counties, 50% lived in California.
87% of the 91901 zip code residents lived in the same house 1 year ago. Out of people who lived in different houses, 69% moved from this county. Out of people who lived in different houses, 3% moved from different county within same state. Out of people who lived in different houses, 22% moved from different state. Out of people who lived in different houses, 4% moved from abroad.
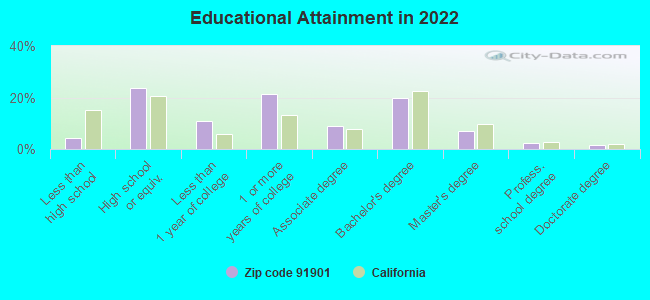
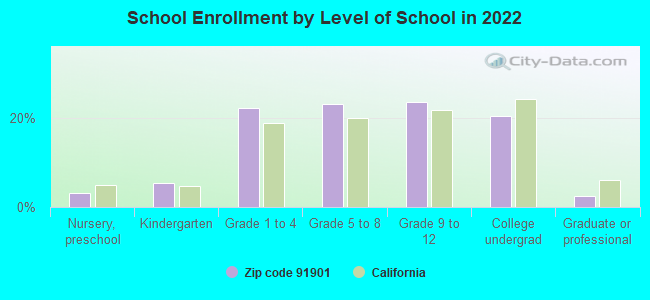
Private vs. public school enrollment:
Students in private schools in grades 1 to 8 (elementary and middle school): 338
Here:
18.8%
California:
10.5%
Students in private schools in grades 9 to 12 (high school): 214
Here:
23.1%
California:
8.5%
Students in private undergraduate colleges: 122
Here:
15.1%
California:
15.9%
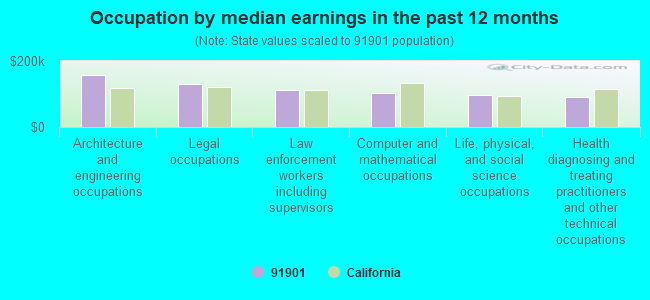
Occupation by median earnings in the past 12 months ($)
158,900Architecture and engineering occupations
131,215Legal occupations
113,439Law enforcement workers including supervisors
104,012Computer and mathematical occupations
98,243Life, physical, and social science occupations
89,414Health diagnosing and treating practitioners and other technical occupations
Companies with federal contracts located in this zip code (ALPINE, CA):
COMPUTER PARTS BY PETER INC (21910 JAPATUEL LN; small business) : $135,878 in 7 contractsfrom 2005 to 2006
Contracts for ADP Support Equipment, Motors, Electrical, Video Recording and Reproducing Equipment, Converters, Electrical, Nonrotating by Defense Logistics Agency Signed by year:2000: $0; 2001: $0; 2002: $0; 2003: $0; 2004: $0; 2005: $44,026; 2006: $91,852.
Biggest contracts:
$41,925 with Defense Logistics Agency for ADP Support Equipment. Signed on 2006-04-07. Completion date: 2006-05-07.
$31,687, same as above.Signed on 2006-02-28. Completion date: 2006-03-17.
$21,500, same as above.Signed on 2005-07-16. Completion date: 2005-08-07.
$16,226 with Defense Logistics Agency for Motors, Electrical. Signed on 2005-05-19. Completion date: 2005-06-13.
COMPUTER PARTS & PERIPHERALS I (21910 JAPATUL LN; small business) : $62,235 in 3 contractsfrom 2004 to 2006
$47,085 with Defense Logistics Agency for ADP Supplies. Signed on 2005-02-28. Completion date: 2005-03-15.
$9,750 with Defense Logistics Agency for ADP Support Equipment. Signed on 2006-03-03. Completion date: 2006-03-15.
$5,400 with Defense Logistics Agency for ADP Input/Output and Storage Devices. Signed on 2004-10-21. Completion date: 2004-10-29.
AYRES GROUP (1251 TAVERN ROAD) : $58,519 in 7 contractsfrom 2002 to 2004
Contracts for Training/Curriculum Development, Lodging - Hotel/Motel, Other Professional Services by Navy Signed by year:2000: $0; 2001: $0; 2002: $42,900; 2003: $19,908; 2004: -$4,289; 2005: $0; 2006: $0.
Biggest contracts:
$42,900 with Navy for Training/Curriculum Development. Signed on 2002-10-10. Completion date: 2003-09-30.
$40,038 with Navy for Lodging - Hotel/Motel. Signed on 2003-10-15. Completion date: 2004-08-15.
$4,481 with Navy for Other Professional Services. Signed on 2004-12-01. Completion date: 2004-12-05.
$3,520 with Navy for Training/Curriculum Development. Signed on 2003-03-14. Completion date: 2003-09-30.
WESTSTAR, INC. (880 TAVERN RD.; small business) : $37,615 in 3 contractsfrom 1999 to 2000
$46,748 with Army for Maintenance, Repair or Alteration of Real Property -- Fuel Supply Facilities. Taking place in WA. Signed on 2000-03-09. Completion date: 2000-04-17.
$3,845, same as above.Signed on 2000-07-31. Completion date: 2000-04-17.
-$12,978 with Navy for Maintenance, Repair or Alteration of Real Property -- Airport Runways. Taking place in AZ. Signed on 1999-12-16. Completion date: 1999-12-31.
HOLLIMAN, LARRY G (38 CALLE CONEJO; small business)
$10,880 with Navy for Miscellaneous Prefabricated Structures. Signed on 2006-02-16. Completion date: 2006-03-21.
Top industries in this zip code by the number of employees in 2005:
2005 - 2018 National Fire Incident Reporting System (NFIRS) incidents
According to the data from the years 2005 - 2018 the average number of fires per year is 54. The highest number of reported fire incidents - 163 took place in 2006, and the least - 8 in 2010. The data has an increasing trend.
When looking into fire subcategories, the most incidents belonged to: Structure Fires (38.8%), and Outside Fires (38.0%).
Fire incident types reported to NFIRS in Zip Code 91901

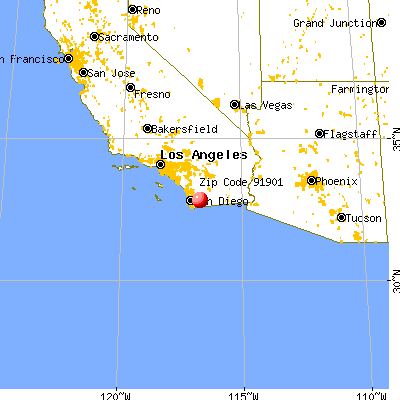


 Nearest zip codes: 91935, 91916, 91931, 92021, 92019, 91917.


 According to the data from the years 2005 - 2018 the average number of fires per year is 54. The highest number of reported fire incidents - 163 took place in 2006, and the least - 8 in 2010. The data has an increasing trend.
 When looking into fire subcategories, the most incidents belonged to: Structure Fires (38.8%), and Outside Fires (38.0%).