Estimated zip code population in 2022: 48,863 Zip code population in 2010: 47,490 Zip code population in 2000: 42,728
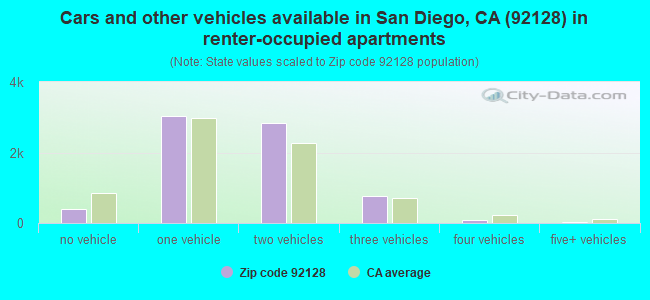
Houses and condos: 21,577 Renter-occupied apartments: 7,149
% of renters here:
34%
State:
44%
March 2022 cost of living index in zip code 92128: 122.6 (high, U.S. average is 100)
Land area: 11.2 sq. mi. Water area: 0.0 sq. mi.
Population density: 4,372 people per square mile
(average).
OSM Map
General Map
Google Map
MSN Map
OSM Map
General Map
Google Map
MSN Map
OSM Map
General Map
Google Map
MSN Map
OSM Map
General Map
Google Map
MSN Map
Please wait while loading the map...
Real estate property taxes paid for housing units in 2022:
This zip code:
0.7% ($5,984)
California:
0.7% ($4,831)
Median real estate property taxes paid for housing units with mortgages in 2022: $6,334 (0.7%) Median real estate property taxes paid for housing units with no mortgage in 2022: $5,268 (0.6%)
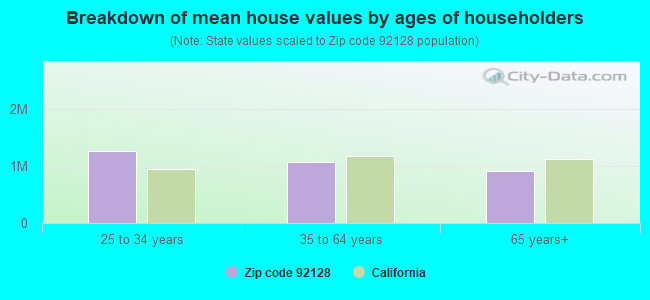
Estimated median house/condo value in 2022: $855,866
92128:
$855,866
California:
$715,900
According to our research of California and other state lists, there were 16 registered sex offenders living in 92128 zip code as of April 27, 2024. The ratio of all residents to sex offenders in zip code 92128 is 3,140 to 1. The ratio of registered sex offenders to all residents in this zip code is much lower than the state average.
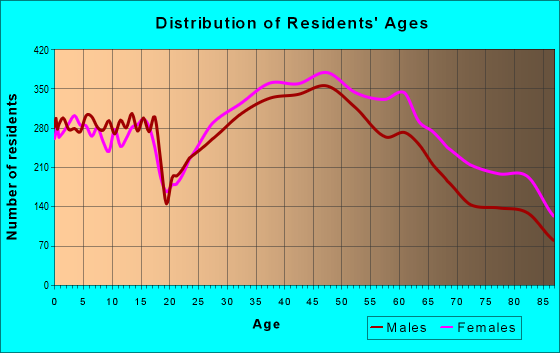
Median resident age:
This zip code:
44.5 years
California median age:
37.9 years
Average household size:
This zip code:
2.3 people
California:
2.8 people
Averages for the 2020 tax year for zip code 92128, filed in 2021:
Average Adjusted Gross Income (AGI) in 2020: $116,526 (Individual Income Tax Returns)
Here:
$116,526
State:
$95,910
Salary/wage: $107,439 (reported on 74.7% of returns)
Here:
$107,439
State:
$77,331
(% of AGI for various income ranges: 1055.7% for AGIs below $25k, 3403.8% for AGIs $25k-50k, 6418.6% for AGIs $50k-75k, 9819.7% for AGIs $75k-100k, 19905.3% for AGIs $100k-200k, 86692.7% for AGIs over 200k)
Taxable interest for individuals: $1,647 (reported on 54.2% of returns)
This zip code:
$1,647
California:
$2,294
(% of AGI for various income ranges: 46.6% for AGIs below $25k, 71.7% for AGIs $25k-50k, 95.0% for AGIs $50k-75k, 142.6% for AGIs $75k-100k, 201.4% for AGIs $100k-200k, 759.5% for AGIs over 200k)
Ordinary dividends: $7,623 (reported on 39.1% of returns)
Here:
$7,623
State:
$10,949
(% of AGI for various income ranges: 84.5% for AGIs below $25k, 135.6% for AGIs $25k-50k, 242.8% for AGIs $50k-75k, 307.3% for AGIs $75k-100k, 494.1% for AGIs $100k-200k, 3866.0% for AGIs over 200k)
Net capital gain/loss in AGI: +$23,204 (reported on 37.6% of returns)
Here:
+$23,204
State:
+$49,306
(% of AGI for various income ranges: 26.7% for AGIs below $25k, 82.6% for AGIs $25k-50k, 202.0% for AGIs $50k-75k, 273.8% for AGIs $75k-100k, 863.6% for AGIs $100k-200k, 16165.8% for AGIs over 200k)
Profit/loss from business: +$15,479 (reported on 16.6% of returns)
Here:
+$15,479
State:
+$15,671
(% of AGI for various income ranges: 135.8% for AGIs below $25k, 240.4% for AGIs $25k-50k, 258.1% for AGIs $50k-75k, 325.4% for AGIs $75k-100k, 599.9% for AGIs $100k-200k, 2188.5% for AGIs over 200k)
Taxable individual retirement arrangement distribution: $24,773 (reported on 14.3% of returns)
92128:
$24,773
California:
$23,505
(% of AGI for various income ranges: 130.9% for AGIs below $25k, 284.7% for AGIs $25k-50k, 463.9% for AGIs $50k-75k, 586.6% for AGIs $75k-100k, 947.2% for AGIs $100k-200k, 2573.6% for AGIs over 200k)
Self-employed (Keogh) retirement plans: $24,836 (reported on 1.1% of returns)
92128:
$24,836
California:
$30,163
(% of AGI for various income ranges: 19.1% for AGIs $50k-75k, 61.1% for AGIs $100k-200k, 419.2% for AGIs over 200k)
Total itemized deductions: $35,367 (reported on 24.8% of returns)
Here:
$35,367
State:
$39,517
(% of AGI for various income ranges: 214.5% for AGIs below $25k, 410.4% for AGIs $25k-50k, 776.2% for AGIs $50k-75k, 1155.2% for AGIs $75k-100k, 2321.1% for AGIs $100k-200k, 8430.0% for AGIs over 200k)
Charity contributions: $6,203 (reported on 20.9% of returns)
Here:
$6,203
State:
$12,598
(% of AGI for various income ranges: 10.9% for AGIs below $25k, 37.5% for AGIs $25k-50k, 89.5% for AGIs $50k-75k, 118.8% for AGIs $75k-100k, 321.2% for AGIs $100k-200k, 1540.8% for AGIs over 200k)
Taxes paid: $8,815 (reported on 24.7% of returns)
92128:
$8,815
State:
$8,807
(% of AGI for various income ranges: 41.9% for AGIs below $25k, 83.6% for AGIs $25k-50k, 200.9% for AGIs $50k-75k, 353.1% for AGIs $75k-100k, 700.9% for AGIs $100k-200k, 1689.0% for AGIs over 200k)
Earned income credit: $1,449 (reported on 4.8% of returns)
Here:
$1,449
State:
$2,074
(% of AGI for various income ranges: 32.8% for AGIs below $25k, 30.2% for AGIs $25k-50k, 0.5% for AGIs $50k-75k)
Percentage of individuals using paid preparers for their 2020 taxes: 92.8%
Here:
93%
State:
92%
(% for various income ranges: 90.9% for AGIs below $25k, 91.5% for AGIs $25k-50k, 93.1% for AGIs $50k-75k, 92.5% for AGIs $75k-100k, 94.2% for AGIs $100k-200k, 94.4% for AGIs over 200k)
Averages for the 2012 tax year for zip code 92128, filed in 2013:
Average Adjusted Gross Income (AGI) in 2012: $89,474 (Individual Income Tax Returns)
Here:
$89,474
State:
$72,726
Salary/wage: $85,955 (reported on 76.5% of returns)
Here:
$85,955
State:
$59,079
(% of AGI for various income ranges: 60.3% for AGIs below $25k, 65.7% for AGIs $25k-50k, 66.7% for AGIs $50k-75k, 69.8% for AGIs $75k-100k, 77.9% for AGIs $100k-200k, 74.9% for AGIs over 200k)
Taxable interest for individuals: $1,428 (reported on 56.5% of returns)
This zip code:
$1,428
California:
$2,146
(% of AGI for various income ranges: 2.7% for AGIs below $25k, 1.6% for AGIs $25k-50k, 1.3% for AGIs $50k-75k, 1.0% for AGIs $75k-100k, 0.6% for AGIs $100k-200k, 0.7% for AGIs over 200k)
Ordinary dividends: $5,487 (reported on 36.5% of returns)
Here:
$5,487
State:
$9,308
(% of AGI for various income ranges: 4.9% for AGIs below $25k, 3.2% for AGIs $25k-50k, 2.4% for AGIs $50k-75k, 2.4% for AGIs $75k-100k, 1.5% for AGIs $100k-200k, 2.5% for AGIs over 200k)
Net capital gain/loss in AGI: +$6,575 (reported on 32.7% of returns)
Here:
+$6,575
State:
+$30,460
(% of AGI for various income ranges: 0.3% for AGIs $25k-50k, 0.5% for AGIs $50k-75k, 1.1% for AGIs $75k-100k, 1.2% for AGIs $100k-200k, 6.1% for AGIs over 200k)
Profit/loss from business: +$17,627 (reported on 16.1% of returns)
Here:
+$17,627
State:
+$17,064
(% of AGI for various income ranges: 9.2% for AGIs below $25k, 4.8% for AGIs $25k-50k, 3.6% for AGIs $50k-75k, 2.9% for AGIs $75k-100k, 2.4% for AGIs $100k-200k, 3.2% for AGIs over 200k)
Taxable individual retirement arrangement distribution: $19,185 (reported on 16.3% of returns)
92128:
$19,185
California:
$19,557
(% of AGI for various income ranges: 6.9% for AGIs below $25k, 5.1% for AGIs $25k-50k, 4.5% for AGIs $50k-75k, 4.5% for AGIs $75k-100k, 3.2% for AGIs $100k-200k, 2.3% for AGIs over 200k)
Self-employment retirement plans: $22,136 (reported on 1.1% of returns)
92128:
$22,136
California:
$24,530
(% of AGI for various income ranges: 0.2% for AGIs $50k-75k, 0.2% for AGIs $75k-100k, 0.2% for AGIs $100k-200k, 0.5% for AGIs over 200k)
Total itemized deductions: $29,430 (23% of AGI, reported on 54.5% of returns)
Here:
$29,430
State:
$34,004
Here:
22.8% of AGI
State:
22.7% of AGI
(% of AGI for various income ranges: 24.3% for AGIs below $25k, 16.2% for AGIs $25k-50k, 16.9% for AGIs $50k-75k, 17.8% for AGIs $75k-100k, 18.7% for AGIs $100k-200k, 17.1% for AGIs over 200k)
Charity contributions: $3,466 (reported on 47.3% of returns)
Here:
$3,466
State:
$4,659
(% of AGI for various income ranges: 1.2% for AGIs below $25k, 1.5% for AGIs $25k-50k, 1.6% for AGIs $50k-75k, 1.8% for AGIs $75k-100k, 1.9% for AGIs $100k-200k, 2.0% for AGIs over 200k)
Taxes paid: $11,952 (reported on 54.3% of returns)
92128:
$11,952
State:
$14,448
(% of AGI for various income ranges: 4.6% for AGIs below $25k, 3.6% for AGIs $25k-50k, 4.8% for AGIs $50k-75k, 5.9% for AGIs $75k-100k, 7.7% for AGIs $100k-200k, 9.4% for AGIs over 200k)
Earned income credit: $1,563 (reported on 6.0% of returns)
Here:
$1,563
State:
$2,286
(% of AGI for various income ranges: 2.4% for AGIs below $25k, 0.4% for AGIs $25k-50k)
Percentage of individuals using paid preparers for their 2012 taxes: 53.3%
Here:
53%
State:
64%
(% for various income ranges: 47.5% for AGIs below $25k, 50.9% for AGIs $25k-50k, 55.6% for AGIs $50k-75k, 56.0% for AGIs $75k-100k, 54.8% for AGIs $100k-200k, 62.2% for AGIs over 200k)
Averages for the 2004 tax year for zip code 92128, filed in 2005:
Average Adjusted Gross Income (AGI) in 2004: $72,763 (Individual Income Tax Returns)
Here:
$72,763
State:
$58,600
Salary/wage: $68,850 (reported on 74.3% of returns)
Here:
$68,850
State:
$49,455
(% of AGI for various income ranges: 54.8% for AGIs $10k-25k, 66.1% for AGIs $25k-50k, 69.7% for AGIs $50k-75k, 73.7% for AGIs $75k-100k, 70.2% for AGIs over 100k)
Taxable interest for individuals: $2,331 (reported on 68.8% of returns)
This zip code:
$2,331
California:
$2,365
(% of AGI for various income ranges: 6.2% for AGIs $10k-25k, 3.4% for AGIs $25k-50k, 2.6% for AGIs $50k-75k, 1.9% for AGIs $75k-100k, 1.6% for AGIs over 100k)
Taxable dividends: $4,378 (reported on 43.2% of returns)
Here:
$4,378
State:
$4,746
(% of AGI for various income ranges: 6.6% for AGIs $10k-25k, 3.5% for AGIs $25k-50k, 2.7% for AGIs $50k-75k, 2.3% for AGIs $75k-100k, 2.1% for AGIs over 100k)
Net capital gain/loss: +$9,354 (reported on 39.2% of returns)
Here:
+$9,354
State:
+$23,418
(% of AGI for various income ranges: -0.4% for AGIs $10k-25k, 0.8% for AGIs $25k-50k, 1.0% for AGIs $50k-75k, 1.4% for AGIs $75k-100k, 8.2% for AGIs over 100k)
Profit/loss from business: +$18,611 (reported on 16.0% of returns)
Here:
+$18,611
State:
+$16,826
(% of AGI for various income ranges: 7.9% for AGIs $10k-25k, 4.9% for AGIs $25k-50k, 2.9% for AGIs $50k-75k, 3.6% for AGIs $75k-100k, 4.1% for AGIs over 100k)
IRA payment deduction: $3,304 (reported on 3.4% of returns)
92128:
$3,304
California:
$3,192
(% of AGI for various income ranges: 0.4% for AGIs $10k-25k, 0.3% for AGIs $25k-50k, 0.2% for AGIs $50k-75k, 0.2% for AGIs $75k-100k, 0.1% for AGIs over 100k)
Self-employed pension: $16,441 (reported on 2.0% of returns)
Here:
$16,441
California:
$17,688
(% of AGI for various income ranges: 0.2% for AGIs $10k-25k, 0.2% for AGIs $25k-50k, 0.2% for AGIs $50k-75k, 0.4% for AGIs $75k-100k, 0.6% for AGIs over 100k)
Total itemized deductions: $26,528 (26% of AGI, reported on 57.2% of returns)
Here:
$26,528
State:
$28,113
Here:
25.6% of AGI
State:
25.3% of AGI
(% of AGI for various income ranges: 26.9% for AGIs $10k-25k, 20.9% for AGIs $25k-50k, 22.0% for AGIs $50k-75k, 22.4% for AGIs $75k-100k, 19.2% for AGIs over 100k)
Charity contributions deductions: $3,301 (3% of AGI, reported on 51.7% of returns)
Here:
$3,301
State:
$3,923
Here:
3.1% of AGI
State:
3.3% of AGI
(% of AGI for various income ranges: 2.2% for AGIs $10k-25k, 2.1% for AGIs $25k-50k, 2.2% for AGIs $50k-75k, 2.2% for AGIs $75k-100k, 2.4% for AGIs over 100k)
Total tax: $11,468 (reported on 85.6% of returns)
92128:
$11,468
State:
$10,761
(% of AGI for various income ranges: 4.8% for AGIs $10k-25k, 7.6% for AGIs $25k-50k, 9.4% for AGIs $50k-75k, 10.5% for AGIs $75k-100k, 16.9% for AGIs over 100k)
Earned income credit: $1,266 (reported on 3.9% of returns)
Here:
$1,266
State:
$1,763
Percentage of individuals using paid preparers for their 2004 taxes: 58.8%
Here:
59%
State:
66%
(% for various income ranges: 51.4% for AGIs below $10k, 58.4% for AGIs $10k-25k, 58.4% for AGIs $25k-50k, 60.4% for AGIs $50k-75k, 58.2% for AGIs $75k-100k, 62.8% for AGIs over 100k)
Likely homosexual households (counted as self-reported same-sex unmarried-partner households)
Lesbian couples: 0.1% of all households
Gay men: 0.1% of all households
Household received Food Stamps/SNAP in the past 12 months: 566 Household did not receive Food Stamps/SNAP in the past 12 months: 19,778
Women who had a birth in the past 12 months: 597 (561 now married, 33 unmarried) Women who did not have a birth in the past 12 months: 9,366 (5,119 now married, 4,188 unmarried)
Housing units in zip code 92128 with a mortgage: 9,532 (886 second mortgage, 11 home equity loan, 839 both second mortgage and home equity loan) Houses without a mortgage: 187
Median monthly owner costs for units with a mortgage: $3,016 Median monthly owner costs for units without a mortgage: $957
Residents with income below the poverty level in 2022:
This zip code:
4.8%
Whole state:
12.2%
Residents with income below 50% of the poverty level in 2022:
This zip code:
2.1%
Whole state:
6.2%
Median number of rooms in houses and condos:
Here:
5.7
State:
6.0
Median number of rooms in apartments:
Here:
4.0
State:
3.9
Notable locations in this zip code not listed on our city pages
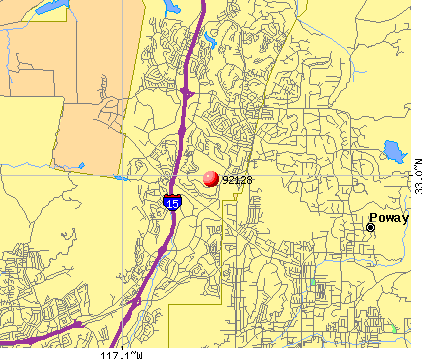
Notable locations in zip code 92128: Rancho Bernardo Riding Club (A), Oaks North Executive Golf Course (B), Oaks North Community Center (C), Bernardo Heights Country Club (D), Rancho Bernardo Country Club (E), Seven Oaks Community Center (F), Rancho Bernardo Chamber of Commerce (G), Rancho Bernardo Branch San Diego Public Library (H), Eastview Community Center (I), Bernardo Heights Community Center (J), San Diego Fire - Rescue Department Station 42 (K), San Diego Fire - Rescue Department Station 33 (L), Rancho Bernardo Library (M), Faith Fellowship Foundation (N). Display/hide their locations on the map
Shopping Centers: Carmel Village Plaza Shopping Center (1), Alta Carmel Shopping Center (2), The Plaza Shopping Center (3), The New Mercado Shopping Center (4), Rancho Bernardo Village Shopping Center (5), Rancho Bernardo Town Center Shopping Center (6), Pomerado Village Shopping Center (7), Oaks North Plaza Shopping Center (8), Bernardo Shopping Center (9). Display/hide their locations on the map
Churches in zip code 92128 include: The Church at Rancho Bernardo (A), Saint Bartholomews Episcopal Church (B), Rancho Bernardo Community Presbyterian Church (C), Chinese Family for Christ Church (D), Chinese Bible Church of San Diego (E), Hope United Methodist Church in Rancho Bernardo (F), Global Missions Fellowship Church (G). Display/hide their locations on the map
Parks in zip code 92128 include: Webb Park (1), Carmel Mountain Ranch Community Park (2), Highland Ranch Park (3), Sabre Springs Park (4). Display/hide their locations on the map
7,516 married couples with children.
1,271 single-parent households (391 men, 880 women).
69.0% of residents of 92128 zip code speak English at home.
5.8% of residents speak Spanish at home (88% very well, 8% well, 3% not well, 1% not at all).
9.8% of residents speak other Indo-European language at home (71% very well, 21% well, 7% not well, 1% not at all).
15.3% of residents speak Asian or Pacific Island language at home (58% very well, 27% well, 13% not well, 2% not at all).
0.6% of residents speak other language at home (83% very well, 12% well, 5% not well).
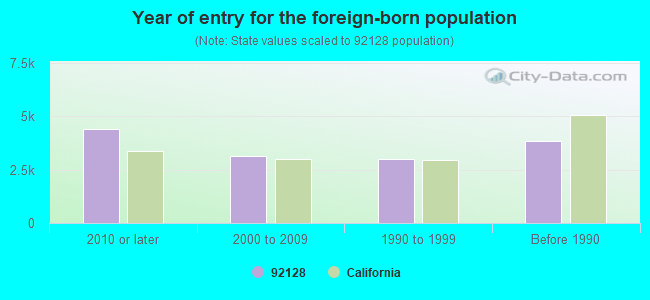
Foreign born population: 13,189 (27.0%) (61.5% of them are naturalized citizens)
Major facilities with environmental interests located in this zip code:
EQUILON ENTERPRISES (12174 CARMEL MOUNTAIN RD in SAN DIEGO, CA) . Federal Facility
STATE MASTER (California - Hazardous Waste Tracking) - HAZARDOU WASTE PROGRAM CRITERIA AND HAZARDOUS AIR POLLUTANT INVENTORY (Inventory of air pollution sources) Small Quantity Generators, between 100 kg and 1000 kg of hazardous waste/month (Resource Conservation and Recovery Act (tracking hazardous waste)) - notification Business SIC classification: GASOLINE SERVICE STATIONS Alternative names: TEXACO SERVICE STATION
HERCO TECHNOLOGY CORPORATION (13330 EVENING CREEK DRIVE NORTH in SAN DIEGO, CA)
CRITERIA AND HAZARDOUS AIR POLLUTANT INVENTORY (Inventory of air pollution sources) HAZARDOUS WASTE BIENNIAL REPORTER (Resource Conservation and Recovery Act (tracking hazardous waste)) Large Quantity Generators, more that 1000 kg of hazardous waste/month (Resource Conservation and Recovery Act (tracking hazardous waste)) - notification TRI REPORTER (Tracking of toxic chemicals releasing facilities) Business SIC classification: PRINTED CIRCUIT BOARDS Business NAICS classification: BARE PRINTED CIRCUIT BOARD MANUFACTURING.; BARE PRINTED CIRCUIT BOARD MANUFACTURING. Organizations: SORRENTO WEST PROPERTIES- SOLD SEE #12 (CONTACT/OPERATOR)
Alternative names: TERADYNE CIRCUITS SAN DEIGO, TERADYNE CIRCUITS SAN DIEGO
HIGHLAND RANCH ELEMENTARY (14840 WAVERLY DOWNS WAY in SAN DIEGO, CA)
(National Center for Education Statistics) - STATE ID-6110886 Organizations: POWAY UNIFIED (SCHOOL DISTRICT)
MORNING CREEK ELEMENTARY (10925 MORNING CREEK DR., SOUTH in SAN DIEGO, CA)
(National Center for Education Statistics) - STATE ID-6109318 Organizations: POWAY UNIFIED (SCHOOL DISTRICT)
GREENHAVEN PRESS INC (10907 TECHNOLOGY PLACE in RANCHO BERNARDO, CA)
(Resource Conservation and Recovery Act (tracking hazardous waste)) Organizations: DAVID L BENDER (CONTACT/OWNER)
NORTHROP GRUMMAN CORP. RANCHO BERNARDO (17030 GOLDEN TOP ROAD in RANCHO BERNARDO, CA)
Large Quantity Generators, more that 1000 kg of hazardous waste/month (Resource Conservation and Recovery Act (tracking hazardous waste))
EUNISYS CORP., RB2 (16701 WEST BERNARDO DRIVE in SAN DIEGO, CA)
Small Quantity Generators, between 100 kg and 1000 kg of hazardous waste/month (Resource Conservation and Recovery Act (tracking hazardous waste)) TRI REPORTER (Tracking of toxic chemicals releasing facilities) Business SIC classification: SEMICONDUCTORS AND RELATED DEVICES Business NAICS classification: ELECTRONIC COMPUTER MANUFACTURING. Alternative names: BURROUGHS CORP MCO I
FRANCELLOS CUSTOM FINISH (13330 PASEO DEL VERANO in RANCHO BERNARDO, CA)
Small Quantity Generators, between 100 kg and 1000 kg of hazardous waste/month (Resource Conservation and Recovery Act (tracking hazardous waste)) - notification Organizations: GENE FRANCELLO (CONTACT/OWNER)
GENERAL ATOMICS AERONAUTICAL SYSTEMS INC (13330 N EVENING CREEK DRIVE in SAN DIEGO, CA)
Small Quantity Generators, between 100 kg and 1000 kg of hazardous waste/month (Resource Conservation and Recovery Act (tracking hazardous waste)) Business NAICS classification: AIRCRAFT MANUFACTURING. Organizations: SORRENTO WEST PROPERTIES (CONTACT/OWNER)
HOME DEPOT USA INC HD 0669 (12185 CARMEL MOUNTAIN RD in SAN DIEGO, CA)
Small Quantity Generators, between 100 kg and 1000 kg of hazardous waste/month (Resource Conservation and Recovery Act (tracking hazardous waste))
HEALTH EXAMINETICS UNIT 1 (15330 AVE OF SCIENCE STE 200 in SAN DIEGO, CA)
Small Quantity Generators, between 100 kg and 1000 kg of hazardous waste/month (Resource Conservation and Recovery Act (tracking hazardous waste)) - notification Business NAICS classification: HOME HEALTH EQUIPMENT RENTAL. Organizations: MEDIQ INC (CONTACT/OWNER)
ARCO #5296 (12610 SABRE SPRINGS PY in SAN DIEGO, CA)
CRITERIA AND HAZARDOUS AIR POLLUTANT INVENTORY (Inventory of air pollution sources) Business SIC classification: GASOLINE SERVICE STATIONS
MOBIL / RANCHO BERNARDO RD (11898 RANCHO BERNARDO RD in SAN DIEGO, CA)
CRITERIA AND HAZARDOUS AIR POLLUTANT INVENTORY (Inventory of air pollution sources) Business SIC classification: GASOLINE SERVICE STATIONS
Housing units lacking complete plumbing facilities: 0.1% Housing units lacking complete kitchen facilities: 1.3%
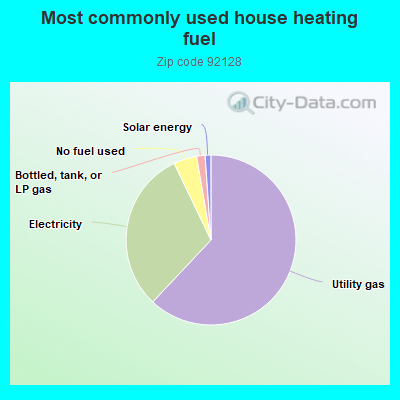
61.9%Utility gas
30.8%Electricity
4.4%No fuel used
1.6%Bottled, tank, or LP gas
1.1%Solar energy
Population in 1990: 30,437. Population change in the 1990s: +12,291 (+40.4%).
Place of birth for U.S.-born residents:
This state: 19,384
Northeast: 4,158
Midwest: 5,094
South: 3,220
West: 2,552
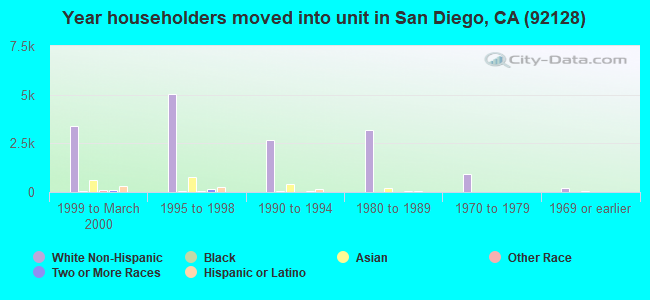
46% of the 92128 zip code residents lived in the same house 5 years ago. Out of people who lived in different houses, 60% lived in this county. Out of people who lived in different counties, 50% lived in California.
86% of the 92128 zip code residents lived in the same house 1 year ago. Out of people who lived in different houses, 64% moved from this county. Out of people who lived in different houses, 9% moved from different county within same state. Out of people who lived in different houses, 12% moved from different state. Out of people who lived in different houses, 14% moved from abroad.
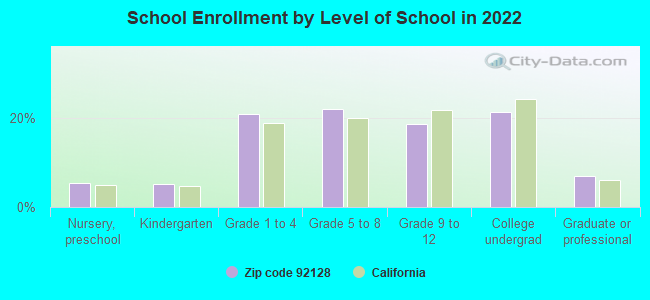
Private vs. public school enrollment:
Students in private schools in grades 1 to 8 (elementary and middle school): 511
Here:
11.3%
California:
10.5%
Students in private schools in grades 9 to 12 (high school): 102
Here:
5.2%
California:
8.5%
Students in private undergraduate colleges: 268
Here:
12.0%
California:
15.9%
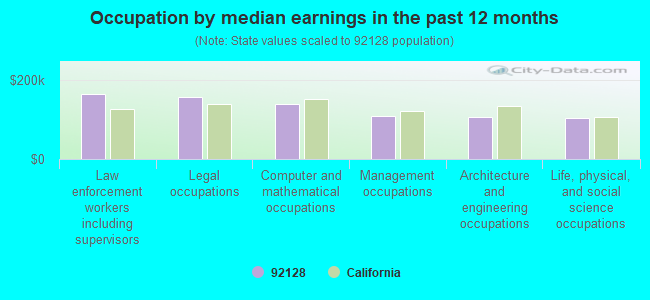
Occupation by median earnings in the past 12 months ($)
165,561Law enforcement workers including supervisors
157,213Legal occupations
138,469Computer and mathematical occupations
109,473Management occupations
107,445Architecture and engineering occupations
103,781Life, physical, and social science occupations
Companies with biggest federal contracts located in this zip code (SAN DIEGO, CA):
NORTHROP GRUMMAN SPACE & MISSI (ONE RANCHO CARMEL) : $210,456,760 in 279 contractsfrom 1999 to 2006
Contracts for Defense Aircraft -- Engineering Development (R&D), Miscellaneous Communication Equipment, Engineering and Technical Services, Systems Engineering Services, and moreby Army, Navy, Air Force, Department of Defense, and others Signed by year:2000: $14,448,194; 2001: $29,769,400; 2002: $10,057,632; 2003: $12,230,026; 2004: $82,895,277; 2005: $26,451,566; 2006: $30,063,718.
Biggest contracts:
$52,501,035 with Army for Defense Aircraft -- Engineering Development (R&D). Signed on 2004-09-10. Completion date: 2005-09-30.
$17,828,321 with Navy for Miscellaneous Communication Equipment. Signed on 2001-09-07. Completion date: 2004-04-30.
$12,182,657 with Army for Defense Aircraft -- Engineering Development (R&D). Signed on 2006-05-24. Completion date: 2005-09-30.
$7,901,912 with Air Force for Engineering and Technical Services. Taking place in GA. Signed on 2004-08-13. Completion date: 2005-12-30.
VASQUEZ+MARSHALL & ASSOCIATES (13220 EVENING CREEK DRIVE,; small business) : $15,795,052 in 200 contractsfrom 1999 to 2006
Contracts for Architect - Engineer Services (including landscaping, interior layout, and designing), Administrative and Service Buildings, A&E Production Engineering Services (including Design and Control, and Building Programming), Land Surveys, Cadastral Services (non-construction), and moreby Navy Signed by year:2000: $637,025; 2001: $1,435,736; 2002: $1,240,947; 2003: $3,160,285; 2004: $3,780,574; 2005: $4,921,581; 2006: $470,074.
Biggest contracts:
$981,143 with Navy for Architect - Engineer Services (including landscaping, interior layout, and designing). Signed on 2005-07-06. Completion date: 2006-02-07.
$634,004 with Navy for Administrative and Service Buildings. Signed on 2003-03-21. Completion date: 2004-01-25.
$601,056 with Navy for Architect - Engineer Services (including landscaping, interior layout, and designing). Signed on 2003-09-16. Completion date: 2006-12-15.
$441,599, same as above.Signed on 2005-08-16. Completion date: 2007-03-31.
SPIN PHYSICS INCORPORATED (12205 WORLD TRADE DRIVE; small business) : $1,123,825 in 14 contractsfrom 1999 to 2003
Contracts for Sound Recording and Reproducing Equipment, Airframe Structural Components, ADP Support Equipment, Miscellaneous Items, and moreby Navy, Defense Logistics Agency Signed by year:2000: $247,643; 2001: $604,543; 2002: $56,171; 2003: $142,850; 2004: $0; 2005: $0; 2006: $0.
Biggest contracts:
$355,695 with Navy for Sound Recording and Reproducing Equipment. Signed on 2001-12-13. Completion date: 2002-03-29.
$142,850 with Navy for Airframe Structural Components. Signed on 2003-01-28. Completion date: 2004-01-31.
$123,120 with Navy for ADP Support Equipment. Signed on 2001-10-05. Completion date: 2001-11-20.
$111,559 with Navy for Miscellaneous Items. Signed on 2002-03-27. Completion date: 2002-06-15.
PROTOGATE, INC (12225 WORLD TRADE DR STE R; small business) : $1,099,689 in 11 contractsfrom 2000 to 2006
Contracts for ADP Data Conversion Services, Miscellaneous Electrical and Electronic Components, ADP Components, Electrical and Electronic assemblies, Boards, Cards, and Associated Hardware, and moreby Navy, Air Force, U.S. Coast Guard Signed by year:2000: $33,000; 2001: $0; 2002: $29,565; 2003: $138,617; 2004: $485,127; 2005: $7,326; 2006: $406,054.
Biggest contracts:
$402,137 with Navy for ADP Data Conversion Services. Signed on 2004-07-14. Completion date: 2010-07-13.
$401,045 with Air Force for Miscellaneous Electrical and Electronic Components. Taking place in NE. Signed on 2006-06-28. Completion date: 2006-07-20.
$70,022 with U.S. Coast Guard for ADP Components. Taking place in VA. Signed on 2003-09-15. Completion date: 2003-10-15.
$53,425 with Air Force for Electrical and Electronic assemblies, Boards, Cards, and Associated Hardware. Signed on 2004-07-21. Completion date: 2005-04-30.
STARMARK, INC (12172 RANCHO BERNARDO ROAD; small business) : $706,356 in 7 contractsfrom 2000 to 2006
Contracts for Other Defense -- Operational Systems Development (R&D), Other Defense -- Applied Research and Exploratory Development (R&D), Other Research and Development -- Basic Research (R&D), Other Defense -- Advanced Development (R&D), and moreby Air Force, Department of Defense, Navy, Missile Defense Agency, and others Signed by year:2000: $98,257; 2001: $69,983; 2002: $0; 2003: $69,829; 2004: $99,997; 2005: $200,000; 2006: $168,290.
Biggest contracts:
$200,000 with Air Force for Other Defense -- Operational Systems Development (R&D). Signed on 2005-09-29. Completion date: 2006-03-15.
$168,357, same as above.Signed on 2006-04-07. Completion date: 2006-09-25.
$99,997, same as above.Signed on 2004-05-26. Completion date: 2005-01-24.
$98,257 with Department of Defense for Other Defense -- Applied Research and Exploratory Development (R&D). Signed on 2000-05-02. Completion date: 2000-10-29.
BUCCI, GENE A (12476 CREEKVIEW DR; small business) : $649,600 in 3 contractsfrom 2005 to 2006
$496,000 with Navy for Non-nuclear Ship Repair (West) Ship repair (including overhauls and conversions) performed on. non-nuclear propelled and nonpropelled ships west of the 108th meridian. Signed on 2006-02-08. Completion date: 2006-04-01.
$97,600, same as above.Signed on 2005-01-27. Completion date: 2005-02-01.
$56,000, same as above.Signed on 2005-05-09. Completion date: 2005-05-10.
R W BECK (15373 INNOVATION DR # 210) : $609,756 in 37 contractsfrom 2000 to 2004
Contracts for Other Non-Building Structures, Architect - Engineer Services (including landscaping, interior layout, and designing) by Navy Signed by year:2000: $543,876; 2001: $35,067; 2002: $44,966; 2003: $4,208; 2004: -$18,361; 2005: $0; 2006: $0.
Biggest contracts:
$358,270 with Navy for Other Non-Building Structures. Signed on 2000-05-17. Completion date: 2000-05-20.
$148,186, same as above.Signed on 2000-04-21. Completion date: 2000-02-06.
$51,406, same as above.Signed on 2002-01-15. Completion date: 2000-05-20.
$28,000 with Navy for Architect - Engineer Services (including landscaping, interior layout, and designing). Signed on 2000-08-30. Completion date: 2001-08-30.
NAYLOR & NAYLOR (12322 CREEKVIEW DR; small business) : $571,665 in 10 contractsfrom 1999 to 2003
Contracts for Library Services, Newspapers and Periodicals, Education Services by Army, Air Force, Defense Advanced Research Projects Agency, U.S. Army Corps of Engineers - civil program financing only, and others Signed by year:2000: $51,876; 2001: $344,777; 2002: $0; 2003: $32,965; 2004: $0; 2005: $0; 2006: $0.
Biggest contracts:
$197,638 with Army for Library Services. Signed on 2001-12-10. Completion date: 2001-12-31.
$147,139 with Army for Newspapers and Periodicals. Signed on 2001-01-30. Completion date: 2001-12-31.
$142,047, same as above.Signed on 1999-12-15. Completion date: 2000-12-31.
$101,900 with Air Force for Newspapers and Periodicals. Signed on 2003-11-20. Completion date: 2004-12-31.
ST BERNARD SOFTWARE, INC (15015 AVE OF SCIENCE; small business) : $548,333 in 70 contractsfrom 2003 to 2006
Contracts for ADP Components, ADP Software, Technology Sharing/Utilization Services, , and moreby Army, Office of Personnel Management, Bureau of Reclamation, Indian Affairs (Assistant Secretary), and others Signed by year:2000: $0; 2001: $0; 2002: $0; 2003: $85,371; 2004: $208,020; 2005: $154,568; 2006: $100,374.
Biggest contracts:
$28,795 with Army for ADP Components. Taking place in PA. Signed on 2003-08-27. Completion date: 2003-09-30.
$27,540 with Army for ADP Software. Signed on 2004-10-27. Completion date: 2006-09-27.
$27,456 with Office of Personnel Management for ADP Software. Signed on 2003-09-15. Completion date: 2003-09-15.
$23,021 with Bureau of Reclamation for ADP Software. Taking place in UT. Signed on 2004-07-19. Completion date: 2005-07-18.
TRW INC (15120 INNOVATION DR) : $453,342 in 4 contractsfrom 1999 to 2000
$270,871 with Air Force for Other Professional Services. Signed on 2000-02-18. Completion date: 2001-03-31.
$99,967 with Air Force for Engineering and Technical Services. Signed on 2000-03-23. Completion date: 2001-03-01.
$57,504 with Air Force for Other Professional Services. Signed on 1999-12-13. Completion date: 2001-03-31.
$25,000, same as above.Signed on 1999-11-08. Completion date: 2001-03-31.
Top industries in this zip code by the number of employees in 2005:
Finance and Insurance: Real Estate Credit (100-249: 2, 50-99: 1, 20-49: 2, 10-19: 1, 5-9: 3, 1-4: 4)
Health Care and Social Assistance: Nursing Care Facilities (100-249: 3, 1-4: 1)
Professional, Scientific, and Technical Services: Research and Development in the Physical, Engineering, and Life Sciences (100-249: 1, 50-99: 2, 20-49: 3, 5-9: 1, 1-4: 5)
2005 - 2018 National Fire Incident Reporting System (NFIRS) incidents
According to the data from the years 2005 - 2018 the average number of fires per year is 37. The highest number of reported fire incidents - 66 took place in 2017, and the least - 2 in 2006. The data has an increasing trend.
When looking into fire subcategories, the most reports belonged to: Structure Fires (50.5%), and Mobile Property/Vehicle Fires (28.3%).
Fire incident types reported to NFIRS in Zip Code 92128
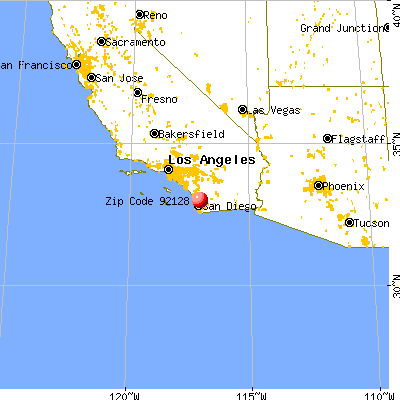


 Nearest zip codes: 92064, 92127, 92129, 92145, 92029, 92025.
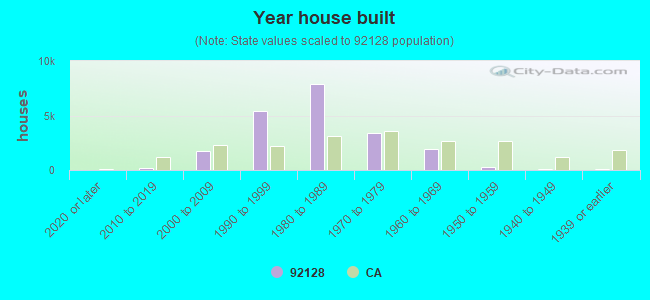


 . Federal Facility

 According to the data from the years 2005 - 2018 the average number of fires per year is 37. The highest number of reported fire incidents - 66 took place in 2017, and the least - 2 in 2006. The data has an increasing trend.
 When looking into fire subcategories, the most reports belonged to: Structure Fires (50.5%), and Mobile Property/Vehicle Fires (28.3%).