Estimated zip code population in 2022: 52,059 Zip code population in 2010: 51,536 Zip code population in 2000: 47,217
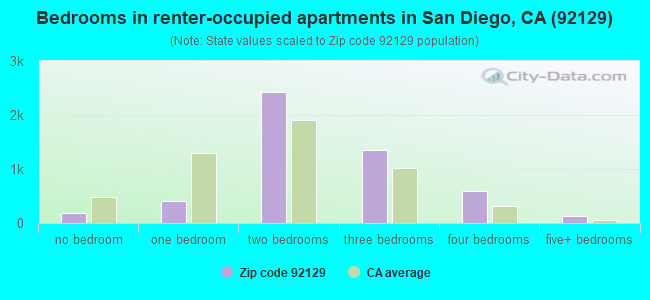
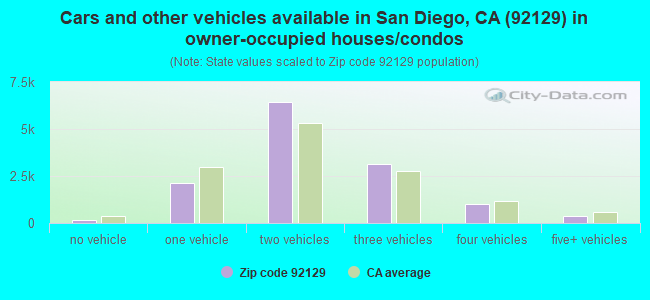
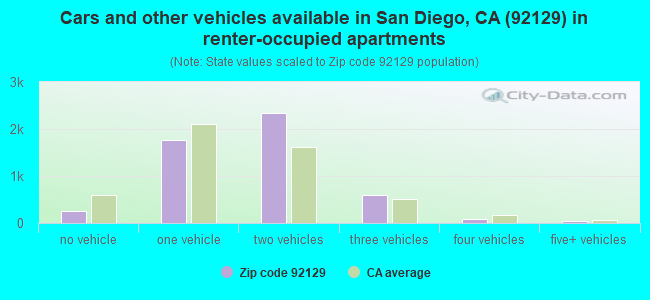
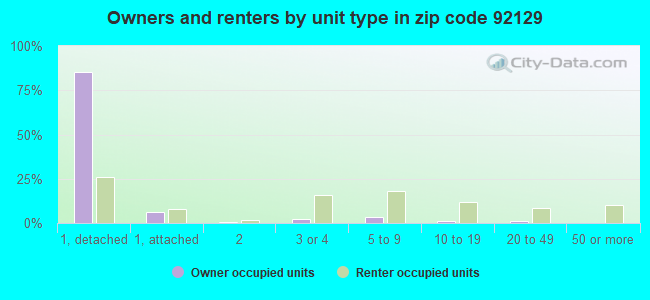
Houses and condos: 18,900 Renter-occupied apartments: 5,111
% of renters here:
28%
State:
44%
March 2022 cost of living index in zip code 92129: 122.5 (high, U.S. average is 100)
Land area: 14.1 sq. mi. Water area: 0.0 sq. mi.
Population density: 3,703 people per square mile
(average).
OSM Map
General Map
Google Map
MSN Map
OSM Map
General Map
Google Map
MSN Map
OSM Map
General Map
Google Map
MSN Map
OSM Map
General Map
Google Map
MSN Map
Please wait while loading the map...
Real estate property taxes paid for housing units in 2022:
This zip code:
0.7% ($6,599)
California:
0.7% ($4,831)
Median real estate property taxes paid for housing units with mortgages in 2022: $7,481 (0.7%) Median real estate property taxes paid for housing units with no mortgage in 2022: $4,785 (0.5%)
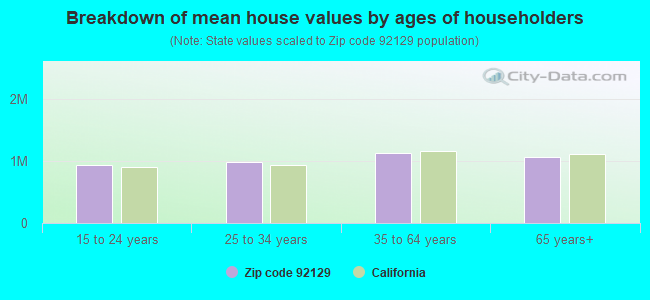
Estimated median house/condo value in 2022: $1,012,445
92129:
$1,012,445
California:
$715,900
According to our research of California and other state lists, there were 14 registered sex offenders living in 92129 zip code as of April 27, 2024. The ratio of all residents to sex offenders in zip code 92129 is 4,041 to 1. The ratio of registered sex offenders to all residents in this zip code is much lower than the state average.
Median resident age:
This zip code:
41.5 years
California median age:
37.9 years
Average household size:
This zip code:
2.8 people
California:
2.8 people
Averages for the 2020 tax year for zip code 92129, filed in 2021:
Average Adjusted Gross Income (AGI) in 2020: $128,354 (Individual Income Tax Returns)
Here:
$128,354
State:
$95,910
Salary/wage: $114,619 (reported on 83.0% of returns)
Here:
$114,619
State:
$77,331
(% of AGI for various income ranges: 1162.1% for AGIs below $25k, 3730.5% for AGIs $25k-50k, 6995.1% for AGIs $50k-75k, 10156.1% for AGIs $75k-100k, 21429.1% for AGIs $100k-200k, 95968.0% for AGIs over 200k)
Taxable interest for individuals: $1,319 (reported on 51.0% of returns)
This zip code:
$1,319
California:
$2,294
(% of AGI for various income ranges: 20.8% for AGIs below $25k, 35.5% for AGIs $25k-50k, 76.5% for AGIs $50k-75k, 95.3% for AGIs $75k-100k, 178.4% for AGIs $100k-200k, 510.7% for AGIs over 200k)
Ordinary dividends: $5,382 (reported on 36.9% of returns)
Here:
$5,382
State:
$10,949
(% of AGI for various income ranges: 38.9% for AGIs below $25k, 60.8% for AGIs $25k-50k, 96.4% for AGIs $50k-75k, 234.4% for AGIs $75k-100k, 434.7% for AGIs $100k-200k, 2067.5% for AGIs over 200k)
Net capital gain/loss in AGI: +$25,210 (reported on 35.7% of returns)
Here:
+$25,210
State:
+$49,306
(% of AGI for various income ranges: 29.0% for AGIs below $25k, 71.1% for AGIs $25k-50k, 118.1% for AGIs $50k-75k, 301.1% for AGIs $75k-100k, 734.1% for AGIs $100k-200k, 13988.5% for AGIs over 200k)
Profit/loss from business: +$16,491 (reported on 17.6% of returns)
Here:
+$16,491
State:
+$15,671
(% of AGI for various income ranges: 123.0% for AGIs below $25k, 201.6% for AGIs $25k-50k, 311.2% for AGIs $50k-75k, 366.5% for AGIs $75k-100k, 608.0% for AGIs $100k-200k, 2453.8% for AGIs over 200k)
Taxable individual retirement arrangement distribution: $25,340 (reported on 9.5% of returns)
92129:
$25,340
California:
$23,505
(% of AGI for various income ranges: 55.6% for AGIs below $25k, 115.5% for AGIs $25k-50k, 282.5% for AGIs $50k-75k, 397.6% for AGIs $75k-100k, 805.7% for AGIs $100k-200k, 1478.0% for AGIs over 200k)
Self-employed (Keogh) retirement plans: $27,880 (reported on 1.4% of returns)
92129:
$27,880
California:
$30,163
(% of AGI for various income ranges: 22.4% for AGIs $50k-75k, 22.2% for AGIs $75k-100k, 56.6% for AGIs $100k-200k, 533.2% for AGIs over 200k)
Total itemized deductions: $33,390 (reported on 23.1% of returns)
Here:
$33,390
State:
$39,517
(% of AGI for various income ranges: 103.5% for AGIs below $25k, 245.9% for AGIs $25k-50k, 607.1% for AGIs $50k-75k, 1007.8% for AGIs $75k-100k, 2252.4% for AGIs $100k-200k, 6504.6% for AGIs over 200k)
Charity contributions: $6,661 (reported on 19.5% of returns)
Here:
$6,661
State:
$12,598
(% of AGI for various income ranges: 5.2% for AGIs below $25k, 22.2% for AGIs $25k-50k, 74.7% for AGIs $50k-75k, 106.3% for AGIs $75k-100k, 334.4% for AGIs $100k-200k, 1359.1% for AGIs over 200k)
Taxes paid: $9,179 (reported on 23.0% of returns)
92129:
$9,179
State:
$8,807
(% of AGI for various income ranges: 19.3% for AGIs below $25k, 56.1% for AGIs $25k-50k, 146.5% for AGIs $50k-75k, 285.6% for AGIs $75k-100k, 689.8% for AGIs $100k-200k, 1686.6% for AGIs over 200k)
Earned income credit: $1,741 (reported on 6.6% of returns)
Here:
$1,741
State:
$2,074
(% of AGI for various income ranges: 47.6% for AGIs below $25k, 44.7% for AGIs $25k-50k, 0.6% for AGIs $50k-75k)
Percentage of individuals using paid preparers for their 2020 taxes: 92.5%
Here:
92%
State:
92%
(% for various income ranges: 91.5% for AGIs below $25k, 92.9% for AGIs $25k-50k, 91.4% for AGIs $50k-75k, 93.5% for AGIs $75k-100k, 92.0% for AGIs $100k-200k, 93.8% for AGIs over 200k)
Averages for the 2012 tax year for zip code 92129, filed in 2013:
Average Adjusted Gross Income (AGI) in 2012: $92,998 (Individual Income Tax Returns)
Here:
$92,998
State:
$72,726
Salary/wage: $85,668 (reported on 87.8% of returns)
Here:
$85,668
State:
$59,079
(% of AGI for various income ranges: 79.2% for AGIs below $25k, 81.5% for AGIs $25k-50k, 78.9% for AGIs $50k-75k, 79.7% for AGIs $75k-100k, 84.3% for AGIs $100k-200k, 78.0% for AGIs over 200k)
Taxable interest for individuals: $916 (reported on 50.0% of returns)
This zip code:
$916
California:
$2,146
(% of AGI for various income ranges: 1.2% for AGIs below $25k, 0.7% for AGIs $25k-50k, 0.6% for AGIs $50k-75k, 0.5% for AGIs $75k-100k, 0.4% for AGIs $100k-200k, 0.5% for AGIs over 200k)
Ordinary dividends: $3,054 (reported on 31.2% of returns)
Here:
$3,054
State:
$9,308
(% of AGI for various income ranges: 1.6% for AGIs below $25k, 0.9% for AGIs $25k-50k, 1.1% for AGIs $50k-75k, 1.0% for AGIs $75k-100k, 0.9% for AGIs $100k-200k, 1.2% for AGIs over 200k)
Net capital gain/loss in AGI: +$9,436 (reported on 27.8% of returns)
Here:
+$9,436
State:
+$30,460
(% of AGI for various income ranges: 0.2% for AGIs $25k-50k, 0.3% for AGIs $50k-75k, 0.4% for AGIs $75k-100k, 0.8% for AGIs $100k-200k, 7.0% for AGIs over 200k)
Profit/loss from business: +$16,134 (reported on 17.9% of returns)
Here:
+$16,134
State:
+$17,064
(% of AGI for various income ranges: 9.5% for AGIs below $25k, 4.9% for AGIs $25k-50k, 3.8% for AGIs $50k-75k, 2.9% for AGIs $75k-100k, 2.6% for AGIs $100k-200k, 2.6% for AGIs over 200k)
Taxable individual retirement arrangement distribution: $18,828 (reported on 7.8% of returns)
92129:
$18,828
California:
$19,557
(% of AGI for various income ranges: 2.3% for AGIs below $25k, 2.2% for AGIs $25k-50k, 2.2% for AGIs $50k-75k, 2.2% for AGIs $75k-100k, 1.6% for AGIs $100k-200k, 1.1% for AGIs over 200k)
Self-employment retirement plans: $19,938 (reported on 1.4% of returns)
92129:
$19,938
California:
$24,530
(% of AGI for various income ranges: 0.2% for AGIs $50k-75k, 0.2% for AGIs $100k-200k, 0.5% for AGIs over 200k)
Total itemized deductions: $31,830 (21% of AGI, reported on 50.9% of returns)
Here:
$31,830
State:
$34,004
Here:
21.4% of AGI
State:
22.7% of AGI
(% of AGI for various income ranges: 12.4% for AGIs below $25k, 12.8% for AGIs $25k-50k, 16.7% for AGIs $50k-75k, 18.4% for AGIs $75k-100k, 19.5% for AGIs $100k-200k, 16.4% for AGIs over 200k)
Charity contributions: $3,380 (reported on 44.5% of returns)
Here:
$3,380
State:
$4,659
(% of AGI for various income ranges: 0.6% for AGIs below $25k, 1.0% for AGIs $25k-50k, 1.5% for AGIs $50k-75k, 1.7% for AGIs $75k-100k, 1.9% for AGIs $100k-200k, 1.5% for AGIs over 200k)
Taxes paid: $13,777 (reported on 50.8% of returns)
92129:
$13,777
State:
$14,448
(% of AGI for various income ranges: 2.4% for AGIs below $25k, 3.0% for AGIs $25k-50k, 4.6% for AGIs $50k-75k, 6.1% for AGIs $75k-100k, 8.0% for AGIs $100k-200k, 9.3% for AGIs over 200k)
Earned income credit: $1,832 (reported on 9.1% of returns)
Here:
$1,832
State:
$2,286
(% of AGI for various income ranges: 3.9% for AGIs below $25k, 0.8% for AGIs $25k-50k)
Percentage of individuals using paid preparers for their 2012 taxes: 48.8%
Here:
49%
State:
64%
(% for various income ranges: 44.2% for AGIs below $25k, 47.6% for AGIs $25k-50k, 52.0% for AGIs $50k-75k, 51.5% for AGIs $75k-100k, 49.7% for AGIs $100k-200k, 54.2% for AGIs over 200k)
Averages for the 2004 tax year for zip code 92129, filed in 2005:
Average Adjusted Gross Income (AGI) in 2004: $69,399 (Individual Income Tax Returns)
Here:
$69,399
State:
$58,600
Salary/wage: $66,478 (reported on 90.0% of returns)
Here:
$66,478
State:
$49,455
(% of AGI for various income ranges: 157.4% for AGIs below $10k, 83.3% for AGIs $10k-25k, 84.2% for AGIs $25k-50k, 85.3% for AGIs $50k-75k, 87.9% for AGIs $75k-100k, 85.7% for AGIs over 100k)
Taxable interest for individuals: $844 (reported on 59.9% of returns)
This zip code:
$844
California:
$2,365
(% of AGI for various income ranges: 6.3% for AGIs below $10k, 1.4% for AGIs $10k-25k, 1.1% for AGIs $25k-50k, 0.8% for AGIs $50k-75k, 0.7% for AGIs $75k-100k, 0.6% for AGIs over 100k)
Taxable dividends: $1,567 (reported on 32.5% of returns)
Here:
$1,567
State:
$4,746
(% of AGI for various income ranges: 4.6% for AGIs below $10k, 0.9% for AGIs $10k-25k, 0.8% for AGIs $25k-50k, 0.7% for AGIs $50k-75k, 0.6% for AGIs $75k-100k, 0.7% for AGIs over 100k)
Net capital gain/loss: +$5,171 (reported on 29.2% of returns)
Here:
+$5,171
State:
+$23,418
(% of AGI for various income ranges: -1.7% for AGIs below $10k, 0.2% for AGIs $10k-25k, 0.3% for AGIs $25k-50k, 0.2% for AGIs $50k-75k, 0.5% for AGIs $75k-100k, 3.4% for AGIs over 100k)
Profit/loss from business: +$14,991 (reported on 17.5% of returns)
Here:
+$14,991
State:
+$16,826
(% of AGI for various income ranges: -0.3% for AGIs below $10k, 6.6% for AGIs $10k-25k, 5.3% for AGIs $25k-50k, 4.3% for AGIs $50k-75k, 3.7% for AGIs $75k-100k, 3.3% for AGIs over 100k)
IRA payment deduction: $3,202 (reported on 3.8% of returns)
92129:
$3,202
California:
$3,192
(% of AGI for various income ranges: 0.4% for AGIs below $10k, 0.2% for AGIs $10k-25k, 0.4% for AGIs $25k-50k, 0.3% for AGIs $50k-75k, 0.2% for AGIs $75k-100k, 0.1% for AGIs over 100k)
Self-employed pension: $13,738 (reported on 1.9% of returns)
Here:
$13,738
California:
$17,688
(% of AGI for various income ranges: 0.1% for AGIs $10k-25k, 0.1% for AGIs $25k-50k, 0.2% for AGIs $50k-75k, 0.3% for AGIs $75k-100k, 0.5% for AGIs over 100k)
Total itemized deductions: $27,348 (25% of AGI, reported on 53.5% of returns)
Here:
$27,348
State:
$28,113
Here:
25.1% of AGI
State:
25.3% of AGI
(% of AGI for various income ranges: 21.7% for AGIs below $10k, 13.3% for AGIs $10k-25k, 19.3% for AGIs $25k-50k, 24.3% for AGIs $50k-75k, 24.9% for AGIs $75k-100k, 20.3% for AGIs over 100k)
Charity contributions deductions: $2,904 (3% of AGI, reported on 49.0% of returns)
Here:
$2,904
State:
$3,923
Here:
2.6% of AGI
State:
3.3% of AGI
(% of AGI for various income ranges: 1.0% for AGIs below $10k, 1.0% for AGIs $10k-25k, 1.7% for AGIs $25k-50k, 2.3% for AGIs $50k-75k, 2.4% for AGIs $75k-100k, 2.1% for AGIs over 100k)
Total tax: $10,580 (reported on 82.6% of returns)
92129:
$10,580
State:
$10,761
(% of AGI for various income ranges: 5.1% for AGIs below $10k, 4.9% for AGIs $10k-25k, 7.1% for AGIs $25k-50k, 8.4% for AGIs $50k-75k, 9.2% for AGIs $75k-100k, 15.6% for AGIs over 100k)
Earned income credit: $1,530 (reported on 7.6% of returns)
Here:
$1,530
State:
$1,763
Percentage of individuals using paid preparers for their 2004 taxes: 51.1%
Here:
51%
State:
66%
(% for various income ranges: 40.7% for AGIs below $10k, 50.9% for AGIs $10k-25k, 54.0% for AGIs $25k-50k, 55.2% for AGIs $50k-75k, 52.4% for AGIs $75k-100k, 53.7% for AGIs over 100k)
Likely homosexual households (counted as self-reported same-sex unmarried-partner households)
Lesbian couples: 0.1% of all households
Gay men: 0.0% of all households
Household received Food Stamps/SNAP in the past 12 months: 1,032 Household did not receive Food Stamps/SNAP in the past 12 months: 17,046
Women who had a birth in the past 12 months: 753 (701 now married, 48 unmarried) Women who did not have a birth in the past 12 months: 11,194 (5,921 now married, 5,210 unmarried)
Housing units in zip code 92129 with a mortgage: 9,550 (1,097 second mortgage, 28 home equity loan, 999 both second mortgage and home equity loan) Houses without a mortgage: 43
Median monthly owner costs for units with a mortgage: $3,286 Median monthly owner costs for units without a mortgage: $874
Residents with income below the poverty level in 2022:
This zip code:
6.2%
Whole state:
12.2%
Residents with income below 50% of the poverty level in 2022:
This zip code:
2.7%
Whole state:
6.2%
Median number of rooms in houses and condos:
Here:
6.9
State:
6.0
Median number of rooms in apartments:
Here:
4.3
State:
3.9
Notable locations in this zip code not listed on our city pages
Notable locations in zip code 92129: Penasquitos Ranch (A), Rancho Los Penasquitos Golf Course (B), Rancho Penasquitos Branch San Diego Public Library (C), San Diego Fire - Rescue Department Station 40 (D). Display/hide their locations on the map
Churches in zip code 92129 include: Penasquitos Nazarene Church (A), Saint Timothys Church (B), Sabre Springs Foursquare Church (C), Penasquitos Lutheran Church (D), New Hope Church of Penasquitos (E), Mount Carmel Church of the Nazarene (F). Display/hide their locations on the map
Parks in zip code 92129 include: Adobe Bluffs Park (1), Canyonside Community Park (2), Twin Trails Park (3), Ridgewood Park (4), Views West Park (5), Black Mountain Open Space (6), Black Mountain Park (7), Hilltop Community Park (8), Rolling Hills Park (9). Display/hide their locations on the map
In group quarters: 124 (-1 institutionalized population)
Size of family households: 5,751 2-persons, 3,460 3-persons, 3,572 4-persons, 1,242 5-persons, 345 6-persons, 205 7-or-more-persons
Size of nonfamily households: 2,568 1-person, 995 2-persons, 140 3-persons
9,678 married couples with children.
1,472 single-parent households (460 men, 1,012 women).
63.9% of residents of 92129 zip code speak English at home.
4.1% of residents speak Spanish at home (75% very well, 12% well, 7% not well, 6% not at all).
9.6% of residents speak other Indo-European language at home (80% very well, 8% well, 10% not well, 2% not at all).
21.2% of residents speak Asian or Pacific Island language at home (58% very well, 27% well, 12% not well, 3% not at all).
1.2% of residents speak other language at home (57% very well, 41% well, 3% not well).
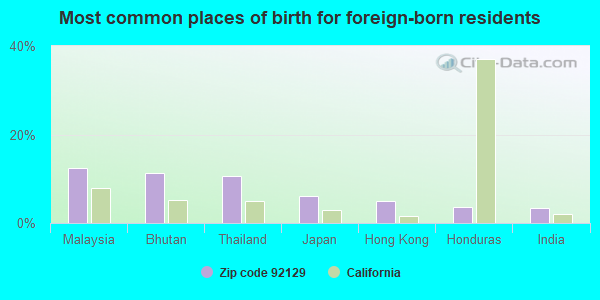
Foreign born population: 15,885 (30.5%) (68.8% of them are naturalized citizens)
Major facilities with environmental interests located in this zip code:
FARAHS CLEANERS & TAILORING (9724 CARMEL MTN RD in SAN DIEGO, CA)
STATE MASTER (California - Hazardous Waste Tracking) - HAZARDOU WASTE PROGRAM CRITERIA AND HAZARDOUS AIR POLLUTANT INVENTORY (Inventory of air pollution sources) Small Quantity Generators, between 100 kg and 1000 kg of hazardous waste/month (Resource Conservation and Recovery Act (tracking hazardous waste)) - notification Business SIC classification: DRYCLEANING PLANTS, EXCEPT RUG CLEANING Organizations: MEHRARA MICHAEL (CONTACT/OWNER)
EQUILON ENTERPRISES (9205 TWIN TRAILS in SAN DIEGO, CA) . Federal Facility
STATE MASTER (California - Hazardous Waste Tracking) - HAZARDOU WASTE PROGRAM CRITERIA AND HAZARDOUS AIR POLLUTANT INVENTORY (Inventory of air pollution sources) Small Quantity Generators, between 100 kg and 1000 kg of hazardous waste/month (Resource Conservation and Recovery Act (tracking hazardous waste)) - notification Business SIC classification: GASOLINE SERVICE STATIONS Organizations: EQUILON ENTERPRISES L L C (CONTACT/OWNER)
Alternative names: TEXACO #120655, TEXACO SERVICE STATION
ADOBE BLUFFS ELEMENTARY SCHOOL (8707 ADOBE BLUFFS DR in SAN DIEGO, CA)
(Geographic Names Information System) (National Center for Education Statistics) - STATE ID-6110878 Organizations: POWAY UNIFIED (SCHOOL DISTRICT)
CHEVRON STATION NO 96929 (11095 CARMEL MT RD in SAN DIEGO, CA)
STATE MASTER (California - Hazardous Waste Tracking) - HAZARDOU WASTE PROGRAM Small Quantity Generators, between 100 kg and 1000 kg of hazardous waste/month (Resource Conservation and Recovery Act (tracking hazardous waste)) - notification Organizations: CHEVRON PRODUCTS CO (CONTACT/OWNER)
LOS PENASQUITOS ELEMENTARY (14125 CUCA ST. in SAN DIEGO, CA)
(National Center for Education Statistics) - STATE ID-6070841 Organizations: POWAY UNIFIED (SCHOOL DISTRICT)
MESA VERDE MIDDLE (8375 ENTREKEN WAY in SAN DIEGO, CA)
(National Center for Education Statistics) - STATE ID-6111306 Organizations: POWAY UNIFIED (SCHOOL DISTRICT)
MT. CARMEL HIGH (9550 CARMEL MOUNTAIN ROAD in SAN DIEGO, CA)
(National Center for Education Statistics) - STATE ID-3730074 Organizations: POWAY UNIFIED (SCHOOL DISTRICT)
CANYON VIEW ELEMENTARY (9225 ADOLPHIA ST. in SAN DIEGO, CA)
(National Center for Education Statistics) - STATE ID-6106520 Organizations: POWAY UNIFIED (SCHOOL DISTRICT)
EXXONMOBIL OIL CORP. (12849 RANCHO PENSASQUITOS in SAN DIEGO, CA)
HAZARDOUS WASTE BIENNIAL REPORTER (Resource Conservation and Recovery Act (tracking hazardous waste)) Large Quantity Generators, more that 1000 kg of hazardous waste/month (Resource Conservation and Recovery Act (tracking hazardous waste)) Organizations: EXXONMOBIL OIL CORPORATION (CONTACT/OWNER)
NIFGI (3115 MERRYFIELD ROW STE 2 in SAN DIEGO, CA)
(Resource Conservation and Recovery Act (tracking hazardous waste))
JULIES CLEANERS (9923 CARMEL MTN RD in SAN DIEGO, CA)
Small Quantity Generators, between 100 kg and 1000 kg of hazardous waste/month (Resource Conservation and Recovery Act (tracking hazardous waste))
JULIES CLEANERS (13289 BLACK MTN RD STA 9 in SAN DIEGO, CA)
Small Quantity Generators, between 100 kg and 1000 kg of hazardous waste/month (Resource Conservation and Recovery Act (tracking hazardous waste))
LIFECARE TECHNOLOGIES INC (9823 PACIFIC HEIGHTS BLVD in SAN DIEGO, CA)
Small Quantity Generators, between 100 kg and 1000 kg of hazardous waste/month (Resource Conservation and Recovery Act (tracking hazardous waste))
Housing units lacking complete plumbing facilities: 0.0% Housing units lacking complete kitchen facilities: 0.5%
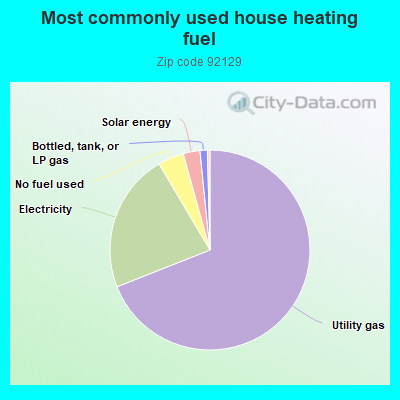
69.0%Utility gas
22.5%Electricity
4.2%No fuel used
2.7%Solar energy
1.2%Bottled, tank, or LP gas
Population in 1990: 43,092. Population change in the 1990s: +4,125 (+9.6%).
Place of birth for U.S.-born residents:
This state: 22,281
Northeast: 2,658
Midwest: 3,889
South: 3,443
West: 2,700
58% of the 92129 zip code residents lived in the same house 5 years ago. Out of people who lived in different houses, 61% lived in this county. Out of people who lived in different counties, 50% lived in California.
91% of the 92129 zip code residents lived in the same house 1 year ago. Out of people who lived in different houses, 60% moved from this county. Out of people who lived in different houses, 15% moved from different county within same state. Out of people who lived in different houses, 14% moved from different state. Out of people who lived in different houses, 13% moved from abroad.
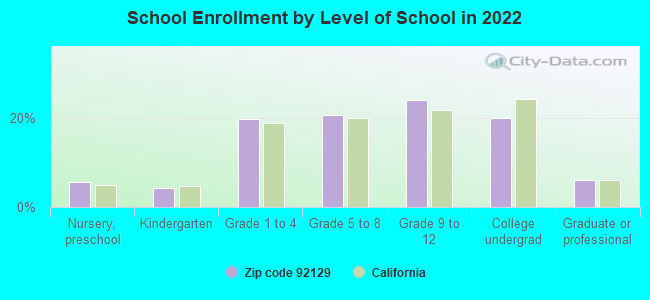
Private vs. public school enrollment:
Students in private schools in grades 1 to 8 (elementary and middle school): 637
Here:
11.4%
California:
10.5%
Students in private schools in grades 9 to 12 (high school): 91
Here:
2.7%
California:
8.5%
Students in private undergraduate colleges: 392
Here:
14.2%
California:
15.9%
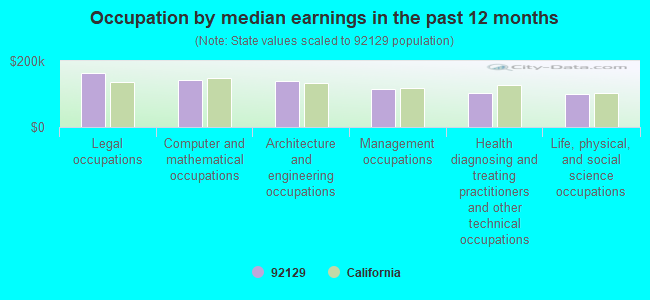
Occupation by median earnings in the past 12 months ($)
164,415Legal occupations
142,416Computer and mathematical occupations
140,530Architecture and engineering occupations
115,968Management occupations
102,734Health diagnosing and treating practitioners and other technical occupations
101,320Life, physical, and social science occupations
Companies with biggest federal contracts located in this zip code (SAN DIEGO, CA):
ANSOL, INC (13766 TORREY GLENN ROAD; small business) : $1,794,650 in 5 contractsin 2006
Contracts for Systems Engineering Services by Navy Signed by year:2000: $0; 2001: $0; 2002: $0; 2003: $0; 2004: $0; 2005: $0; 2006: $1,794,650.
Biggest contracts:
$1,037,759 with Navy for Systems Engineering Services. Signed on 2006-02-15. Completion date: 2006-12-31.
$258,000, same as above.Signed on 2006-05-31. Completion date: 2006-12-31.
$196,350, same as above.Signed on 2006-06-26. Completion date: 2006-12-31.
$158,000, same as above.Signed on 2006-06-16. Completion date: 2006-12-31.
JAMES S NEWACHECK ENTERPRISES (8025 ECLIPSE ROAD; small business) : $812,986 in 6 contractsfrom 2001 to 2005
Contracts for Optometry Services by Navy Signed by year:2000: $0; 2001: $255,404; 2002: $132,044; 2003: $136,542; 2004: $142,080; 2005: $146,916; 2006: $0.
Biggest contracts:
$146,916 with Navy for Optometry Services. Signed on 2005-04-26. Completion date: 2006-09-30.
$142,080, same as above.Signed on 2004-08-11. Completion date: 2002-09-30.
$136,542, same as above.Signed on 2003-09-16. Completion date: 2002-09-30.
$132,044, same as above.Signed on 2002-09-03. Completion date: 2002-09-30.
JACQUELINE COPPOLINO (9129 OVIEDO STREET; small business) : $441,966 in 5 contractsfrom 2000 to 2005
Contracts for Other Medical Services, Radiology Services by Navy Signed by year:2000: $78,000; 2001: $0; 2002: $0; 2003: $175,002; 2004: $92,603; 2005: $96,361; 2006: $0.
Biggest contracts:
$96,361 with Navy for Other Medical Services. Signed on 2005-10-19. Completion date: 2005-09-30.
$92,603, same as above.Signed on 2004-10-14. Completion date: 2005-09-30.
$89,394, same as above.Signed on 2003-10-01. Completion date: 2004-09-30.
$85,608, same as above.Signed on 2003-09-30. Completion date: 2004-09-30.
JAGDISH CHABRA (8241 TORREY GARDENS PLACE; small business) : $415,285 in 20 contractsfrom 2004 to 2006
Contracts for Radiology Services by Indian Health Service, Public Health Service Signed by year:2000: $0; 2001: $0; 2002: $0; 2003: $0; 2004: $116,180; 2005: $263,625; 2006: $35,480.
Biggest contracts:
$57,350 with Indian Health Service for Radiology Services. Taking place in NM. Signed on 2005-10-21. Effective on 2005-10-01. Completion date: 2005-10-01.
$55,500 with Public Health Service for Radiology Services. Taking place in NM. Signed on 2005-11-15. Completion date: 2005-11-30.
$55,500, same as above.Signed on 2005-12-05. Effective on 2005-12-01. Completion date: 2005-12-31.
$52,500 with Indian Health Service for Radiology Services. Taking place in NM. Signed on 2006-02-09. Effective on 2006-02-01. Completion date: 2006-02-28.
SAN DIEGO PERFUSION ASSOCIATES (9047 TWIN TRAILS CT) : $184,856 in 8 contractsfrom 2004 to 2005
Contracts for Surgery Services, Cardio-Vascular Services, Anesthesiology Services by Navy Signed by year:2000: $0; 2001: $0; 2002: $0; 2003: $0; 2004: $150,136; 2005: $34,720; 2006: $0.
Biggest contracts:
$40,755 with Navy for Surgery Services. Signed on 2004-04-01. Completion date: 2004-05-31.
$36,345 with Navy for Cardio-Vascular Services. Signed on 2004-08-14. Completion date: 2004-09-30.
$34,720, same as above.Signed on 2005-08-10. Completion date: 2005-09-30.
$27,705 with Navy for Surgery Services. Signed on 2004-05-10. Completion date: 2004-05-31.
BRIAN F SMITH AND ASSOCIATES (14678 IBEX COURT; small business) : $183,490 in 3 contractsfrom 2002 to 2004
$142,250 with Army for Archeological/Paleontological Studies. Signed on 2004-02-10. Completion date: 2004-05-30.
$39,740 with U.S. Army Corps of Engineers - civil program financing only for Environmental Studies and Assessments. Signed on 2002-10-15. Completion date: 2002-12-30.
$1,500 with Army for Archeological/Paleontological Studies. Signed on 2004-09-30. Completion date: 2004-05-30.
GEOVAL INC (9664 LIMAR WAY; small business) : $179,876 in 19 contractsfrom 2002 to 2006
Contracts for Other Architect and Engineering Services by Army, U.S. Army Corps of Engineers - civil program financing only Signed by year:2000: $0; 2001: $0; 2002: $5,298; 2003: $45,138; 2004: $39,565; 2005: $42,385; 2006: $47,490.
Biggest contracts:
$30,684 with Army for Other Architect and Engineering Services. Taking place in LA. Signed on 2006-03-22. Completion date: 2006-03-31.
$24,728 with Army for Other Architect and Engineering Services. Taking place in ND. Signed on 2005-12-05. Completion date: 2005-12-30.
$18,242 with Army for Other Architect and Engineering Services. Taking place in LA. Signed on 2006-01-18. Completion date: 2006-01-31.
$17,812, same as above.Signed on 2004-09-29. Completion date: 2004-12-31.
LOC QUOC VU (8956 LA CARTERA STREET; small business) : $130,456 in 2 contractsfrom 1999 to 2000
$75,168 with Navy for Other Medical Services. Signed on 1999-11-15. Completion date: 2000-09-30.
$55,288, same as above.Signed on 2000-03-29. Completion date: 2000-09-30.
DELTA SEAL & SUPPLY INC (14457 YUKON ST; small business) : $74,654 in 8 contractsfrom 2002 to 2005
Contracts for Non-nuclear Ship Repair (West) Ship repair (including overhauls and conversions) performed on. non-nuclear propelled and nonpropelled ships west of the 108th meridian, Packing and Gasket Materials by Navy Signed by year:2000: $0; 2001: $0; 2002: $43,148; 2003: $27,600; 2004: $3,601; 2005: $305; 2006: $0.
Biggest contracts:
$43,148 with Navy for Non-nuclear Ship Repair (West) Ship repair (including overhauls and conversions) performed on. non-nuclear propelled and nonpropelled ships west of the 108th meridian. Taking place in WA. Signed on 2002-12-09. Completion date: 2003-01-09.
$14,200 with Navy for Packing and Gasket Materials. Signed on 2003-08-28. Completion date: 2003-09-25.
$13,400, same as above.Signed on 2003-08-02. Completion date: 2003-09-15.
$2,000, same as above.Signed on 2004-11-19. Completion date: 2004-12-17.
SJM BIOLOGICAL CONSULTANTS (7071 CHAPALA CANYON COURT; small business) : $72,950 in 4 contractsfrom 2002 to 2004
$21,660 with Navy for Other Natural Resources and Conservation Services. Signed on 2002-09-20. Completion date: 2003-09-30.
$21,520 with Navy for Endangered Species Studies - Plant and Animal. Signed on 2004-09-16. Completion date: 2005-09-20.
$21,520 with Navy for Other Natural Resources and Conservation Services. Signed on 2003-09-18. Completion date: 2003-09-20.
$8,250, same as above.Signed on 2002-09-30. Completion date: 2003-09-30.
Top industries in this zip code by the number of employees in 2005:
2005 - 2018 National Fire Incident Reporting System (NFIRS) incidents
According to the data from the years 2005 - 2018 the average number of fires per year is 25. The highest number of reported fire incidents - 45 took place in 2010, and the least - 0 in 2006. The data has a decreasing trend.
When looking into fire subcategories, the most reports belonged to: Structure Fires (46.9%), and Outside Fires (28.1%).
Fire incident types reported to NFIRS in Zip Code 92129


 Nearest zip codes: 92127, 92126, 92128, 92067, 92130, 92131.


 According to the data from the years 2005 - 2018 the average number of fires per year is 25. The highest number of reported fire incidents - 45 took place in 2010, and the least - 0 in 2006. The data has a decreasing trend.
 When looking into fire subcategories, the most reports belonged to: Structure Fires (46.9%), and Outside Fires (28.1%).